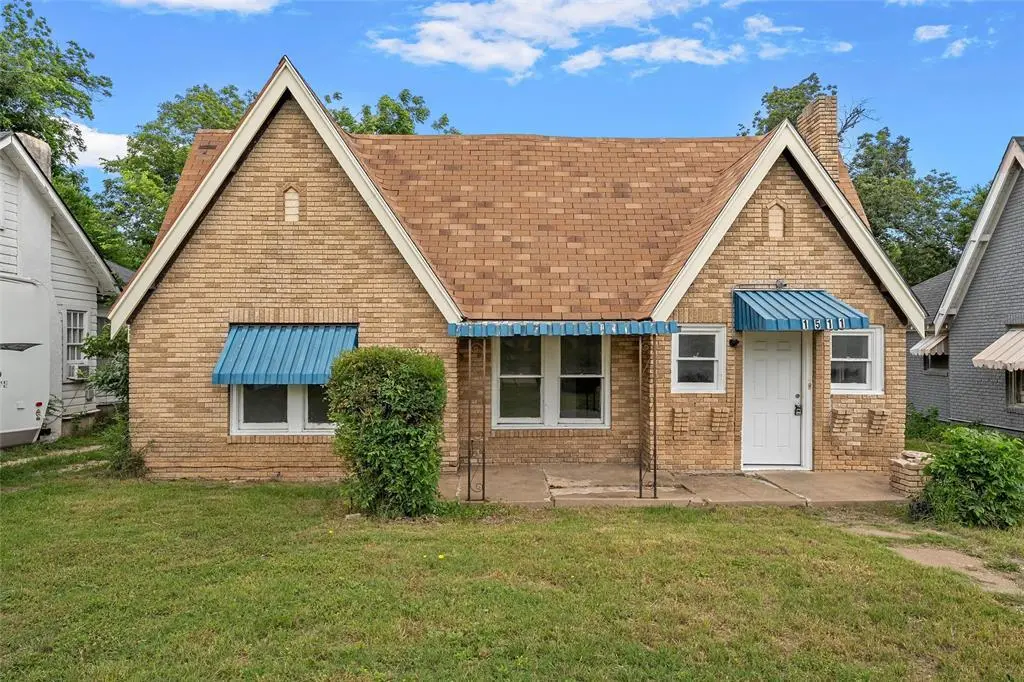
1511 Maple Ave · Waco, TX
Flood risk 1/10 · Minimal
- FEMA flood zone
- X (unshaded)
- Chance of flooding over 30 yrs
- 0.0%
- Est. flood insurance / yr
- $507 – $1,088
Fire risk 3/10 · Minor
- Est. fire insurance / yr
- $1,222 – $2,270
Heat risk 7/10 · Major
- Hot days now (above 109°F)
- 7 days/yr
- Hot days in 30 yrs
- 24 days/yr
Wind risk 6/10 · Moderate
- Chance of severe wind over 30 yrs
- 60.0%
Air-quality risk 2/10 · Minimal
- Unhealthy air days now
- 0 days/yr
- Unhealthy air days in 30 yrs
- 1 days/yr
Risk factors via First Street. Map © Google.
Why this score? — see what drove the B- grade
The composite is a weighted blend of 9 inputs, each scored 0–100. Each bar is that input's sub-score; the figure is the points it added to the 100-point composite (weight × sub-score).
- Cash flow +30.0/30.0
- 1% rule +10.0/10.0
- DSCR +10.0/10.0
- ARV discount +7.5/15.0
- Livability +3.7/5.0
- Rent growth +2.8/5.0
- Condition / age +2.5/5.0
- Schools +1.8/10.0
- Appreciation +0.0/10.0
$79,900
🖨 Deal sheet 📄 Offer letter ✓ Due diligence
Listing remarks MLS
3 Bedroom 2 Bath home in beautiful Waco TX! With almost 1500sf this is a great starter home and fixer upper.
Key facts
- Decorative fireplace
- Spacious backyard
- Tudor-style home
Tags
Property features AI
Finance
- Other: Lot smaller than 0.5 acre (approximately 0.176 acre); Subdivision: Waco Improv Co; County: McLennan
- Financial info: No second mortgage listed; Treat as clear loan type
- HOA & community: No homeowners association
Exterior
- Parking: Driveway (no garage, no covered or carport spaces listed)
- Utilities: City water; City sewer; Located outside a municipal utility district
- Home design: Single-family residence; Residential property; Attached property; Built in 1928
- Construction: Brick construction; Composition roof; Foundation details not provided
- Exterior features: Covered front and rear porches; Covered patio
Interior
- Kitchen: Kitchen (18 x 9)
- Bedrooms: Primary bedroom on main level (15 x 23); Bedroom on main level (13 x 14); Bedroom on main level (11 x 12)
- Bathrooms: 2 full bathrooms
- Heating & cooling: Fireplace in living room
- Interior features: Built-in features; One living area; One dining area; 6 rooms total; One level
- Laundry & utility: Gas water heater
Neighborhood map
What this means for you Summary
Snapshot
- This is a 3-bed/2.0-bath single-family listed at $80k.
Deal economics
- At list price, monthly cash flow is $672 ($8k/yr) — positive.
- The deal already cash-flows at list — no discount required.
- Meets the 1% rule at list price ($2k rent vs $80k).
- Recommended offer: $79k (1.5% below list) — sets the bar for market timing.
- Cap rate 16.4% vs local median 3.9% in Waco — top-decile yield for the area; either an underpriced asset or a hidden risk that comps aren't pricing in. Stress-test before assuming the spread holds.
Location & tenants
- Location reads 74/100 on livability (#166 in TX, #4,378 nationally) — a middle-class / working-renter tenant base. Strengths: cost of living A+, housing A+, health & safety A+; Watch: crime D, commute F, employment D-.
- Waco ISD (urban): math 20% / reading 24% proficiency, ranked #773 of 826 in TX (top 94%) — low school quality limits family demand, transient renter base, plan for 1-2y turnover; 81% free/reduced lunch — lower-income household profile, screen leases tightly.
- Zoned schools: Brook Avenue El (math 8% / reading 12%, grade F, #4,259 of 4,322 statewide, top 99%, 369 students, 98% FRL, charter) — zoned schools average 98% FRL vs 81% district-wide (16 pts higher); higher-poverty schools than district average — tighter screening recommended.
- Zoned-school proficiency averages 10% at this address vs 22% district-wide (-12 pts) — the specific schools serving this property underperform the Waco ISD average; the district grade overstates school quality for this exact location.
- Market conditions: Rents rising (+1.1%/yr); 144 active listings in the ZIP; 40 comparable units currently listed for rent nearby; rentals at typical pace (median 21d on market — plan ~3-4 weeks tenant-placement turnaround); lower-income renter base — watch delinquency; 1,014 units permitted in McLennan County in 2024 (200 in 5+ unit buildings).
Forward outlook
- Local home prices are declining (-3.0%/yr); year-one equity from $552 of loan paydown is wiped out by about $2k of value loss. Plan a longer hold.
- McLennan County population projected at +17% by 2050 — long-run rental-demand tailwind backs the buy-and-hold thesis.
- At projected returns (-3.0% appreciation + 1.1% rent growth), your $22k cash investment doubles in ~4 years — after that, you're playing with house money.
Negotiation context
- It's been on market 19 days — a 2% lower offer ($79k) is reasonable based on typical stale-listing flexibility.
- 2 sale attempts since 6y ago with the ask held roughly flat each time — persistent listings suggest the price (not the market) is what's stuck; bring a comps-based counter.
Risks & watch-outs
- Watch-outs: built in 1928 — expect roof / HVAC / electrical / plumbing capex.
- Climate carrying-cost: major wind risk, 60% chance of damaging wind over 30y; extreme-heat days projected 7→24/yr by 2055 (HVAC capex compounding) — expect insurance premiums to compound above CPI over the hold.
Questions for the listing agent
- Built in 1928 — when were the roof, HVAC, electrical panel, plumbing, and water heater last replaced?
- Is there a deadline driving the sale (1031 exchange, divorce, estate, relocation)? That informs how much negotiation room exists.
- Schools are D-rated, which usually means shorter tenancies and higher turnover. Who's the typical renter profile here, and what's been the actual vacancy rate?
- Crime grade is D in this area — have there been break-ins, vandalism, or insurance claims at this property in the last 3 years? What carrier currently insures it and at what premium?
- What's the average days-on-market for RENTAL listings here right now (not sales)? A rising rental-DOM trend means longer vacancies and softer asking-rent achievability than the comps imply.
- What's the recent tenant-quality profile in this submarket — average credit score on applications, eviction rate, late-payment / NSF rate, and stable-employment percentage? A property-management company in the area should have these aggregated.
- How much new for-sale + rental construction is in the pipeline within 1–3 miles? Heavy new supply typically softens prices + rents 12–24 months out; constrained supply supports both.
Investment metrics
- 1% rule
- 1.94% ✓
- Cap rate
- 16.38%
- Cash-on-cash
- 36.03%
- DSCR
- 2.60
- GRM
- 4.3
CMA / ARV
- ARV (on-the-fly)
- $231,972
- Comps found
- 12
Show comp detail 12 sales within ~0.75 mi
| Address | Dist | Beds/Ba | Sqft | Sold | Price | $/sf | Match |
|---|---|---|---|---|---|---|---|
| 1322 N 11th St | 0.46mi | 3/2.5 | 1,528 (+3%) | 2mo | $269,000 | $176 | 70 |
| 2023 Ethel Ave | 0.57mi | 3/2.0 | 1,508 (+1%) | 2mo | $220,000 | $146 | 69 |
| 1122 N 14th St | 0.56mi | 3/1.0 | 1,472 (-1%) | 1mo | $40,000 | $27 | 67 |
| 1618 N 6th St | 0.51mi | 2/2.0 (-1) | 1,451 (-2%) | 2mo | $217,000 | $150 | 66 |
| 1610 N 6th St | 0.52mi | 3/2.0 | 1,407 (-5%) | 3mo | $250,000 | $178 | 64 |
| 2401 Colcord Ave | 0.74mi | 3/2.5 | 1,478 (-1%) | 0mo | $265,000 | $179 | 62 |
| 908 N 10th St | 0.75mi | 3/2.0 | 1,487 (0%) | 4mo | $295,000 | $198 | 62 |
| 2125 Lasker Ave | 0.52mi | 3/1.0 | 1,440 (-3%) | 7mo | $224,900 | $156 | 61 |
| 1608 N 17th St | 0.25mi | 3/2.0 | 1,677 (+13%) | 8mo | $235,000 | $140 | 61 |
| 1810 N 11th St | 0.27mi | 4/2.0 (+1) | 1,676 (+13%) | 5mo | $299,000 | $178 | 57 |
| 1304 N 22nd | 0.71mi | 3/1.0 | 1,383 (-7%) | 0mo | $110,000 | $80 | 51 |
| 1123 N 14th St | 0.56mi | 3/1.0 | 1,272 (-14%) | 1mo | $40,000 | $31 | 45 |
Match score weights: distance 35% · size 25% · config 20% · recency 20%. Top-matched comps best support the ARV.
Projected returns pro-forma
-3.0% appreciation · 1.14% rent growth · sell at horizon
- IRR
- 29.6%
- Equity multiple
- 2.21×
- Total profit
- $27,007
- Equity at exit
- $11,913
- IRR
- 35.9%
- Equity multiple
- 4.01×
- Total profit
- $67,443
- Equity at exit
- $6,908
Cash invested: $22,372 (down + closing). Projections, not guarantees.
Landlord ↔ Tenant lean methodology
- Overall (STATE)
- 87 Strongly Landlord-Friendly
- State Texas
- 87 Strongly Landlord-Friendly · R+5
- County
- — inherits STATE
- City
- — inherits STATE
ZIP-level market 76707
- Rents YoY
- 1.1%
- Active inventory
- 144
- Price-to-rent
- 4.3×
Monthly cashflow live
- Estimated rent
- $1,549 high interval (Pro) →
- Mortgage (P&I)
- −$419
- Tax est. 1.5%
- −$100 /mo · $1,198/yr
- Insurance
- −$33
- HOA
- −$0
- Vacancy / Maint / Mgmt
- −$325
- Net cashflow
- $672
Break-even live
UW: 25.0% down · 7.5% · 30yr · 1.5% tax · 5.0% vac · 8.0% maint · 8.0% mgmt
Financing live
Cash to close
- Down payment
- $19,975
- Closing costs
- $2,397
- Reserves months
- —
- Total cash needed
- —
Loan-product check · same deal, 3 products live
Conventional
25% down · 7.5% · 30yr
- Down + closing
- —
- Monthly P&I
- —
- Monthly cashflow
- —
- DSCR
- —
- Eligible?
- —
Personal DTI + credit; lowest rate.
DSCR
20% down · 8.5% · 30yr
- Down + closing
- —
- Monthly P&I
- —
- Monthly cashflow
- —
- DSCR
- —
- Eligible?
- —
No personal income docs; deal must DSCR.
Hard money
10% down · 12.0% · 12mo
- Down + closing
- —
- Monthly P&I
- —
- Monthly cashflow
- —
- DSCR
- —
- Eligible?
- —
Short-term bridge; refi at stabilization.
Rent comps 40 comps
| Address | Beds | Baths | Sqft | Rent | $/sqft | DOM | Units | Dist |
|---|---|---|---|---|---|---|---|---|
| 1511 Maple Ave Waco, TX | 3.0 | 2.0 | 1487 | $1,450 | $0.98 | 43d | 1 | 0.03mi |
| 1818 Windsor Ave Waco, TX | 4.0 | 2.0 | 1112 | $1,625 | $1.46 | 20d | 1 | 0.27mi |
| 1825 Cumberland Ave Waco, TX | 3.0 | 1.0 | 1400 | $1,325 | $0.95 | 13d | 1 | 0.28mi |
| 1815 Seneca Ave Waco, TX | 3.0 | 2.0 | 1471 | $1,650 | $1.12 | 20d | 1 | 0.33mi |
| 1920 Windsor Ave Waco, TX | 3.0 | 1.0 | 1216 | $1,200 | $0.99 | 43d | 1 | 0.36mi |
| 1821 Algonquin St Waco, TX | 2.0 | 1.0 | 930 | $1,150 | $1.24 | 43d | 1 | 0.37mi |
| 1600 N 11th St Unit A Waco, TX | 3.0 | 2.0 | 1217 | $1,750 | $1.44 | 43d | 1 | 0.38mi |
| 2000 Windsor Ave Waco, TX | 4.0 | 2.5 | 1450 | $1,800 | $1.24 | 43d | 1 | 0.38mi |
| 712 Proctor Ave Waco, TX | 4.0 | 2.0 | 1184 | $1,450 | $1.22 | 20d | 1 | 0.42mi |
| 1606 N 9th St Waco, TX | 4.0 | 2.0 | 1392 | $1,525 | $1.10 | 20d | 1 | 0.45mi |
| 1920 Lyle Ave Waco, TX | 2.0 | 1.0 | 1519 | $1,200 | $0.79 | 20d | 1 | 0.59mi |
| 1920 Lyle Ave Waco, TX | 2.0 | 1.0 | 1519 | $1,200 | $0.79 | 43d | 1 | 0.59mi |
| 1110 N 11th St Waco, TX | 3.0 | 2.0 | 1172 | $1,495 | $1.28 | 20d | 1 | 0.64mi |
| 1104 N 11th St Waco, TX | 3.0 | 2.0 | 1231 | $1,650 | $1.34 | 20d | 1 | 0.65mi |
| 2001 Bosque Blvd Waco, TX | 3.0 | 1.0 | 1628 | $1,100 | $0.68 | 43d | 1 | 0.69mi |
| 1621 Alexander Ave Unit A Waco, TX | 3.0 | 2.0 | 1400 | $1,695 | $1.21 | 20d | 1 | 0.69mi |
| 2121 Lyle Ave Waco, TX | 2.0 | 1.0 | 1080 | $1,000 | $0.93 | 13d | 1 | 0.72mi |
| 1400 N 23rd St Waco, TX | 4.0 | 2.0 | 1650 | $1,575 | $0.95 | 13d | 1 | 0.73mi |
| 1000 N 19th St Waco, TX | 3.0 | 1.5 | 1800 | $2,050 | $1.14 | 20d | 1 | 0.73mi |
| 804 N 11th St Waco, TX | 1.0–2.0 | 1.0 | 838 | $1,200 | $1.43 | 20d | 1 | 0.80mi |
| 2511 Parrott Ave Waco, TX | 3.0 | 2.0 | 1463 | $1,695 | $1.16 | 43d | 1 | 0.80mi |
| 716 N 13th St Waco, TX | 4.0 | 2.0 | 1349 | $1,675 | $1.24 | 20d | 1 | 0.84mi |
| 2505 Proctor Ave Waco, TX | 3.0 | 2.0 | 1588 | $1,550 | $0.98 | 20d | 1 | 0.85mi |
| 2621 Windsor Ave Waco, TX | 2.0 | 1.0 | 1108 | $1,175 | $1.06 | 20d | 1 | 0.86mi |
| 2504 Lyle Ave Waco, TX | 3.0 | 2.0 | 1028 | $1,475 | $1.43 | 20d | 1 | 0.91mi |
| 2714 Windsor Ave Waco, TX | 2.0 | 1.0 | 979 | $1,300 | $1.33 | 43d | 1 | 0.93mi |
| 2601 Herring Ave Unit 1 Waco, TX | 3.0 | 1.0 | 989 | $1,295 | $1.31 | 43d | 1 | 0.94mi |
| 1901 N 28th St Waco, TX | 3.0 | 2.0 | 1794 | $1,950 | $1.09 | 20d | 1 | 0.97mi |
| 2704 Herring Ave Waco, TX | 2.0 | 2.0 | 1286 | $1,750 | $1.36 | 20d | 1 | 0.99mi |
| 2401 McKenzie Ave Waco, TX | 3.0 | 1.5 | 1288 | $1,300 | $1.01 | 20d | 1 | 1.02mi |
| 2116 Morrow Ave Waco, TX | 4.0 | 2.0 | 1703 | $1,650 | $0.97 | 20d | 1 | 1.02mi |
| 2712 Lyle Ave Waco, TX | 3.0 | 1.0 | 1100 | $1,500 | $1.36 | 43d | 1 | 1.04mi |
| 2712 Lyle Ave Waco, TX | 3.0 | 1.0 | 1100 | $1,500 | $1.36 | 20d | 1 | 1.04mi |
| 2400 Reuter Ave Waco, TX | 4.0 | 2.0 | 1426 | $1,650 | $1.16 | 20d | 1 | 1.05mi |
| 2705 Bosque Blvd Waco, TX | 3.0 | 2.0 | 1028 | $1,599 | $1.56 | 43d | 1 | 1.08mi |
| 2712 Mitchell Ave Waco, TX | 3.0 | 1.0 | 1120 | $1,300 | $1.16 | 20d | 1 | 1.08mi |
| 2600 McKenzie Ave Waco, TX | 3.0 | 1.0 | 1096 | $1,395 | $1.27 | 20d | 1 | 1.10mi |
| 2632 Colonial Ave Unit B Waco, TX | 2.0 | 1.0 | 896 | $1,050 | $1.17 | 20d | 1 | 1.12mi |
| 2724 Bosque Blvd Waco, TX | 2.0 | 1.0 | 1120 | $1,100 | $0.98 | 20d | 1 | 1.14mi |
| 3007 Parrott Ave Unit 1 Waco, TX | 3.0 | 2.0 | 1458 | $1,650 | $1.13 | 20d | 1 | 1.14mi |
Listing history 10 events
-
2026-06-05statusdays on market $79,900 Pending 19 DOM
-
2026-06-03days on market $79,900 Active 18 DOM
-
2026-06-02days on market $79,900 Active 17 DOM
-
2026-06-01days on market $79,900 Active 16 DOM
-
2026-05-31days on market $79,900 Active 15 DOM
-
2026-05-30days on market $79,900 Active 14 DOM
-
2026-05-13$79,900 Active
-
2021-07-06soldstatus 108-char remark
Show marketing remark (108 chars)
3 Bedroom 2 Bath home in beautiful Waco TX! With almost 1500sf this is a great starter home and fixer upper.
-
2020-08-20$55,000 108-char remark
Show marketing remark (108 chars)
3 Bedroom 2 Bath home in beautiful Waco TX! With almost 1500sf this is a great starter home and fixer upper.
-
1991-11-01soldstatus
ⓘ Source: listings_history table (triggers on properties + properties_extension) + one-shot
backfill from property_details.listing_events for pre-trigger history.
Climate risk First Street
- Flood 1/10 Low FEMA zone X (unshaded) · 0% chance over 30 yrs
- Wildfire 3/10 Moderate
- Heat 7/10 Severe 7 d/yr ≥109°F today · 24 d/yr by 30 yrs out
- Wind 6/10 Major 60% chance of damaging wind over 30 yrs
- Air quality 2/10 Low 0 unhealthy d/yr today · 1 by 30 yrs out
Nearby sold comps map
Loading sold comps map…
Walkable amenities ~0.75 mi
Loading nearby amenities…
Taxation est. · year 1
- Rental income
- $18,590
- − Mortgage interest
- −$4,476
- − Property taxes
- −$1,198
- − Insurance
- −$400
- − Repairs & maintenance
- −$1,487
- − Management
- −$1,487
- − Depreciation
- −$2,324
- Taxable income
- $7,217
- Est. tax owed @ 24.0%
- −$1,732
- After-tax cash flow
- $6,328/yr
For passive investors: Depreciation is non-cash, so a rental often shows a tax loss while cash-flowing — sheltering income. Rental losses are passive: they offset passive income freely, and up to $25,000/yr can offset ordinary (W-2) income if you actively participate and your MAGI is under $100k (phasing out to $0 by $150k); unused losses carry forward. On sale, claimed depreciation is recaptured at up to 25%, and gains may owe capital-gains tax (a 1031 exchange can defer both). Figures are a year-1 estimate at your 24.0% rate — not tax advice; consult a CPA.
Schools (NCES district)
- District
- Waco ISD
- NCES district ID
- 4844280
- Math proficiency
- 20% ▼ -14.00%
- Reading proficiency
- 24% ▼ -6.00%
- Median HH income
- $29,208
- Composite
- 17.57/100
- National rank
- #9043
- State rank
- #773 of 826 in TX
Livability — Waco
- Score
- 74/100
- State rank
- #166
- US rank
- #4378
Category grades
Schools grade is shown separately in the Schools card above.
Census & demographics
- Census place
- Waco, TX
- County
- McLennan County · 213,088 people
- City population
- 125,319
- Metro
- Waco, TX
- Population (ZIP)
- 15,879
- Household income
- $40,443
- Rent vs Own
- Severe rent burden
- 704.0
Population outlook (McLennan County) Hauer SSP2
- Today (2025)
- 264,191 people
- By 2030
- 273,578 · +3.6%
- By 2040
- 291,506 · +10.3%
- By 2050
- 308,044 · +16.6%
- By 2075
- 349,648 · +32.3%
- By 2100
- 364,779 · +38.1%
Race, ethnicity, and origin ACS 2023
- Neighborhood character
- Diverse neighborhood (Simpson 0.64)
- Race & ethnicity
- Hispanic / Latino 47% Black 32% Two or more races 26% White 18%
- Hispanic origin (detail)
- Mexican 43%
- Common ancestry
- Romanian 1% Lithuanian 1% Italian 1%
- Foreign-born
- 15% · Canada
- Languages at home
- 65% English-only · Spanish 34% Tagalog/Filipino 1%
Political lean MEDSL · McLennan
- 2024 margin
- Solid R (+30.9) · D 34.0% · R 64.9% · Other 1.0%
- 2008→2024 swing
- -7.0pp toward R · 2008: -23.9pp · 2024: -30.9pp
- All cycles
- 2024: R+30.9 2020: R+23.4 2016: R+27.1 2012: R+29.8 2008: R+23.9
Not yet ingested
- Civics
- —
Market trends
- HPI YoY
- ▼ -134.95%
- Current HPI
- 239.639
- Rent YoY
- ▲ 1.14%
- Metro
- Waco, TX
- State GDP YoY
- ▲ 3.95%
- F500 in state
- 110
Industry mix (Fortune 500 HQ in TX)
| Industry | F500 HQs | Revenue |
|---|---|---|
| Energy | 16 | $1,198B |
|
||
| Technology | 5 | $198B |
|
||
| Engineering / Construction | 4 | $72B |
|
||
| Energy Services | 3 | $60B |
|
||
| Utilities | 3 | $41B |
|
||
| Healthcare | 2 | $330B |
|
||
Price history
+45.3% since first listed4 events — show timeline
- 2026-05-13 Listed $79,900 NTREIS
- 2021-07-06 Sold (MLS) — NTREIS
- 2020-08-20 Listed $55,000 NTREIS
- 1991-11-01 Sold (Public Records) — Public Records
Property tax history
+10.6%/yrLatest (2025): $4,160 · -13.0% YoY. Source: county tax records.
Cash-flow waterfall
monthlySold comps — $/sqft
last 12 mo · ≤1 miLoading sold comps…