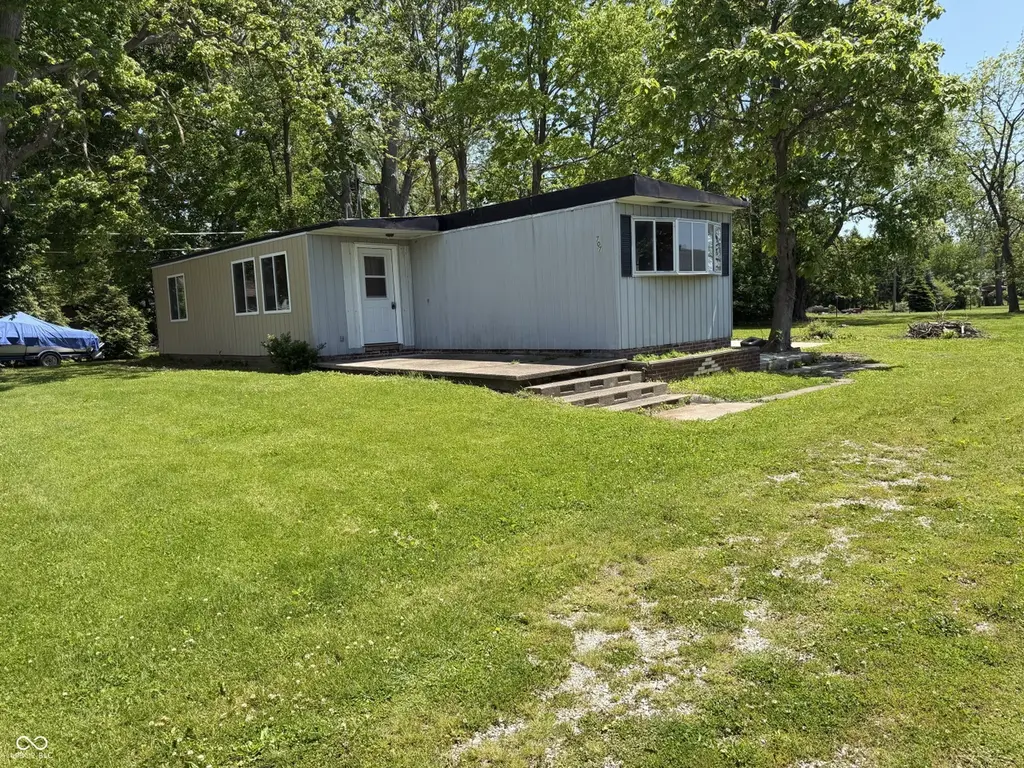
707 Hawkes St · Rockville, IN
Flood risk 1/10 · Minimal
- FEMA flood zone
- X (unshaded)
- Chance of flooding over 30 yrs
- 0.0%
- Est. flood insurance / yr
- $473 – $860
Fire risk 1/10 · Minimal
- Est. fire insurance / yr
- $717 – $1,331
Heat risk 4/10 · Minor
- Hot days now (above 104°F)
- 7 days/yr
- Hot days in 30 yrs
- 18 days/yr
Wind risk 2/10 · Minimal
- Chance of severe wind over 30 yrs
- 0.0%
Air-quality risk 2/10 · Minimal
- Unhealthy air days now
- 1 days/yr
- Unhealthy air days in 30 yrs
- 2 days/yr
Risk factors via First Street. Map © Google.
Why this score? — see what drove the B- grade
The composite is a weighted blend of 9 inputs, each scored 0–100. Each bar is that input's sub-score; the figure is the points it added to the 100-point composite (weight × sub-score).
- Cash flow +30.0/30.0
- 1% rule +10.0/10.0
- DSCR +10.0/10.0
- ARV discount +7.5/15.0
- Livability +3.2/5.0
- Schools +2.9/10.0
- Rent growth +2.5/5.0
- Condition / age +2.5/5.0
- Appreciation +0.0/10.0
$54,900
🖨 Deal sheet (PDF) 📄 Offer letter ✓ Due diligence
Listing remarks
Looking for your next investment or renovation opportunity? Whether your vision is restoring a fixer-upper or starting fresh on a spacious 14,000+sq. ft. in-town lot, this property is full of potential. Featuring updated 200-amp electrical service, some newer windows, partial subfloor improvements, and a solid 30x30 concrete slab ideal for a future garage, workshop, or additional structure, the possibilities are wide open. Conveniently located with city utilities and easy access to nearby amenities, this property is ready for your vision to come to life.
Key facts
- Concrete slab
- Newer windows
- 0.33 acre lot
Tags
Property features AI
Finance
- Other: Lot size about one-third acre (0.33 acres); Lot features indicate access
- HOA & community: Not a low-maintenance lifestyle community
Exterior
- Parking: Detached parking (no garage spaces listed)
- Utilities: Public water; Municipal sewer connected; 200+ amp electrical service; No solid waste service listed
- Home design: Manufactured home; One story; Property condition: Fixer / Under construction
- Construction: Aluminum and wood siding; Crawl space foundation
- Exterior features: Front porch
Interior
- Kitchen: No specific kitchen appliances listed
- Bedrooms: Two bedrooms on the main level (see remarks for primary bedroom details)
- Bathrooms: One full bathroom (main level) with tub and shower
- Heating & cooling: No central heating listed; No central cooling listed
- Interior features: No built-in appliances listed; Primary bathroom includes a tub with shower
- Laundry & utility: No fuel source listed
Neighborhood map
What this means for you Summary
Snapshot
- This is a 2-bed/1.0-bath manufactured listed at $55k.
Deal economics
- At list price, monthly cash flow is $830 ($10k/yr) — positive.
- The deal already cash-flows at list — no discount required.
- Meets the 1% rule at list price ($1k rent vs $55k).
- Recommended offer: $53k (3.0% below list) — sets the bar for market timing.
Location & tenants
- Location reads 64/100 on livability (#372 in IN) — a middle-class / working-renter tenant base. Strengths: crime A+, cost of living A+, housing A+; Watch: employment D+, amenities F, commute F.
- North Central Parke Comm School Corporation (town): math 30% / reading 39% proficiency, ranked #198 of 301 in IN (top 66%) — families likely to look elsewhere, expect single-tenant / working-renter base with shorter leases.
- Zoned schools: Rockville Elementary School (math 42% / reading 32%, grade F, #550 of 994 statewide, top 57%, 341 students, 64% FRL); Parke Heritage Middle School (math 16% / reading 33%, grade F, #251 of 330 statewide, top 77%, 263 students, 61% FRL); Parke Heritage High School (math 12% / reading 57%, grade F, #270 of 369 statewide, top 77%, 341 students, 57% FRL) — zoned schools average 61% FRL vs 45% district-wide (16 pts higher); higher-poverty schools than district average — tighter screening recommended.
- Market conditions: 84 active listings in the ZIP; 61 units permitted in Parke County in 2024 (0 in 5+ unit buildings).
Forward outlook
- Local home prices are declining (-3.0%/yr); year-one equity from $380 of loan paydown is wiped out by about $2k of value loss. Plan a longer hold.
- Parke County population projected at -10% by 2050 — secular population decline; favor cash flow + early exit over multi-decade hold.
- At projected returns (-3.0% appreciation + 3.0% rent growth), your $15k cash investment doubles in ~2 years — after that, you're playing with house money.
Negotiation context
- It's been on market 37 days — a 3% lower offer ($53k) is reasonable based on typical stale-listing flexibility.
Questions for the listing agent
- It's been on market 37 days. Have you received any prior offers? Is the seller open to a 3% concession, seller financing, or rate buy-down credit?
- Built in 1971 — when were the roof, HVAC, electrical panel, plumbing, and water heater last replaced?
- Is there a deadline driving the sale (1031 exchange, divorce, estate, relocation)? That informs how much negotiation room exists.
- What's the average days-on-market for RENTAL listings here right now (not sales)? A rising rental-DOM trend means longer vacancies and softer asking-rent achievability than the comps imply.
- What's the recent tenant-quality profile in this submarket — average credit score on applications, eviction rate, late-payment / NSF rate, and stable-employment percentage? A property-management company in the area should have these aggregated.
- How much new for-sale + rental construction is in the pipeline within 1–3 miles? Heavy new supply typically softens prices + rents 12–24 months out; constrained supply supports both.
Investment metrics
- 1% rule
- 2.65% ✓
- Cap rate
- 24.44%
- Cash-on-cash
- 64.80%
- DSCR
- 3.88
- GRM
- 3.1
CMA / ARV
No comps found within radius.
Projected returns pro-forma
-3.0% appreciation · 3.0% rent growth · sell at horizon
- IRR
- 63.9%
- Equity multiple
- 3.86×
- Total profit
- $43,958
- Equity at exit
- $8,186
- IRR
- 68.3%
- Equity multiple
- 7.91×
- Total profit
- $106,297
- Equity at exit
- $4,747
Cash invested: $15,372 (down + closing). Projections, not guarantees.
Landlord ↔ Tenant lean methodology
- Overall (STATE)
- 90 Strongly Landlord-Friendly
- State Indiana
- 90 Strongly Landlord-Friendly · R+11
- County
- — inherits STATE
- City
- — inherits STATE
ZIP-level market 47872
- Home prices YoY
- -7.8%
- Active inventory
- 84
- Price-to-rent
- 3.1×
Monthly cashflow live
- Estimated rent
- $1,457 medium interval (Pro) →
- Mortgage (P&I)
- −$288
- Tax from tax record
- −$10 /mo · $118/yr
- Insurance
- −$23
- HOA
- −$0
- Vacancy / Maint / Mgmt
- −$306
- Net cashflow
- $830
Break-even live
Sensitivity live
| Price | -10% $861 | -5% $846 | +0% $830 | +5% $815 | +10% $733 |
|---|---|---|---|---|---|
| Rent | -10% $715 | -5% $773 | +0% $830 | +5% $888 | +10% $945 |
| Rate | -1.0pp $858 | -0.5pp $844 | base $830 | +0.5pp $816 | +1.0pp $801 |
UW: 25.0% down · 7.5% · 30yr · 1.5% tax · 5.0% vac · 8.0% maint · 8.0% mgmt
Financing live
Cash to close
- Down payment
- $13,725
- Closing costs
- $1,647
- Reserves months
- —
- Total cash needed
- —
Loan-product check · same deal, 3 products live
Conventional
25% down · 7.5% · 30yr
- Down + closing
- —
- Monthly P&I
- —
- Monthly cashflow
- —
- DSCR
- —
- Eligible?
- —
Personal DTI + credit; lowest rate.
DSCR
20% down · 8.5% · 30yr
- Down + closing
- —
- Monthly P&I
- —
- Monthly cashflow
- —
- DSCR
- —
- Eligible?
- —
No personal income docs; deal must DSCR.
Hard money
10% down · 12.0% · 12mo
- Down + closing
- —
- Monthly P&I
- —
- Monthly cashflow
- —
- DSCR
- —
- Eligible?
- —
Short-term bridge; refi at stabilization.
Listing history 18 events
-
2026-06-19days on market $54,900 Active 37 DOM
-
2026-06-18days on market $54,900 Active 36 DOM
-
2026-06-17price $54,900 Active 35 DOM
-
2026-06-17days on market $59,900 Active 35 DOM
-
2026-06-16days on market $59,900 Active 34 DOM
-
2026-06-15days on market $59,900 Active 33 DOM
-
2026-06-14days on market $59,900 Active 31 DOM
-
2026-06-12days on market $59,900 Active 30 DOM
-
2026-06-09days on market $59,900 Active 27 DOM
-
2026-06-08days on market $59,900 Active 26 DOM
-
2026-06-07days on market $59,900 Active 25 DOM
-
2026-06-05days on market $59,900 Active 22 DOM
-
2026-06-03days on market $59,900 Active 21 DOM
-
2026-06-02days on market $59,900 Active 20 DOM
-
2026-06-01days on market $59,900 Active 19 DOM
-
2026-05-31days on market $59,900 Active 18 DOM
-
2026-05-30days on market $59,900 Active 17 DOM
-
2026-05-13$59,900 Active
ⓘ Source: listings_history table (triggers on properties + properties_extension) + one-shot
backfill from property_details.listing_events for pre-trigger history.
Tax reassessment forecast IN · Partial reset (capped growth)
- Current annual tax
- $118 · $10/mo
- Projected year-2 tax
- $293 · $24/mo
- Expected delta
- +$174/yr (+$15/mo · 146.9%)
ⓘ Screening estimate from a state-policy table — verify with the county assessor before closing.
Climate risk First Street
- Flood 1/10 Low FEMA zone X (unshaded) · 0% chance over 30 yrs
- Wildfire 1/10 Low
- Heat 4/10 Moderate 7 d/yr ≥104°F today · 18 d/yr by 30 yrs out
- Wind 2/10 Low 0% chance of damaging wind over 30 yrs
- Air quality 2/10 Low 1 unhealthy d/yr today · 2 by 30 yrs out
Nearby sold comps map
Loading sold comps map…
Walkable amenities ~0.75 mi
Loading nearby amenities…
Taxation est. · year 1
- Rental income
- $17,479
- − Mortgage interest
- −$3,075
- − Property taxes
- −$118
- − Insurance
- −$274
- − Repairs & maintenance
- −$1,398
- − Management
- −$1,398
- − Depreciation
- −$1,597
- Taxable income
- $9,617
- Est. tax owed @ 24.0%
- −$2,308
- After-tax cash flow
- $7,653/yr
For passive investors: Depreciation is non-cash, so a rental often shows a tax loss while cash-flowing — sheltering income. Rental losses are passive: they offset passive income freely, and up to $25,000/yr can offset ordinary (W-2) income if you actively participate and your MAGI is under $100k (phasing out to $0 by $150k); unused losses carry forward. On sale, claimed depreciation is recaptured at up to 25%, and gains may owe capital-gains tax (a 1031 exchange can defer both). Figures are a year-1 estimate at your 24.0% rate — not tax advice; consult a CPA.
Schools (NCES district)
- District
- North Central Parke Comm School Corporation
- NCES district ID
- 1800118
- Math proficiency
- 30% ▼ -8.00%
- Reading proficiency
- 39% ▼ -4.00%
- Median HH income
- $43,739
- Composite
- 29.31/100
- National rank
- #6553
- State rank
- #198 of 301 in IN
Livability — Rockville
- Score
- 64/100
- State rank
- #372
- US rank
- #13880
Category grades
Schools grade is shown separately in the Schools card above.
Census & demographics
- Census place
- Rockville, IN
- Population (ZIP)
- 8,641
Population outlook (Parke County) Hauer SSP2
- Today (2025)
- 15,937 people
- By 2030
- 15,467 · -2.9%
- By 2040
- 14,793 · -7.2%
- By 2050
- 14,318 · -10.2%
- By 2075
- 13,484 · -15.4%
- By 2100
- 12,236 · -23.2%
Race, ethnicity, and origin ACS 2023
- Neighborhood character
- Predominantly White (93%)
- Race & ethnicity
- White 93% Black 3% Two or more races 3% Hispanic / Latino 2%
- Common ancestry
- Iranian 3% Lithuanian 2% Slovak 2%
- Foreign-born
- 0%
- Languages at home
- 92% English-only · German/W. Germanic 5% Spanish 2% French/Haitian/Cajun 1%
Political lean MEDSL · Parke
- 2024 margin
- Solid R (+56.9) · D 20.6% · R 77.5% · Other 1.9%
- 2008→2024 swing
- -42.8pp toward R · 2008: -14.1pp · 2024: -56.9pp
- All cycles
- 2024: R+56.9 2020: R+55.5 2016: R+52.0 2012: R+32.6 2008: R+14.1
Not yet ingested
- Civics
- —
Market trends
- HPI YoY
- ▼ -19.85%
- Current HPI
- 234.3039
- Rent YoY
- —
- Metro
- —
- State GDP YoY
- ▲ 2.90%
- F500 in state
- 18
Industry mix (Fortune 500 HQ in IN)
| Industry | F500 HQs | Revenue |
|---|---|---|
| Industrial Machinery | 2 | $37B |
|
||
| Healthcare | 1 | $177B |
|
||
| Pharmaceuticals | 1 | $45B |
|
||
| Metals / Steel | 1 | $18B |
|
||
| Agriculture | 1 | $17B |
|
||
| Packaging | 1 | $12B |
|
||
Price history
1 event — show timeline
- 2026-05-13 Listed $59,900 MIBOR as Distributed by MLS Grid
Property tax history
-2.0%/yrLatest (2024): $118 · +10.8% YoY. Source: county tax records.
Cash-flow waterfall
monthlySold comps — $/sqft
last 12 mo · ≤1 miLoading sold comps…