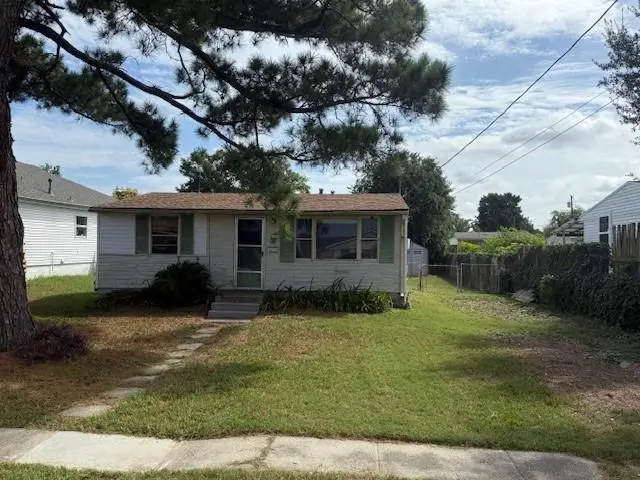
3210 Arkansas Ave · Kenner, LA
Flood risk 9/10 · Severe
- FEMA flood zone
- AE
- Chance of flooding over 30 yrs
- 0.77%
- Est. flood insurance / yr
- $1,737 – $8,500
Fire risk 1/10 · Minimal
- Est. fire insurance / yr
- $1,269 – $2,357
Heat risk 10/10 · Severe
- Hot days now (above 108°F)
- 7 days/yr
- Hot days in 30 yrs
- 20 days/yr
Wind risk 10/10 · Severe
- Chance of severe wind over 30 yrs
- 99.0%
Air-quality risk 3/10 · Minor
- Unhealthy air days now
- 2 days/yr
- Unhealthy air days in 30 yrs
- 3 days/yr
Risk factors via First Street. Map © Google.
Why this score? — see what drove the B grade
The composite is a weighted blend of 9 inputs, each scored 0–100. Each bar is that input's sub-score; the figure is the points it added to the 100-point composite (weight × sub-score).
- Cash flow +29.8/30.0
- ARV discount +15.0/15.0
- DSCR +10.0/10.0
- 1% rule +7.5/10.0
- Livability +3.9/5.0
- Schools +2.5/10.0
- Condition / age +2.5/5.0
- Rent growth +1.5/5.0
- Appreciation +0.0/10.0
$115,000
🖨 Deal sheet 📄 Offer letter ✓ Due diligence
Listing remarks MLS
Great Investment Opportunity! This home offers 2 beds, 1 bath. The roof is only 3 years old, Electrical panel upgraded. Plenty of potential.
Key facts
- Parking
- Built 1958
- Listed 85 days
Tags
Neighborhood map
What this means for you Summary
Snapshot
- This is a 2-bed/1.0-bath single-family listed at $115k.
Deal economics
- At list price, monthly cash flow is $-4 ($-46/yr) — negative.
- To cash-flow at today's rent, offer at most $114k (0.6% below list).
- Meets the 1% rule at list price ($1k rent vs $115k).
- Recommended offer: $108k (6.0% below list) — sets the bar for market timing.
- Cap rate 10.7% vs local median 5.3% in Kenner — top-decile yield for the area; either an underpriced asset or a hidden risk that comps aren't pricing in. Stress-test before assuming the spread holds.
Location & tenants
- Location reads 78/100 on livability (#6 in LA, #2,414 nationally) — a middle-class / working-renter tenant base. Strengths: cost of living A+, housing A+, health & safety A+; Watch: amenities C-, employment C-, crime D.
- Jefferson Parish (suburban): math 24% / reading 34% proficiency, ranked #44 of 98 in LA (top 45%) — low school quality limits family demand, transient renter base, plan for 1-2y turnover; 70% free/reduced lunch — lower-income household profile, screen leases tightly.
- Market conditions: Rents falling (-4.2%/yr); 292 active listings in the ZIP; 28 comparable units currently listed for rent nearby; rentals at typical pace (median 24d on market — plan ~3-4 weeks tenant-placement turnaround); 46% of comp listings sitting > 30 days — soft ceiling on asking rent; 518 units permitted in Jefferson Parish in 2024 (43 in 5+ unit buildings).
Forward outlook
- Local home prices are declining (-3.0%/yr); year-one equity from $795 of loan paydown is wiped out by about $3k of value loss. Plan a longer hold.
Negotiation context
- It's been on market 85 days — a 6% lower offer ($108k) is reasonable based on typical stale-listing flexibility.
- 3 sale attempts with the ask held roughly flat each time — persistent listings suggest the price (not the market) is what's stuck; bring a comps-based counter.
Risks & watch-outs
- Watch-outs: flood insurance adds $427/mo; built in 1958 — expect roof / HVAC / electrical / plumbing capex.
- Climate carrying-cost: in FEMA flood zone AE (mandatory federal flood insurance); severe wind risk, 99% chance of damaging wind over 30y; extreme-heat days projected 7→20/yr by 2055 (HVAC capex compounding) — expect insurance premiums to compound above CPI over the hold.
Questions for the listing agent
- What do current leases actually rent for vs. the listed asking? Can we see a recent rent roll and the last 12 months of T-12 income?
- It's been on market 85 days. Have you received any prior offers? Is the seller open to a 6% concession, seller financing, or rate buy-down credit?
- Built in 1958 — when were the roof, HVAC, electrical panel, plumbing, and water heater last replaced?
- What's the actual annual flood-insurance premium (NFIP or private), and is the property in a SFHA with mandatory coverage?
- Why hasn't it sold? Are there any deal-killer items the seller is aware of (foundation, flood, title, zoning, code violations)?
- Is there a deadline driving the sale (1031 exchange, divorce, estate, relocation)? That informs how much negotiation room exists.
- Crime grade is D in this area — have there been break-ins, vandalism, or insurance claims at this property in the last 3 years? What carrier currently insures it and at what premium?
- What's the average days-on-market for RENTAL listings here right now (not sales)? A rising rental-DOM trend means longer vacancies and softer asking-rent achievability than the comps imply.
- What's the recent tenant-quality profile in this submarket — average credit score on applications, eviction rate, late-payment / NSF rate, and stable-employment percentage? A property-management company in the area should have these aggregated.
- How much new for-sale + rental construction is in the pipeline within 1–3 miles? Heavy new supply typically softens prices + rents 12–24 months out; constrained supply supports both.
Investment metrics
- 1% rule
- 1.25% ✓
- Cap rate
- 10.70%
- Cash-on-cash
- 15.75%
- DSCR
- 1.70
- GRM
- 6.7
CMA / ARV
- ARV (median comp)
- $149,556
- List price
- $115,000
- Delta
- -23.11%
- Verdict
- UNDERPRICED
- Comps
- 16 within 1.0 mi
Show comp detail 4 sales within ~0.75 mi
| Address | Dist | Beds/Ba | Sqft | Sold | Price | $/sf | Match |
|---|---|---|---|---|---|---|---|
| 3209 California Ave | 0.03mi | 2/1.0 | 715 (-5%) | 10mo | $160,000 | $224 | 82 |
| 3321 Connecticut Ave | 0.22mi | 2/1.0 | 720 (-4%) | 3mo | $75,000 | $104 | 80 |
| 1609 W Esplanade Ave | 0.32mi | 2/1.0 | 716 (-4%) | 15mo | $150,000 | $209 | 65 |
| 1615 W 31st St | 0.27mi | 3/1.0 (+1) | 823 (+10%) | 20mo | $135,000 | $164 | 50 |
Match score weights: distance 35% · size 25% · config 20% · recency 20%. Top-matched comps best support the ARV.
Projected returns pro-forma
-3.0% appreciation · 0.0% rent growth · sell at horizon
- IRR
- -21.3%
- Equity multiple
- 0.29×
- Total profit
- $-22,854
- Equity at exit
- $17,147
- IRR
- -30.7%
- Equity multiple
- -0.10×
- Total profit
- $-35,527
- Equity at exit
- $9,943
Cash invested: $32,200 (down + closing). Projections, not guarantees.
Landlord ↔ Tenant lean methodology
- Overall (STATE)
- 90 Strongly Landlord-Friendly
- State Louisiana
- 90 Strongly Landlord-Friendly · R+12
- County
- — inherits STATE
- City
- — inherits STATE
ZIP-level market 70065
- Rents YoY
- -4.2%
- Active inventory
- 292
- Price-to-rent
- 6.7×
Monthly cashflow live
- Estimated rent
- $1,435 high interval (Pro) →
- Mortgage (P&I)
- −$603
- Tax from tax record
- −$60 /mo · $721/yr
- Insurance
- −$48
- Flood insurance flood zone
- −$427 /mo · $5,118/yr
- HOA
- −$0
- Vacancy / Maint / Mgmt
- −$301
- Net cashflow
- $-4
Break-even live
UW: 25.0% down · 7.5% · 30yr · 1.5% tax · 5.0% vac · 8.0% maint · 8.0% mgmt
Financing live
Cash to close
- Down payment
- $28,750
- Closing costs
- $3,450
- Reserves months
- —
- Total cash needed
- —
Loan-product check · same deal, 3 products live
Conventional
25% down · 7.5% · 30yr
- Down + closing
- —
- Monthly P&I
- —
- Monthly cashflow
- —
- DSCR
- —
- Eligible?
- —
Personal DTI + credit; lowest rate.
DSCR
20% down · 8.5% · 30yr
- Down + closing
- —
- Monthly P&I
- —
- Monthly cashflow
- —
- DSCR
- —
- Eligible?
- —
No personal income docs; deal must DSCR.
Hard money
10% down · 12.0% · 12mo
- Down + closing
- —
- Monthly P&I
- —
- Monthly cashflow
- —
- DSCR
- —
- Eligible?
- —
Short-term bridge; refi at stabilization.
Rent comps 28 comps
| Address | Beds | Baths | Sqft | Rent | $/sqft | DOM | Units | Dist |
|---|---|---|---|---|---|---|---|---|
| 3304 Delaware Ave Unit B Kenner, LA | 2.0 | 1.5 | 1100 | $1,295 | $1.18 | 4d | 1 | 0.23mi |
| 3308 Delaware Ave Unit C Kenner, LA | 2.0 | 1.5 | 1125 | $1,400 | $1.24 | 43d | 1 | 0.24mi |
| 1400 W Esplanade Ave Kenner, LA | 2.0 | 1.0–2.5 | 801 | $1,370 | $1.71 | 43d | 1 | 0.57mi |
| 1201 W Esplanade Ave Kenner, LA | 1.0–2.0 | 1.0–2.0 | 746 | $1,110 | $1.49 | 43d | 1 | 0.60mi |
| 730 Village Rd Unit D Kenner, LA | 1.0 | 1.0 | 743 | $1,500 | $2.02 | 43d | 1 | 0.93mi |
| 2916 Maine Ave Unit A Kenner, LA | 2.0 | 1.5 | 975 | $1,200 | $1.23 | 23d | 1 | 1.02mi |
| 187 Avant Garde Cir #187 Kenner, LA | 2.0 | 1.5 | 1050 | $1,500 | $1.43 | 14d | 1 | 1.06mi |
| 3120 Phoenix St Unit D Kenner, LA | 2.0 | 1.5 | 1075 | $1,100 | $1.02 | 43d | 1 | 1.08mi |
| 1740 Vintage Dr Unit C Kenner, LA | 2.0 | 1.5 | 1019 | $1,150 | $1.13 | 43d | 1 | 1.15mi |
| 1740 Vintage Dr Unit A Kenner, LA | 2.0 | 1.5 | 1019 | $1,250 | $1.23 | 43d | 1 | 1.15mi |
| 4101 Delaware Ave #6 Kenner, LA | 2.0 | 1.5 | 1050 | $1,350 | $1.29 | 23d | 1 | 1.16mi |
| 4101 Delaware Ave Kenner, LA | 2.0 | 1.5 | 1100 | $1,499 | $1.36 | 43d | 1 | 1.16mi |
| 1617 Newport Pl #23 Kenner, LA | 2.0 | 1.5 | 1125 | $1,395 | $1.24 | 4d | 1 | 1.17mi |
| 1617 Newport Pl #23 Kenner, LA | 2.0 | 1.5 | 1125 | $1,400 | $1.24 | 43d | 1 | 1.17mi |
| 1616 Newport Pl Unit A Kenner, LA | 3.0 | 2.0 | 1100 | $1,500 | $1.36 | 43d | 1 | 1.20mi |
| 4144 Georgia Ave Unit D Kenner, LA | 2.0 | 2.0 | 1050 | $1,450 | $1.38 | 23d | 1 | 1.29mi |
| 2625 Panama St Kenner, LA | 2.0 | 1.0 | 930 | $1,300 | $1.40 | 2d | 1 | 1.30mi |
| 2150 42nd St Unit B113 Kenner, LA | 1.0 | 1.0 | 851 | $1,320 | $1.55 | 4d | 1 | 1.35mi |
| 2150 42nd St Unit A305 Kenner, LA | 1.0 | 1.0 | 899 | $1,330 | $1.48 | 43d | 1 | 1.35mi |
| 2150 42nd St Unit B316 Kenner, LA | 2.0 | 2.0 | 1100 | $1,410 | $1.28 | 4d | 1 | 1.35mi |
| 2150 42nd St Unit B310 Kenner, LA | 2.0 | 2.0 | 1100 | $1,495 | $1.36 | 14d | 1 | 1.35mi |
| 2150 42nd St Unit B211 Kenner, LA | 1.0 | 1.0 | 899 | $1,230 | $1.37 | 14d | 1 | 1.35mi |
| 2150 42nd St Unit A301 Kenner, LA | 2.0 | 2.0 | 1100 | $1,395 | $1.27 | 4d | 1 | 1.35mi |
| 2150 42nd St Unit A204 Kenner, LA | 1.0 | 1.0 | 899 | $1,270 | $1.41 | 4d | 1 | 1.35mi |
| 309 Emerson Dr Unit C Kenner, LA | 3.0 | 1.0 | 900 | $1,200 | $1.33 | 4d | 1 | 1.45mi |
| 4204 Chateau Blvd Unit A Kenner, LA | 2.0 | 1.5 | 1100 | $1,300 | $1.18 | 43d | 1 | 1.46mi |
| 300 Duke Dr Unit 4 Kenner, LA | 2.0 | 1.0 | 838 | $1,200 | $1.43 | 43d | 1 | 1.49mi |
| 300 Clemson Dr Kenner, LA | 2.0 | 1.5 | 1025 | $1,500 | $1.46 | 14d | 1 | 1.49mi |
Listing history 18 events
-
2026-06-18days on market $115,000 Active 85 DOM
-
2026-06-17days on market $115,000 Active 84 DOM
-
2026-06-16days on market $115,000 Active 83 DOM
-
2026-06-15days on market $115,000 Active 82 DOM
-
2026-06-13days on market $115,000 Active 80 DOM
-
2026-06-10days on market $115,000 Active 77 DOM
-
2026-06-09days on market $115,000 Active 76 DOM
-
2026-06-08days on market $115,000 Active 75 DOM
-
2026-06-07days on market $115,000 Active 74 DOM
-
2026-06-03days on market $115,000 Active 70 DOM
-
2026-06-02days on market $115,000 Active 69 DOM
-
2026-06-01days on market $115,000 Active 68 DOM
-
2026-05-31days on market $115,000 Active 67 DOM
-
2026-03-25$115,000 Active 140-char remark
Show marketing remark (140 chars)
Great Investment Opportunity! This home offers 2 beds, 1 bath. The roof is only 3 years old, Electrical panel upgraded. Plenty of potential.
-
2026-03-25$115,000 Active 140-char remark
Show marketing remark (140 chars)
Great Investment Opportunity! This home offers 2 beds, 1 bath. The roof is only 3 years old, Electrical panel upgraded. Plenty of potential.
-
2025-12-12price $119,000
-
2025-12-12price $119,000
-
2025-10-06$125,000 Active
ⓘ Source: listings_history table (triggers on properties + properties_extension) + one-shot
backfill from property_details.listing_events for pre-trigger history.
Tax reassessment forecast LA · Resets to sale price
- Current annual tax
- $721 · $60/mo
- Projected year-2 tax
- $721 · $60/mo
- Expected delta
- $0/yr ($0/mo · 0.0%)
ⓘ Screening estimate from a state-policy table — verify with the county assessor before closing.
Climate risk First Street
- Flood 9/10 Extreme FEMA zone AE · 77% chance over 30 yrs
- Wildfire 1/10 Low
- Heat 10/10 Extreme 7 d/yr ≥108°F today · 20 d/yr by 30 yrs out
- Wind 10/10 Extreme 99% chance of damaging wind over 30 yrs
- Air quality 3/10 Moderate 2 unhealthy d/yr today · 3 by 30 yrs out
Nearby sold comps map
Loading sold comps map…
Walkable amenities ~0.75 mi
Loading nearby amenities…
Taxation est. · year 1
- Rental income
- $17,222
- − Mortgage interest
- −$6,442
- − Property taxes
- −$721
- − Insurance
- −$5,694
- − Repairs & maintenance
- −$1,378
- − Management
- −$1,378
- − Depreciation
- −$3,345
- Taxable loss
- −$1,735
- Est. tax savings @ 24.0%
- +$417
- After-tax cash flow
- $370/yr
For passive investors: Depreciation is non-cash, so a rental often shows a tax loss while cash-flowing — sheltering income. Rental losses are passive: they offset passive income freely, and up to $25,000/yr can offset ordinary (W-2) income if you actively participate and your MAGI is under $100k (phasing out to $0 by $150k); unused losses carry forward. On sale, claimed depreciation is recaptured at up to 25%, and gains may owe capital-gains tax (a 1031 exchange can defer both). Figures are a year-1 estimate at your 24.0% rate — not tax advice; consult a CPA.
Schools (NCES district)
- District
- Jefferson Parish
- NCES district ID
- 2200840
- Math proficiency
- 24% ▼ -36.00%
- Reading proficiency
- 34% ▼ -30.00%
- Median HH income
- $48,421
- Composite
- 25.19/100
- National rank
- #7511
- State rank
- #44 of 98 in LA
Livability — Kenner
- Score
- 78/100
- State rank
- #6
- US rank
- #2414
Category grades
Schools grade is shown separately in the Schools card above.
Census & demographics
- Census place
- Kenner, LA
- County
- Jefferson Parish · 426,999 people
- City population
- 66,707
- Metro
- New Orleans-Metairie, LA
- Population (ZIP)
- 48,936
- Household income
- $67,285
- Rent vs Own
- Severe rent burden
- 1906.0
Population outlook (Jefferson County) Hauer SSP2
- Today (2025)
- 451,696 people
- By 2030
- 455,451 · +0.8%
- By 2040
- 458,308 · +1.5%
- By 2050
- 461,031 · +2.1%
- By 2075
- 476,351 · +5.5%
- By 2100
- 499,377 · +10.6%
Race, ethnicity, and origin ACS 2023
- Neighborhood character
- Diverse neighborhood (Simpson 0.69)
- Race & ethnicity
- White 47% Hispanic / Latino 27% Two or more races 15% Black 15% Asian 6%
- Hispanic origin (detail)
- Mexican 2% Puerto Rican 3% Cuban 2%
- Common ancestry
- Lithuanian 9% Slovak 1% Italian 1%
- Foreign-born
- 19% · Canada, China, Vietnam
- Languages at home
- 72% English-only · Spanish 21% Other Indo-European 3% Arabic 1%
Political lean MEDSL · Jefferson
- 2024 margin
- R (+12.9) · D 42.5% · R 55.5% · Other 2.1%
- 2008→2024 swing
- +13.6pp toward D · 2008: -26.6pp · 2024: -12.9pp
- All cycles
- 2024: R+12.9 2020: R+11.1 2016: R+14.8 2012: R+18.4 2008: R+26.6
Not yet ingested
- Civics
- —
Market trends
- HPI YoY
- ▼ -214.79%
- Current HPI
- 139.5115
- Rent YoY
- ▼ -4.19%
- Metro
- New Orleans-Metairie, LA
- State GDP YoY
- ▲ 3.29%
- F500 in state
- 10
Industry mix (Fortune 500 HQ in LA)
| Industry | F500 HQs | Revenue |
|---|---|---|
| Telecommunications | 2 | $23B |
|
||
| Utilities | 1 | $12B |
|
||
| Wholesale / Distribution | 1 | $5B |
|
||
| Advertising | 1 | $2B |
|
||
Price history
-8.0% since first listed5 events — show timeline
- 2026-03-25 Listed $115,000 GSREIN
- 2026-03-25 Listed $115,000 AcadianaMLS
- 2025-12-12 Price Changed $119,000 AcadianaMLS
- 2025-12-12 Price Changed $119,000 GSREIN
- 2025-10-06 Listed $125,000 AcadianaMLS
Property tax history
+2.0%/yrLatest (2025): $721 · -0.4% YoY. Source: county tax records.
Cash-flow waterfall
monthlySold comps — $/sqft
last 12 mo · ≤1 miLoading sold comps…