 Duplex
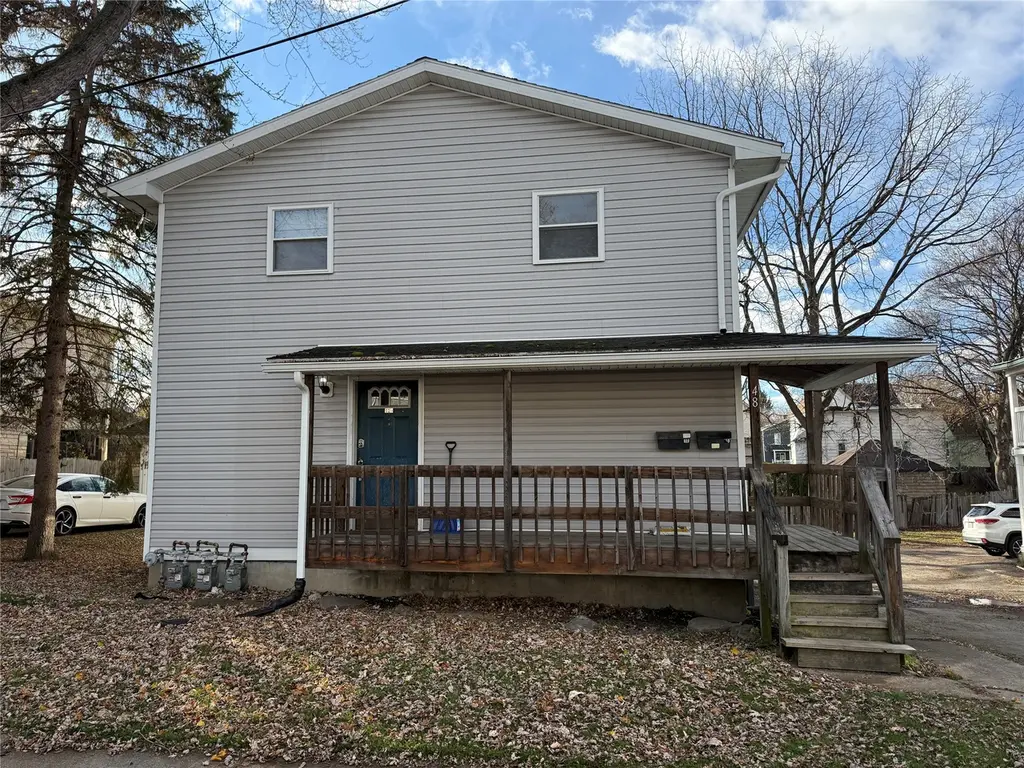
48 Roberts St · Johnson City, NY
Flood risk 1/10 · Minimal
- FEMA flood zone
- X
- Chance of flooding over 30 yrs
- 0.0%
- Est. flood insurance / yr
- $473 – $860
Fire risk 3/10 · Minor
- Est. fire insurance / yr
- $691 – $1,283
Heat risk 3/10 · Minor
- Hot days now (above 94°F)
- 7 days/yr
- Hot days in 30 yrs
- 16 days/yr
Wind risk 2/10 · Minimal
- Chance of severe wind over 30 yrs
- 2.0%
Air-quality risk 2/10 · Minimal
- Unhealthy air days now
- 0 days/yr
- Unhealthy air days in 30 yrs
- 1 days/yr
Risk factors via First Street. Map © Google.
Why this score? — see what drove the C+ grade
The composite is a weighted blend of 9 inputs, each scored 0–100. Each bar is that input's sub-score; the figure is the points it added to the 100-point composite (weight × sub-score).
- Cash flow +24.2/30.0
- Appreciation +10.0/10.0
- DSCR +7.8/10.0
- 1% rule +6.2/10.0
- Rent growth +4.9/5.0
- Livability +3.8/5.0
- Schools +3.3/10.0
- Condition / age +2.5/5.0
- ARV discount +0.0/15.0
$289,900
🖨 Deal sheet 📄 Offer letter ✓ Due diligence
Multi-family units
County records classify this as Multi-Family (2-4 Unit). Listing-text estimate: 2 units. confirmed
Listing remarks MLS
Exceptional opportunity to add a Turn-Key 2-family, 8-bedroom asset to your portfolio. Rebuilt from the ground up in 2003, it offers the advantages of newer construction—a rare find our multifamily space. Both units feature updated mechanicals, furnaces, central air, and newer kitchens and baths. Plenty of parking and close to bus lines. We have a limited inventory of newer multifamily properties like this. OWNER, REAL ESTATE LICENSEE
Key facts
- Close to bus lines
- Newer kitchens
- Updated mechanicals
Tags
Neighborhood map
What this means for you Summary
Snapshot
- This is a 2 × 4-bed/1.0-bath units multifamily listed at $290k.
Deal economics
- At list price, monthly cash flow is $578 ($7k/yr) — positive. Per door: $289/mo.
- The deal already cash-flows at list — no discount required.
- Meets the 1% rule at list price ($3k rent vs $290k).
- Recommended offer: $273k (6.0% below list) — sets the bar for market timing.
- Cap rate 8.7% vs local median 6.2% in Johnson City — top-decile yield for the area; either an underpriced asset or a hidden risk that comps aren't pricing in. Stress-test before assuming the spread holds.
Location & tenants
- Location reads 76/100 on livability (#238 in NY, #3,739 nationally) — a middle-class / working-renter tenant base. Strengths: cost of living A+, housing A+, health & safety A+; Watch: crime F, employment D-.
- Johnson City Central School District (suburban): math 38% / reading 41% proficiency, ranked #535 of 590 in NY (top 91%) — families likely to look elsewhere, expect single-tenant / working-renter base with shorter leases.
- Market conditions: Rents rising fast (+9.5%/yr); 99 active listings in the ZIP; 5 comparable units currently listed for rent nearby; rentals at typical pace (median 21d on market — plan ~3-4 weeks tenant-placement turnaround); 40% of comp listings sitting > 30 days — soft ceiling on asking rent; 340 units permitted in Broome County in 2024 (269 in 5+ unit buildings).
- At $3,241/mo this rent would consume 66% of the median local household income ($59k/yr) (locally 1233% of renters already pay >50% of income on rent) — very limited rent-growth headroom before tenants either downsize or default.
Forward outlook
- In year one you build about $31k of equity ($2k loan paydown + $29k appreciation (10.0% local appreciation)).
- Broome County population projected at -13% by 2050 — secular population decline; favor cash flow + early exit over multi-decade hold.
- At projected returns (10.0% appreciation + 8.0% rent growth), your $81k cash investment doubles in ~2 years — after that, you're playing with house money.
- By year 2, paydown + projected appreciation supports a ~$50k cash-out refi (75% LTV) — recoverable capital for the next deal without selling this one.
Negotiation context
- It's been on market 88 days — a 6% lower offer ($273k) is reasonable based on typical stale-listing flexibility.
- 4 sale attempts since 2y ago with the ask held roughly flat each time — persistent listings suggest the price (not the market) is what's stuck; bring a comps-based counter.
- Current owner paid $158k; list at $290k implies a 83% gain — meaningful room to come down on a strong offer.
Questions for the listing agent
- It's been on market 88 days. Have you received any prior offers? Is the seller open to a 6% concession, seller financing, or rate buy-down credit?
- Can we see the unit-by-unit rent roll, current vacancy, and any below-market leases? What's the average tenancy length?
- What capital expenditures (roof, boiler, parking lot, exteriors) have been made in the last 5 years, and what's planned in the next 2?
- Why hasn't it sold? Are there any deal-killer items the seller is aware of (foundation, flood, title, zoning, code violations)?
- Is there a deadline driving the sale (1031 exchange, divorce, estate, relocation)? That informs how much negotiation room exists.
- Crime grade is F in this area — have there been break-ins, vandalism, or insurance claims at this property in the last 3 years? What carrier currently insures it and at what premium?
- What's the average days-on-market for RENTAL listings here right now (not sales)? A rising rental-DOM trend means longer vacancies and softer asking-rent achievability than the comps imply.
- What's the recent tenant-quality profile in this submarket — average credit score on applications, eviction rate, late-payment / NSF rate, and stable-employment percentage? A property-management company in the area should have these aggregated.
- How much new apartment / multifamily construction is in the pipeline within 1–3 miles? Heavy new supply (>2% of stock underway) typically softens rents 12–24 months out; light construction supports rent growth.
Investment metrics
- 1% rule
- 1.12% ✓
- Cap rate
- 8.68%
- Cash-on-cash
- 8.54%
- DSCR
- 1.38
- GRM
- 7.5
CMA / ARV
- ARV (median comp)
- $228,802
- List price
- $289,900
- Delta
- 26.70%
- Verdict
- OVERPRICED
- Comps
- 20 within 1.0 mi
Show comp detail 12 sales within ~0.75 mi
| Address | Dist | Beds/Ba | Sqft | Sold | Price | $/sf | Match |
|---|---|---|---|---|---|---|---|
| 210 Baldwin St | 0.07mi | 4/2.0 | 2,142 (-9%) | 13mo | $130,000 | $61 | 71 |
| 203 Hudson St | 0.15mi | 3/3.0 (-1) | 2,206 (-6%) | 8mo | $54,000 | $24 | 67 |
| 234 Grand Ave | 0.15mi | 4/4.0 | 2,126 (-10%) | 3mo | $160,000 | $75 | 67 |
| 184 West End Ave | 0.52mi | 5/2.0 (+1) | 2,400 (+2%) | 7mo | $178,500 | $74 | 61 |
| 244 Corliss Avenue Ave | 0.41mi | 4/2.0 | 2,050 (-13%) | 2mo | $90,000 | $44 | 58 |
| 143 Harrison St | 0.19mi | 5/3.0 (+1) | 2,127 (-10%) | 11mo | $224,720 | $106 | 57 |
| 387 Riverside Dr | 0.50mi | 5/3.0 (+1) | 2,130 (-9%) | 1mo | $153,300 | $72 | 51 |
| 15 Orchard Ave | 0.40mi | 5/3.5 (+1) | 2,084 (-11%) | 2mo | $285,000 | $137 | 50 |
| 113 Ethel St | 0.42mi | 4/2.0 | 2,028 (-14%) | 12mo | $170,000 | $84 | 48 |
| 12 Narwood St | 0.66mi | 5/3.0 (+1) | 2,500 (+6%) | 11mo | $235,000 | $94 | 41 |
| 65 Lake Ave | 0.69mi | 5/3.0 (+1) | 2,160 (-8%) | 12mo | $160,000 | $74 | 35 |
| 34 Floral Ave | 0.45mi | 5/3.0 (+1) | 2,700 (+15%) | 17mo | $198,000 | $73 | 31 |
Match score weights: distance 35% · size 25% · config 20% · recency 20%. Top-matched comps best support the ARV.
Projected returns pro-forma
10.0% appreciation · 8.0% rent growth · sell at horizon
- IRR
- 32.7%
- Equity multiple
- 3.61×
- Total profit
- $211,852
- Equity at exit
- $261,165
- IRR
- 29.9%
- Equity multiple
- 8.85×
- Total profit
- $637,433
- Equity at exit
- $563,212
Cash invested: $81,172 (down + closing). Projections, not guarantees.
Landlord ↔ Tenant lean methodology
- Overall (STATE)
- 15 Strongly Tenant-Friendly
- State New York
- 15 Strongly Tenant-Friendly · D+10
- County
- — inherits STATE
- City
- — inherits STATE
ZIP-level market 13790
- Home prices YoY
- 6.8%
- Rents YoY
- 9.5%
- Active inventory
- 99
- Price-to-rent
- 14.9×
Monthly cashflow live
- Estimated rent
- $3,241 high interval (Pro) →
- Mortgage (P&I)
- −$1,520
- Tax from tax record
- −$342 /mo · $4,098/yr
- Insurance
- −$121
- HOA
- −$0
- Vacancy / Maint / Mgmt
- −$681
- Net cashflow
- $578
Break-even live
2-unit breakdown (identical units grouped — click to expand)
| Units | Beds | Baths | Est. rent |
|---|---|---|---|
| 2× units | 4 | 1 | $3,240 |
| #1 | 4 | 1 | $1,620 |
| #2 | 4 | 1 | $1,620 |
| Total (2 units) | $3,241 | ||
UW: 25.0% down · 7.5% · 30yr · 1.5% tax · 5.0% vac · 8.0% maint · 8.0% mgmt
Financing live
Cash to close
- Down payment
- $72,475
- Closing costs
- $8,697
- Reserves months
- —
- Total cash needed
- —
Loan-product check · same deal, 3 products live
Conventional
25% down · 7.5% · 30yr
- Down + closing
- —
- Monthly P&I
- —
- Monthly cashflow
- —
- DSCR
- —
- Eligible?
- —
Personal DTI + credit; lowest rate.
DSCR
20% down · 8.5% · 30yr
- Down + closing
- —
- Monthly P&I
- —
- Monthly cashflow
- —
- DSCR
- —
- Eligible?
- —
No personal income docs; deal must DSCR.
Hard money
10% down · 12.0% · 12mo
- Down + closing
- —
- Monthly P&I
- —
- Monthly cashflow
- —
- DSCR
- —
- Eligible?
- —
Short-term bridge; refi at stabilization.
Rent comps 5 comps
| Address | Beds | Baths | Sqft | Rent | $/sqft | DOM | Units | Dist |
|---|---|---|---|---|---|---|---|---|
| 57 Fowler Ave Johnson City, NY | 3.0 | 2.5 | 2497 | $2,000 | $0.80 | 13d | 1 | 0.46mi |
| 74 Matthews St Binghamton, NY | 3.0 | 2.0 | 2510 | $2,300 | $0.92 | 21d | 1 | 0.85mi |
| 129 Helen St Unit 1 Binghamton, NY | 4.0 | 2.0 | 1850 | $2,200 | $1.19 | 44d | 1 | 0.87mi |
| 4 Baxter St Unit Left Binghamton, NY | 4.0 | 2.5 | 1800 | $1,500 | $0.83 | 13d | 1 | 0.93mi |
| 36 Haendel St Unit 1 Binghamton, NY | 3.0 | 1.0 | 1600 | $1,650 | $1.03 | 44d | 1 | 1.16mi |
Listing history 26 events
-
2026-06-19days on market $289,900 Active 88 DOM
-
2026-06-18days on market $289,900 Active 87 DOM
-
2026-06-17days on market $289,900 Active 86 DOM
-
2026-06-16days on market $289,900 Active 85 DOM
-
2026-06-15days on market $289,900 Active 84 DOM
-
2026-06-14days on market $289,900 Active 82 DOM
-
2026-06-13days on market $289,900 Active 81 DOM
-
2026-06-10days on market $289,900 Active 79 DOM
-
2026-06-09days on market $289,900 Active 78 DOM
-
2026-06-08days on market $289,900 Active 77 DOM
-
2026-06-07days on market $289,900 Active 76 DOM
-
2026-06-05days on market $289,900 Active 73 DOM
-
2026-06-03days on market $289,900 Active 72 DOM
-
2026-06-02days on market $289,900 Active 71 DOM
-
2026-06-01days on market $289,900 Active 70 DOM
-
2026-05-31days on market $289,900 Active 69 DOM
-
2026-05-30days on market $289,900 Active 68 DOM
-
2026-05-05price $289,900 444-char remark
Show marketing remark (444 chars)
Exceptional opportunity to add a Turn-Key 2-family, 8-bedroom asset to your portfolio. Rebuilt from the ground up in 2003, it offers the advantages of newer construction—a rare find our multifamily space. Both units feature updated mechanicals, furnaces, central air, and newer kitchens and baths. Plenty of parking and close to bus lines. We have a limited inventory of newer multifamily properties like this. OWNER, REAL ESTATE LICENSEE
-
2026-03-23$299,900 Active 444-char remark
Show marketing remark (444 chars)
Exceptional opportunity to add a Turn-Key 2-family, 8-bedroom asset to your portfolio. Rebuilt from the ground up in 2003, it offers the advantages of newer construction—a rare find our multifamily space. Both units feature updated mechanicals, furnaces, central air, and newer kitchens and baths. Plenty of parking and close to bus lines. We have a limited inventory of newer multifamily properties like this. OWNER, REAL ESTATE LICENSEE
-
2025-03-02historical $1,800
-
2025-01-31$1,800
-
2025-01-06historical $1,800
-
2024-12-06$1,800
-
2024-04-10historical $1,800
-
2024-01-07$1,800
-
2023-11-21soldstatus $158,500
ⓘ Source: listings_history table (triggers on properties + properties_extension) + one-shot
backfill from property_details.listing_events for pre-trigger history.
Tax reassessment forecast NY · Partial reset (capped growth)
- Current annual tax
- $4,098 · $342/mo
- Projected year-2 tax
- $4,499 · $375/mo
- Expected delta
- +$401/yr (+$33/mo · 9.8%)
ⓘ Screening estimate from a state-policy table — verify with the county assessor before closing.
Climate risk First Street
- Flood 1/10 Low FEMA zone X · 0% chance over 30 yrs
- Wildfire 3/10 Moderate
- Heat 3/10 Moderate 7 d/yr ≥94°F today · 16 d/yr by 30 yrs out
- Wind 2/10 Low 2% chance of damaging wind over 30 yrs
- Air quality 2/10 Low 0 unhealthy d/yr today · 1 by 30 yrs out
Nearby sold comps map
Loading sold comps map…
Walkable amenities ~0.75 mi
Loading nearby amenities…
Taxation est. · year 1
- Rental income
- $38,892
- − Mortgage interest
- −$16,239
- − Property taxes
- −$4,098
- − Insurance
- −$1,450
- − Repairs & maintenance
- −$3,111
- − Management
- −$3,111
- − Depreciation
- −$8,433
- Taxable income
- $2,449
- Est. tax owed @ 24.0%
- −$588
- After-tax cash flow
- $6,346/yr
For passive investors: Depreciation is non-cash, so a rental often shows a tax loss while cash-flowing — sheltering income. Rental losses are passive: they offset passive income freely, and up to $25,000/yr can offset ordinary (W-2) income if you actively participate and your MAGI is under $100k (phasing out to $0 by $150k); unused losses carry forward. On sale, claimed depreciation is recaptured at up to 25%, and gains may owe capital-gains tax (a 1031 exchange can defer both). Figures are a year-1 estimate at your 24.0% rate — not tax advice; consult a CPA.
Schools (NCES district)
- District
- Johnson City Central School District
- NCES district ID
- 3615900
- Math proficiency
- 38% ▼ -8.00%
- Reading proficiency
- 41% ▲ 2.00%
- Median HH income
- $40,514
- Composite
- 33.17/100
- National rank
- #5545
- State rank
- #535 of 590 in NY
Livability — Johnson City
- Score
- 76/100
- State rank
- #238
- US rank
- #3739
Category grades
Schools grade is shown separately in the Schools card above.
Census & demographics
- Census place
- Johnson City, NY
- County
- Broome County · 126,805 people
- City population
- 18,739
- Metro
- Binghamton, NY
- Population (ZIP)
- 18,739
- Household income
- $59,045
- Rent vs Own
- Severe rent burden
- 1233.0
Population outlook (Broome County) Hauer SSP2
- Today (2025)
- 187,989 people
- By 2030
- 183,066 · -2.6%
- By 2040
- 172,228 · -8.4%
- By 2050
- 163,161 · -13.2%
- By 2075
- 153,641 · -18.3%
- By 2100
- 140,851 · -25.1%
Race, ethnicity, and origin ACS 2023
- Neighborhood character
- Predominantly White (75%)
- Race & ethnicity
- White 75% Two or more races 9% Asian 8% Black 6% Hispanic / Latino 4%
- Common ancestry
- Romanian 6% Lithuanian 3% Scotch-Irish 2%
- Foreign-born
- 9% · Canada, China, Vietnam
- Languages at home
- 88% English-only · Other Indo-European 4% French/Haitian/Cajun 2% Spanish 2%
Political lean MEDSL · Broome
- 2024 margin
- Toss-up / Even · D 50.2% · R 49.8%
- 2008→2024 swing
- -7.6pp toward R · 2008: 8.0pp · 2024: 0.4pp
- All cycles
- 2024: D+0.4 2020: D+3.5 2016: R+3.7 2012: D+4.6 2008: D+8.0
Not yet ingested
- Civics
- —
Market trends
- HPI YoY
- ▲ 18.06%
- Current HPI
- 285.3668
- Rent YoY
- ▲ 9.47%
- Metro
- Binghamton, NY
- State GDP YoY
- ▲ 2.60%
- F500 in state
- 92
Industry mix (Fortune 500 HQ in NY)
| Industry | F500 HQs | Revenue |
|---|---|---|
| Financial Services | 10 | $950B |
|
||
| Consumer Goods | 9 | $162B |
|
||
| Insurance | 4 | $225B |
|
||
| Telecommunications | 2 | $144B |
|
||
| Pharmaceuticals | 2 | $112B |
|
||
| Media / Entertainment | 2 | $69B |
|
||
Price history
+82.9% since first listed9 events — show timeline
- 2026-05-05 Price Changed $289,900 GBAOR
- 2026-03-23 Listed $299,900 GBAOR
- 2025-03-02 Rental Removed $1,800 RENT.
- 2025-01-31 Listed for Rent $1,800 RENT.
- 2025-01-06 Rental Removed $1,800 RENT.
- 2024-12-06 Listed for Rent $1,800 RENT.
- 2024-04-10 Rental Removed $1,800 APPFOLIO
- 2024-01-07 Listed for Rent $1,800 APPFOLIO
- 2023-11-21 Sold (Public Records) $158,500 Public Records
Property tax history
+2.2%/yrLatest (2025): $4,098 · +1.7% YoY. Source: county tax records.
Cash-flow waterfall
monthlySold comps — $/sqft
last 12 mo · ≤1 miLoading sold comps…