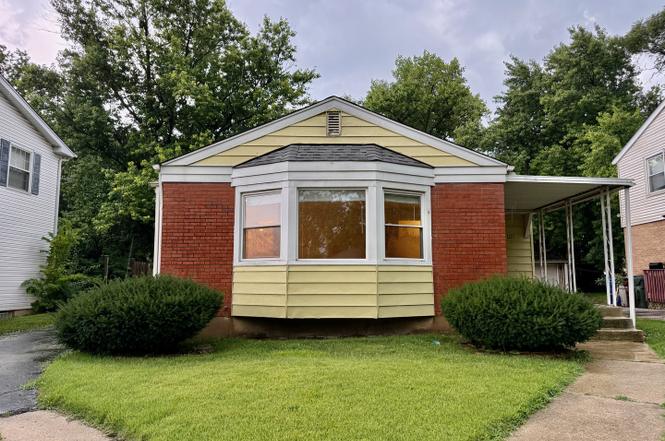
1121 Olive Rd · Homewood, IL
Flood risk 6/10 · Moderate
- FEMA flood zone
- X (unshaded)
- Chance of flooding over 30 yrs
- 0.69%
- Est. flood insurance / yr
- $473 – $860
Fire risk 1/10 · Minimal
- Est. fire insurance / yr
- $804 – $1,492
Heat risk 3/10 · Minor
- Hot days now (above 101°F)
- 7 days/yr
- Hot days in 30 yrs
- 15 days/yr
Wind risk 2/10 · Minimal
- Chance of severe wind over 30 yrs
- —
Air-quality risk 4/10 · Minor
- Unhealthy air days now
- 4 days/yr
- Unhealthy air days in 30 yrs
- 5 days/yr
Risk factors via First Street. Map © Google.
Why this score? — see what drove the D grade
The composite is a weighted blend of 9 inputs, each scored 0–100. Each bar is that input's sub-score; the figure is the points it added to the 100-point composite (weight × sub-score).
- Cash flow +14.2/30.0
- ARV discount +8.3/15.0
- 1% rule +6.0/10.0
- DSCR +4.3/10.0
- Livability +4.0/5.0
- Rent growth +2.5/5.0
- Condition / age +2.5/5.0
- Schools +2.4/10.0
- Appreciation +0.0/10.0
$265,000
🖨 Deal sheet (PDF) 📄 Offer letter ✓ Due diligence
Listing remarks
Welcome to this classic brick residence offering generous living space and a convenient Homewood location close to parks, the Metra station, shops, and local restaurants. The 23'x16' living room provides a wide, versatile layout-ideal for everyday living and hosting gatherings. A fully finished basement substantially expands the usable space, featuring a second family room, an oversized recreation area, a full bathroom, and an additional room that works well as an office, guest space, fitness room, or hobby area. With three bedrooms upstairs and 2.5 baths overall, the floor plan offers flexible options for work, play, and privacy. Enjoy the convenience of being minutes from downtown Homewoo
Key facts
- Brick residence
- Full bathroom
- Additional room
Tags
Property features AI
Finance
- HOA & community: No master association fee required
Exterior
- Parking: Detached garage (2 garage spaces, 2 total parking spaces); Asphalt driveway
- Utilities: Water from Lake Michigan and public supply; Public sewer; Electric service with circuit breakers
- Home design: Detached single-family home; Built approximately 71–80 years ago; Accessible/disability access; Interstate access nearby
- Construction: Vinyl siding and brick exterior; Asphalt roof; Built before 1978
- Exterior features: Wooded lot; Lot dimensions approximately 50 x 150; Less than 0.25 acre
Interior
- Kitchen: Eating-area kitchen (approx. 17 x 12); Range; Microwave; Refrigerator
- Bedrooms: 3 bedrooms (1 additional bedroom possible); One bedroom located in the basement; Two main-level bedrooms (approx. 11 x 9); Basement bedroom (approx. 13 x 12); Master bedroom on main level (approx. 15 x 11)
- Flooring: Hardwood throughout primary living areas
- Bathrooms: 2 full bathrooms; 1 half bathroom; Basement contains at least one bathroom
- Heating & cooling: Natural gas forced-air heating; Central air conditioning
- Interior features: Finished full basement; 7 total rooms; Hardwood flooring
- Laundry & utility: Dedicated laundry room
Neighborhood map
What this means for you Summary
Snapshot
- This is a 3-bed/1.0-bath single-family listed at $265k.
Deal economics
- At list price, monthly cash flow is $43 ($520/yr) — positive.
- The deal already cash-flows at list — no discount required.
- Meets the 1% rule at list price ($3k rent vs $265k).
Location & tenants
- Location reads 81/100 on livability (#81 in IL, #1,314 nationally) — a professional / high-income tenant draw. Strengths: commute A+, employment A+, cost of living A+; Watch: amenities F.
- Homewood Flossmoor Chsd 233 (suburban): math 21% / reading 27% proficiency, ranked #272 of 620 in IL (top 44%) — low school quality limits family demand, transient renter base, plan for 1-2y turnover.
- Zoned schools: Willow School (607 students, 0% FRL); James Hart School (math 22% / reading 37%, grade F, #256 of 665 statewide, top 41%, 711 students, 0% FRL); Homewood-Flossmoor High School (math 21% / reading 27%, grade F, #304 of 693 statewide, top 44%, 2,798 students, 0% FRL).
- Market conditions: 101 active listings in the ZIP; 6 comparable units currently listed for rent nearby; rentals at typical pace (median 25d on market — plan ~3-4 weeks tenant-placement turnaround); 6,272 units permitted in Cook County in 2024 (4,658 in 5+ unit buildings).
Forward outlook
- Local home prices are declining (-3.0%/yr); year-one equity from $2k of loan paydown is wiped out by about $8k of value loss. Plan a longer hold.
Negotiation context
- Only 11 days on market — expect competitive offers; lowballing is unlikely to land.
- 7 sale attempts since 13y ago with the ask held roughly flat each time — persistent listings suggest the price (not the market) is what's stuck; bring a comps-based counter.
Risks & watch-outs
- Watch-outs: property tax is 3.4% of price; built in 1955 — expect roof / HVAC / electrical / plumbing capex.
- Climate carrying-cost: major flood risk — expect insurance premiums to compound above CPI over the hold.
Questions for the listing agent
- Built in 1955 — when were the roof, HVAC, electrical panel, plumbing, and water heater last replaced?
- Property tax is high relative to price — has the assessment been appealed recently, and will the sale trigger a re-assessment?
- Is there a deadline driving the sale (1031 exchange, divorce, estate, relocation)? That informs how much negotiation room exists.
- Schools are D-rated, which usually means shorter tenancies and higher turnover. Who's the typical renter profile here, and what's been the actual vacancy rate?
- The area grade is low — what's the realistic commute time and amenity access for the typical tenant pool here? Any planned neighborhood developments (good or bad) we should know about?
- What's the average days-on-market for RENTAL listings here right now (not sales)? A rising rental-DOM trend means longer vacancies and softer asking-rent achievability than the comps imply.
- What's the recent tenant-quality profile in this submarket — average credit score on applications, eviction rate, late-payment / NSF rate, and stable-employment percentage? A property-management company in the area should have these aggregated.
- How much new for-sale + rental construction is in the pipeline within 1–3 miles? Heavy new supply typically softens prices + rents 12–24 months out; constrained supply supports both.
Investment metrics
- 1% rule
- 1.10% ✓
- Cap rate
- 6.49%
- Cash-on-cash
- 0.70%
- DSCR
- 1.03
- GRM
- 7.6
CMA / ARV
- ARV (on-the-fly)
- $270,072
- Comps found
- 12
Show comp detail 12 sales within ~0.75 mi
| Address | Dist | Beds/Ba | Sqft | Sold | Price | $/sf | Match |
|---|---|---|---|---|---|---|---|
| 1207 Olive Rd | 0.09mi | 3/2.0 | 1,459 (+7%) | 1mo | $225,000 | $154 | 80 |
| 1465 Ridge Rd | 0.46mi | 3/2.0 | 1,372 (+1%) | 3mo | $235,000 | $171 | 71 |
| 18430 Aberdeen St | 0.32mi | 3/2.0 | 1,223 (-10%) | 0mo | $242,000 | $198 | 64 |
| 17917 Ashland Ave | 0.66mi | 3/1.0 | 1,248 (-8%) | 0mo | $214,900 | $172 | 55 |
| 1524 Olive Rd | 0.51mi | 2/1.5 (-1) | 1,229 (-10%) | 2mo | $227,000 | $185 | 51 |
| 900 W Strieff Ln | 0.72mi | 3/1.5 | 1,269 (-7%) | 3mo | $210,000 | $165 | 50 |
| 1041 Coach Rd | 0.73mi | 4/2.0 (+1) | 1,407 (+3%) | 2mo | $289,000 | $205 | 50 |
| 1522 186th St | 0.70mi | 3/1.0 | 1,209 (-11%) | 3mo | $226,000 | $187 | 46 |
| 1464 Linden Rd | 0.52mi | 4/2.0 (+1) | 1,198 (-12%) | 1mo | $247,350 | $206 | 46 |
| 807 W Manor Ct W | 0.69mi | 4/1.5 (+1) | 1,232 (-10%) | 1mo | $245,000 | $199 | 44 |
| 914 Coach Rd | 0.75mi | 3/1.5 | 1,197 (-12%) | 0mo | $275,000 | $230 | 42 |
| 945 W 187th St | 0.70mi | 4/1.5 (+1) | 1,197 (-12%) | 4mo | $244,000 | $204 | 36 |
Match score weights: distance 35% · size 25% · config 20% · recency 20%. Top-matched comps best support the ARV.
Projected returns pro-forma
-3.0% appreciation · 3.0% rent growth · sell at horizon
- IRR
- -15.0%
- Equity multiple
- 0.46×
- Total profit
- $-39,878
- Equity at exit
- $39,512
- IRR
- -6.2%
- Equity multiple
- 0.60×
- Total profit
- $-29,945
- Equity at exit
- $22,912
Cash invested: $74,200 (down + closing). Projections, not guarantees.
Landlord ↔ Tenant lean methodology
- Overall (STATE)
- 43 Moderately Tenant-Leaning
- State Illinois
- 43 Moderately Tenant-Leaning · D+7
- County
- — inherits STATE
- City
- — inherits STATE
ZIP-level market 60430
- Home prices YoY
- -32.1%
- Active inventory
- 101
- Price-to-rent
- 7.6×
Monthly cashflow live
- Estimated rent
- $2,903 high interval (Pro) →
- Mortgage (P&I)
- −$1,390
- Tax from tax record
- −$750 /mo · $8,999/yr
- Insurance
- −$110
- HOA
- −$0
- Lot rent
- −$0
- Vacancy / Maint / Mgmt
- −$610
- Net cashflow
- $43
Break-even live
Sensitivity live
| Price | -10% $193 | -5% $118 | +0% $43 | +5% $-32 | +10% $-107 |
|---|---|---|---|---|---|
| Rent | -10% $-186 | -5% $-71 | +0% $43 | +5% $158 | +10% $273 |
| Rate | -1.0pp $177 | -0.5pp $111 | base $43 | +0.5pp $-25 | +1.0pp $-95 |
UW: 25.0% down · 7.5% · 30yr · 1.5% tax · 5.0% vac · 8.0% maint · 8.0% mgmt
Financing live
Cash to close
- Down payment
- $66,250
- Closing costs
- $7,950
- Reserves months
- —
- Total cash needed
- —
Loan-product check · same deal, 3 products live
Conventional
25% down · 7.5% · 30yr
- Down + closing
- —
- Monthly P&I
- —
- Monthly cashflow
- —
- DSCR
- —
- Eligible?
- —
Personal DTI + credit; lowest rate.
DSCR
20% down · 8.5% · 30yr
- Down + closing
- —
- Monthly P&I
- —
- Monthly cashflow
- —
- DSCR
- —
- Eligible?
- —
No personal income docs; deal must DSCR.
Hard money
10% down · 12.0% · 12mo
- Down + closing
- —
- Monthly P&I
- —
- Monthly cashflow
- —
- DSCR
- —
- Eligible?
- —
Short-term bridge; refi at stabilization.
Rent comps 6 comps
| Address | Beds | Baths | Sqft | Rent | $/sqft | DOM | Units | Dist |
|---|---|---|---|---|---|---|---|---|
| 18117 Loomis Ave Homewood, IL | 4.0 | 2.0 | 1500 | $2,800 | $1.87 | 6d | 1 | 0.31mi |
| 1601 183rd St Unit 1237861P Homewood, IL | 3.0 | 1.5 | 1528 | $8,665 | $5.67 | 24d | 1 | 0.57mi |
| 705 W Fitzhenry Ct Glenwood, IL | 3.0 | 2.0 | 1600 | $2,950 | $1.84 | 22d | 1 | 0.82mi |
| 705 W Fitzhenry Ct Glenwood, IL | 3.0 | 2.0 | 1700 | $2,950 | $1.74 | 27d | 1 | 0.82mi |
| 1802 Evergreen Rd Homewood, IL | 4.0 | 2.0 | 1716 | $2,836 | $1.65 | 1d | 1 | 0.83mi |
| 1332 Jamie Ln Homewood, IL | 4.0 | 2.5 | 1576 | $3,171 | $2.01 | 26d | 1 | 0.84mi |
Listing history 40 events
-
2026-06-22days on market $265,000 Active 11 DOM
-
2026-06-21days on market $265,000 Active 10 DOM
-
2026-06-18days on market $265,000 Active 7 DOM
-
2026-06-17days on market $265,000 Active 6 DOM
-
2026-06-16days on market $265,000 Active 5 DOM
-
2026-06-15days on market $265,000 Active 4 DOM
-
2026-06-13days on market $265,000 Active 2 DOM
-
2026-06-09days on market $265,000 Active 215 DOM
-
2026-06-08days on market $265,000 Active 214 DOM
-
2026-06-07days on market $265,000 Active 213 DOM
-
2026-06-04days on market $265,000 Active 210 DOM
-
2026-06-03days on market $265,000 Active 209 DOM
-
2026-06-02days on market $265,000 Active 208 DOM
-
2026-06-01days on market $265,000 Active 207 DOM
-
2026-05-31days on market $265,000 Active 206 DOM
-
2026-04-23status Active
-
2026-03-20historical Contingent - Continue to Show
-
2026-01-16price $270,000
-
2025-12-19price $278,000
-
2025-11-21price $287,000
-
2025-11-06$296,000 Active
-
2025-11-06historical
-
2025-10-03price
-
2025-09-27price
-
2025-09-19price
-
2025-09-05price
-
2025-08-21Active
-
2022-05-12price $2,195
-
2017-12-26soldstatus $1,590,000
-
2014-11-20soldstatus $152,000
-
2014-10-31soldstatus $152,000 Closed Sale 254-char remark
-
2014-10-01status Pending 254-char remark
-
2014-08-13$170,500 New 254-char remark
-
2014-08-06soldstatus $60,200 Closed Sale
-
2014-04-30status Pending
-
2014-04-30$61,000 New
-
2014-04-04historical
-
2013-10-16status Pending
-
2013-09-24New
-
1999-10-14soldstatus $115,000
ⓘ Source: listings_history table (triggers on properties + properties_extension) + one-shot
backfill from property_details.listing_events for pre-trigger history.
Tax reassessment forecast IL · Partial reset (capped growth)
- Current annual tax
- $8,999 · $750/mo
- Projected year-2 tax
- $8,999 · $750/mo
- Expected delta
- $0/yr ($0/mo · 0.0%)
ⓘ Screening estimate from a state-policy table — verify with the county assessor before closing.
Climate risk First Street
- Flood 6/10 Major FEMA zone X (unshaded) · 69% chance over 30 yrs
- Wildfire 1/10 Low
- Heat 3/10 Moderate 7 d/yr ≥101°F today · 15 d/yr by 30 yrs out
- Wind 2/10 Low
- Air quality 4/10 Moderate 4 unhealthy d/yr today · 5 by 30 yrs out
Nearby sold comps map
Loading sold comps map…
Walkable amenities ~0.75 mi
Loading nearby amenities…
Taxation est. · year 1
- Rental income
- $34,836
- − Mortgage interest
- −$14,844
- − Property taxes
- −$8,999
- − Insurance
- −$1,325
- − Repairs & maintenance
- −$2,787
- − Management
- −$2,787
- − Depreciation
- −$7,709
- Taxable loss
- −$3,615
- Est. tax savings @ 24.0%
- +$868
- After-tax cash flow
- $1,388/yr
For passive investors: Depreciation is non-cash, so a rental often shows a tax loss while cash-flowing — sheltering income. Rental losses are passive: they offset passive income freely, and up to $25,000/yr can offset ordinary (W-2) income if you actively participate and your MAGI is under $100k (phasing out to $0 by $150k); unused losses carry forward. On sale, claimed depreciation is recaptured at up to 25%, and gains may owe capital-gains tax (a 1031 exchange can defer both). Figures are a year-1 estimate at your 24.0% rate — not tax advice; consult a CPA.
Schools (NCES district)
- District
- Homewood Flossmoor Chsd 233
- NCES district ID
- 1719560
- Math proficiency
- 21% ▼ -15.00%
- Reading proficiency
- 27% ▼ -13.00%
- Median HH income
- $83,564
- Composite
- 24.42/100
- National rank
- #7681
- State rank
- #272 of 620 in IL
Livability — Homewood
- Score
- 81/100
- State rank
- #81
- US rank
- #1314
Category grades
Schools grade is shown separately in the Schools card above.
Census & demographics
- Census place
- Homewood, IL
- City population
- 19,993
- Population (ZIP)
- 19,993
Population outlook (Cook County) Hauer SSP2
- Today (2025)
- 5,347,519 people
- By 2030
- 5,357,703 · +0.2%
- By 2040
- 5,324,924 · -0.4%
- By 2050
- 5,230,762 · -2.2%
- By 2075
- 4,785,735 · -10.5%
- By 2100
- 4,188,836 · -21.7%
Race, ethnicity, and origin ACS 2023
- Neighborhood character
- Diverse neighborhood (Simpson 0.62)
- Race & ethnicity
- Black 44% White 42% Hispanic / Latino 9% Two or more races 6% Asian 1%
- Hispanic origin (detail)
- Mexican 7%
- Common ancestry
- Romanian 5% Iranian 2% Italian 2%
- Foreign-born
- 6% · Canada, Dominican Republic
- Languages at home
- 91% English-only · Spanish 5% Russian/Polish/Slavic 1% German/W. Germanic 1%
Political lean MEDSL · Cook
- 2024 margin
- Solid D (+42.0) · D 70.4% · R 28.4% · Other 1.2%
- 2008→2024 swing
- -11.4pp toward R · 2008: 53.4pp · 2024: 42.0pp
- All cycles
- 2024: D+42.0 2020: D+50.3 2016: D+53.0 2012: D+49.4 2008: D+53.4
Not yet ingested
- Civics
- —
Market trends
- HPI YoY
- ▼ -105.00%
- Current HPI
- 222.2923
- Rent YoY
- —
- Metro
- —
- State GDP YoY
- ▲ 1.59%
- F500 in state
- 60
Industry mix (Fortune 500 HQ in IL)
| Industry | F500 HQs | Revenue |
|---|---|---|
| Insurance | 4 | $201B |
|
||
| Consumer Goods | 4 | $87B |
|
||
| Industrial Machinery | 3 | $64B |
|
||
| Healthcare | 2 | $55B |
|
||
| Retail / Pharmacy | 1 | $148B |
|
||
| Agriculture / Food | 1 | $86B |
|
||
Price history
+130.4% since first listed28 events — show timeline
- 2026-06-11 Listing Removed — MRED as Distributed by MLS Grid
- 2026-06-11 Listed $265,000 MRED as Distributed by MLS Grid
- 2026-05-29 Price Changed — MRED as Distributed by MLS Grid
- 2026-04-23 Relisted — MRED as Distributed by MLS Grid
- 2026-03-20 Contingent — MRED as Distributed by MLS Grid
- 2026-01-16 Price Changed — MRED as Distributed by MLS Grid
- 2025-12-19 Price Changed — MRED as Distributed by MLS Grid
- 2025-11-21 Price Changed — MRED as Distributed by MLS Grid
- 2025-11-06 Listing Removed — MRED as Distributed by MLS Grid
- 2025-11-06 Listed — MRED as Distributed by MLS Grid
- 2025-10-03 Price Changed — MRED as Distributed by MLS Grid
- 2025-09-27 Price Changed — MRED as Distributed by MLS Grid
- 2025-09-19 Price Changed — MRED as Distributed by MLS Grid
- 2025-09-05 Price Changed — MRED as Distributed by MLS Grid
- 2025-08-21 Listed — MRED as Distributed by MLS Grid
- 2022-05-12 Price Changed $2,195 RENT.
- 2017-12-26 Sold (Public Records) $1,590,000 Public Records
- 2014-11-20 Sold (Public Records) $152,000 Public Records
- 2014-10-31 Sold (MLS) $152,000 MRED as Distributed by MLS Grid
- 2014-10-01 Pending — MRED as Distributed by MLS Grid
- 2014-08-13 Listed $170,500 MRED as Distributed by MLS Grid
- 2014-08-06 Sold (MLS) $60,200 MRED as Distributed by MLS Grid
- 2014-04-30 Pending — MRED as Distributed by MLS Grid
- 2014-04-30 Listed $61,000 MRED as Distributed by MLS Grid
- 2014-04-04 Listing Removed — MRED as Distributed by MLS Grid
- 2013-10-16 Pending — MRED as Distributed by MLS Grid
- 2013-09-24 Listed — MRED as Distributed by MLS Grid
- 1999-10-14 Sold (Public Records) $115,000 Public Records
Property tax history
+5.1%/yrLatest (2023): $8,999 · +24.8% YoY. Source: county tax records.
Cash-flow waterfall
monthlySold comps — $/sqft
last 12 mo · ≤1 miLoading sold comps…