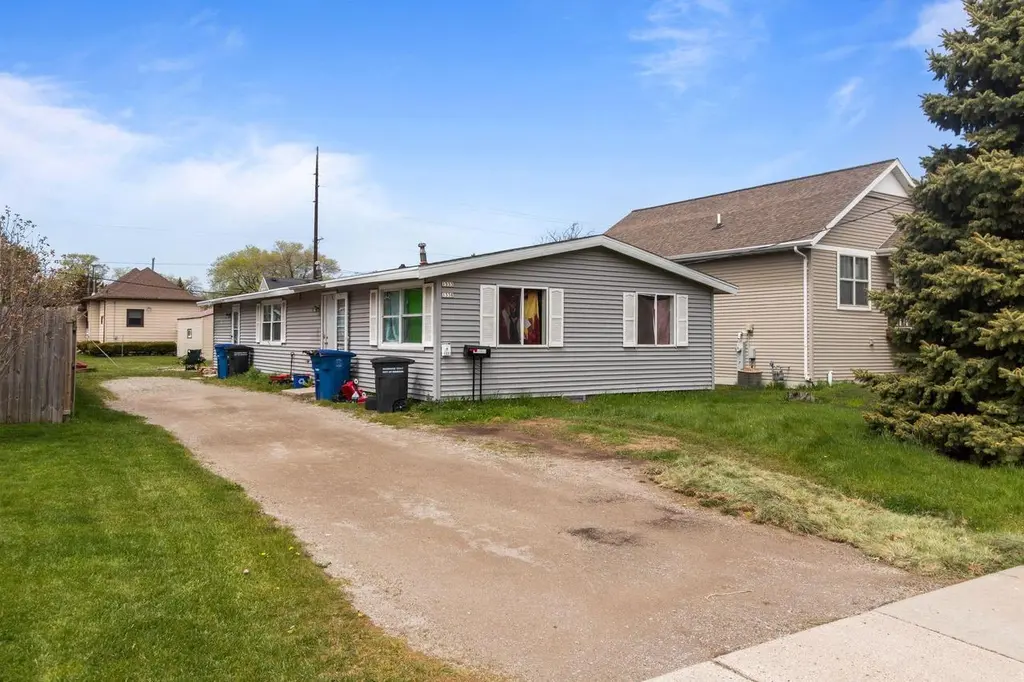
 Duplex
1331 Broad St · Oshkosh, WI
Flood risk 6/10 · Moderate
- FEMA flood zone
- X (unshaded)
- Chance of flooding over 30 yrs
- 0.73%
- Est. flood insurance / yr
- $507 – $1,088
Fire risk 1/10 · Minimal
- Est. fire insurance / yr
- $636 – $1,182
Heat risk 2/10 · Minimal
- Hot days now (above 97°F)
- 7 days/yr
- Hot days in 30 yrs
- 13 days/yr
Wind risk 2/10 · Minimal
- Chance of severe wind over 30 yrs
- —
Air-quality risk 2/10 · Minimal
- Unhealthy air days now
- 1 days/yr
- Unhealthy air days in 30 yrs
- 2 days/yr
Risk factors via First Street. Map © Google.
Why this score? — see what drove the D grade
The composite is a weighted blend of 9 inputs, each scored 0–100. Each bar is that input's sub-score; the figure is the points it added to the 100-point composite (weight × sub-score).
- Cash flow +18.7/30.0
- DSCR +5.9/10.0
- 1% rule +4.7/10.0
- Livability +4.2/5.0
- Rent growth +3.7/5.0
- Schools +2.9/10.0
- Condition / age +2.5/5.0
- ARV discount +0.0/15.0
- Appreciation +0.0/10.0
$225,000
🖨 Deal sheet (PDF) 📄 Offer letter ✓ Due diligence
Multi-family units
County records classify this as Multi-Family (2-4 Unit). Listing-text estimate: 2 units. confirmed
Listing remarks
Excellent investment opportunity - this well-maintained side-by-side duplex offers $3,000/month in rental income! Each unit features desirable single-level living, updated flooring, and functional layouts that tenants will appreciate. Major exterior improvement includes a roof replacement completed in 2020, adding long-term value and peace of mind. Whether you?re looking to expand your portfolio or owner-occupy, this property is a fantastic opportunity with steady income potential. Schedule your showing today!
Key facts
- Side-by-side duplex
- Roof replacement
- Updated flooring
Tags
Property features AI
Finance
- Other: Property listed as multi-family with 2 units; Inclusions: 2 refrigerators and 2 stoves; Exclusions: seller/tenant personal property
Exterior
- Parking: Outside parking
- Utilities: Municipal water; Municipal sewer
- Home design: Multi-family duplex; One-story building; Estimated living area between 1,251 and 1,500 total
- Construction: Assessor/public record indicates year built (see public records)
- Exterior features: Vinyl exterior; Lot size about 0.15 acre; Less than 1/2 acre
Interior
- Kitchen: Unit 2 kitchen ~12 x 11; Two stoves included; Two refrigerators included
- Bedrooms: Unit 1: 2 bedrooms; Unit 2: 2 bedrooms (master ~9 x 10; second ~9 x 10)
- Bathrooms: Unit 1: 1 full bathroom; Unit 2: 1 full bathroom
- Heating & cooling: Forced air heating; Natural gas fuel
- Interior features: Crawl space; Poured concrete basement
Neighborhood map
What this means for you Summary
Snapshot
- This is a 2 × 2-bed/1.0-bath units multifamily listed at $225k.
Deal economics
- At list price, monthly cash flow is $221 ($3k/yr) — positive. Per door: $110/mo.
- The deal already cash-flows at list — no discount required.
- To meet the 1% rule (rent ≥ 1% of price), the offer needs to be $217k (3.4% below list).
- Recommended offer: $217k (3.4% below list) — sets the bar for 1% rule.
- Cap rate 7.5% vs local median 3.7% in Oshkosh — top-decile yield for the area; either an underpriced asset or a hidden risk that comps aren't pricing in. Stress-test before assuming the spread holds.
Location & tenants
- Location reads 85/100 on livability (#29 in WI, #574 nationally) — a professional / high-income tenant draw. Strengths: cost of living A+, housing A+, health & safety A+.
- Oshkosh Area School District (urban): math 33% / reading 34% proficiency, ranked #246 of 342 in WI (top 72%) — families likely to look elsewhere, expect single-tenant / working-renter base with shorter leases.
- Zoned schools: E Cook Elementary (math 32% / reading 27%, grade F, #705 of 1,041 statewide, top 71%, 226 students, 59% FRL); Webster Stanley Middle (math 15% / reading 21%, grade F, #360 of 383 statewide, top 94%, 335 students, 57% FRL); North High (math 24% / reading 39%, grade F, #199 of 483 statewide, top 42%, 1,265 students, 52% FRL) — zoned schools average 56% FRL vs 34% district-wide (22 pts higher); higher-poverty schools than district average — tighter screening recommended.
- Market conditions: Rents rising fast (+5.0%/yr); 83 active listings in the ZIP; 20 comparable units currently listed for rent nearby; rentals at typical pace (median 23d on market — plan ~3-4 weeks tenant-placement turnaround); 40% of comp listings sitting > 30 days — soft ceiling on asking rent; 652 units permitted in Winnebago County in 2024 (333 in 5+ unit buildings).
- This rent runs 42% of the median local income ($62k/yr) — at the standard rent-burdened threshold; future hikes will face affordability resistance.
Forward outlook
- Local home prices are declining (-3.0%/yr); year-one equity from $2k of loan paydown is wiped out by about $7k of value loss. Plan a longer hold.
- Winnebago County population projected at +3% by 2050 — modest demand growth; plan on rents tracking national, not racing it.
Negotiation context
- It's been on market 38 days — a 3% lower offer ($218k) is reasonable based on typical stale-listing flexibility.
- Current owner paid $176k; 27% above their basis — modest negotiation headroom, anchor on the comps not their cost.
Risks & watch-outs
- Climate carrying-cost: major flood risk — expect insurance premiums to compound above CPI over the hold.
Questions for the listing agent
- It's been on market 38 days. Have you received any prior offers? Is the seller open to a 3% concession, seller financing, or rate buy-down credit?
- Can we see the unit-by-unit rent roll, current vacancy, and any below-market leases? What's the average tenancy length?
- What capital expenditures (roof, boiler, parking lot, exteriors) have been made in the last 5 years, and what's planned in the next 2?
- Built in 1969 — when were the roof, HVAC, electrical panel, plumbing, and water heater last replaced?
- Is there a deadline driving the sale (1031 exchange, divorce, estate, relocation)? That informs how much negotiation room exists.
- The area grade is low — what's the realistic commute time and amenity access for the typical tenant pool here? Any planned neighborhood developments (good or bad) we should know about?
- What's the average days-on-market for RENTAL listings here right now (not sales)? A rising rental-DOM trend means longer vacancies and softer asking-rent achievability than the comps imply.
- What's the recent tenant-quality profile in this submarket — average credit score on applications, eviction rate, late-payment / NSF rate, and stable-employment percentage? A property-management company in the area should have these aggregated.
- How much new apartment / multifamily construction is in the pipeline within 1–3 miles? Heavy new supply (>2% of stock underway) typically softens rents 12–24 months out; light construction supports rent growth.
Investment metrics
- 1% rule
- 0.97% ✗
- Cap rate
- 7.47%
- Cash-on-cash
- 4.20%
- DSCR
- 1.19
- GRM
- 8.6
CMA / ARV
- ARV (median comp)
- $163,347
- List price
- $225,000
- Delta
- 37.74%
- Verdict
- OVERPRICED
- Comps
- 20 within 1.0 mi
Show comp detail 5 sales within ~0.75 mi
| Address | Dist | Beds/Ba | Sqft | Sold | Price | $/sf | Match |
|---|---|---|---|---|---|---|---|
| 1515 Harrison St | 0.21mi | 3/2.0 (+1) | 1,296 (-7%) | 11mo | $150,000 | $116 | 63 |
| 756 Powers St | 0.55mi | 3/2.0 (+1) | 1,452 (+4%) | 2mo | $170,000 | $117 | 61 |
| 117 E New York Ave | 0.25mi | 2/2.0 | 1,302 (-7%) | 19mo | $138,000 | $106 | 61 |
| 318 Sterling Ave | 0.42mi | 3/2.0 (+1) | 1,553 (+11%) | 1mo | $190,000 | $122 | 56 |
| 1222 N Main St | 0.29mi | 2/2.0 | 1,596 (+14%) | 9mo | $160,000 | $100 | 56 |
Match score weights: distance 35% · size 25% · config 20% · recency 20%. Top-matched comps best support the ARV.
Projected returns pro-forma
-3.0% appreciation · 4.97% rent growth · sell at horizon
- IRR
- -7.6%
- Equity multiple
- 0.71×
- Total profit
- $-18,011
- Equity at exit
- $33,548
- IRR
- 4.2%
- Equity multiple
- 1.34×
- Total profit
- $21,176
- Equity at exit
- $19,454
Cash invested: $63,000 (down + closing). Projections, not guarantees.
Landlord ↔ Tenant lean methodology
- Overall (STATE)
- 73 Landlord-Friendly
- State Wisconsin
- 73 Landlord-Friendly · R+2
- County
- — inherits STATE
- City
- — inherits STATE
ZIP-level market 54901
- Rents YoY
- 5.0%
- Active inventory
- 83
- Price-to-rent
- 17.3×
Monthly cashflow live
- Estimated rent
- $2,174 high interval (Pro) →
- Mortgage (P&I)
- −$1,180
- Tax from tax record
- −$223 /mo · $2,677/yr
- Insurance
- −$94
- HOA
- −$0
- Vacancy / Maint / Mgmt
- −$457
- Net cashflow
- $221
Break-even live
Sensitivity live
| Price | -10% $348 | -5% $284 | +0% $221 | +5% $157 | +10% $93 |
|---|---|---|---|---|---|
| Rent | -10% $49 | -5% $135 | +0% $221 | +5% $307 | +10% $392 |
| Rate | -1.0pp $334 | -0.5pp $278 | base $221 | +0.5pp $162 | +1.0pp $103 |
2-unit breakdown (identical units grouped — click to expand)
| Units | Beds | Baths | Est. rent |
|---|---|---|---|
| 2× units | 2 | 1 | $2,174 |
| #1 | 2 | 1 | $1,087 |
| #2 | 2 | 1 | $1,087 |
| Total (2 units) | $2,174 | ||
UW: 25.0% down · 7.5% · 30yr · 1.5% tax · 5.0% vac · 8.0% maint · 8.0% mgmt
Financing live
Cash to close
- Down payment
- $56,250
- Closing costs
- $6,750
- Reserves months
- —
- Total cash needed
- —
Loan-product check · same deal, 3 products live
Conventional
25% down · 7.5% · 30yr
- Down + closing
- —
- Monthly P&I
- —
- Monthly cashflow
- —
- DSCR
- —
- Eligible?
- —
Personal DTI + credit; lowest rate.
DSCR
20% down · 8.5% · 30yr
- Down + closing
- —
- Monthly P&I
- —
- Monthly cashflow
- —
- DSCR
- —
- Eligible?
- —
No personal income docs; deal must DSCR.
Hard money
10% down · 12.0% · 12mo
- Down + closing
- —
- Monthly P&I
- —
- Monthly cashflow
- —
- DSCR
- —
- Eligible?
- —
Short-term bridge; refi at stabilization.
Rent comps 20 comps
| Address | Beds | Baths | Sqft | Rent | $/sqft | DOM | Units | Dist |
|---|---|---|---|---|---|---|---|---|
| 1860 Evans St #3 Oshkosh, WI | 2.0 | 1.0 | 875 | $950 | $1.09 | 15d | 1 | 0.58mi |
| 2001 Evans St Oshkosh, WI | 3.0 | 1.5 | 900 | $1,399 | $1.55 | 22d | 2 | 0.60mi |
| 319 E Irving Ave Oshkosh, WI | 3.0 | 1.5 | 1384 | $1,250 | $0.90 | 45d | 1 | 0.65mi |
| 650 N Main St Oshkosh, WI | 1.0–3.0 | 1.0–2.0 | 925 | $1,524 | $1.65 | 22d | 12 | 0.67mi |
| 919 Wright St Unit A Oshkosh, WI | 3.0 | 1.0 | 1100 | $1,100 | $1.00 | 45d | 1 | 0.68mi |
| 622 Grand St Oshkosh, WI | 2.0 | 1.0 | 900 | $895 | $0.99 | 45d | 1 | 0.77mi |
| 825 Wisconsin St Unit 1B Oshkosh, WI | 3.0 | 1.0 | 1200 | $1,199 | $1.00 | 45d | 1 | 0.81mi |
| 728 Wisconsin St Oshkosh, WI | 2.0–3.0 | 1.0 | 950 | $1,100 | $1.16 | 45d | 2 | 0.85mi |
| 728 Wisconsin St Apt 3 Oshkosh, WI | 2.0 | 1.0 | 950 | $1,100 | $1.16 | 22d | 1 | 0.85mi |
| 830 Stillwell Ave Unit 828 Oshkosh, WI | 3.0 | 1.5 | 960 | $1,299 | $1.35 | 22d | 1 | 0.92mi |
| 548 Bowen St Oshkosh, WI | 2.0 | 1.0 | 900 | $850 | $0.94 | 15d | 1 | 0.92mi |
| 1120 E Parkway Ave Oshkosh, WI | 2.0 | 2.0 | 950 | $1,195 | $1.26 | 15d | 1 | 0.93mi |
| 513 Evans St Unit 1514469P Oshkosh, WI | 3.0 | 1.5 | 1270 | $2,909 | $2.29 | 22d | 1 | 1.00mi |
| 512 Algoma Blvd Unit 212 Oshkosh, WI | 2.0 | 1.0 | 900 | $999 | $1.11 | 15d | 1 | 1.03mi |
| 306 Wisconsin St Oshkosh, WI | 3.0 | 1.0 | 1500 | $1,500 | $1.00 | 45d | 1 | 1.10mi |
| 95 Dawes St Oshkosh, WI | 3.0 | 2.0 | 1520 | $1,650 | $1.09 | 45d | 1 | 1.24mi |
| 155 Jackson St Oshkosh, WI | 2.0 | 1.0–2.0 | 716 | $1,775 | $2.48 | 22d | 8 | 1.24mi |
| 100 N Main St Oshkosh, WI | 2.0 | 2.0 | 1100 | $1,495 | $1.36 | 15d | 1 | 1.31mi |
| 835 Waugoo Ave Unit A Oshkosh, WI | 2.0 | 1.0 | 1000 | $995 | $0.99 | 45d | 1 | 1.34mi |
| 417 Marion Rd Oshkosh, WI | 1.0–2.0 | 1.0–2.0 | 778 | $2,500 | $3.21 | 15d | 10 | 1.36mi |
Listing history 22 events
-
2026-06-22days on market $225,000 Active 38 DOM
-
2026-06-19days on market $225,000 Active 36 DOM
-
2026-06-18days on market $225,000 Active 35 DOM
-
2026-06-17days on market $225,000 Active 34 DOM
-
2026-06-16days on market $225,000 Active 33 DOM
-
2026-06-15days on market $225,000 Active 32 DOM
-
2026-06-14days on market $225,000 Active 30 DOM
-
2026-06-13days on market $225,000 Active 29 DOM
-
2026-06-10days on market $225,000 Active 27 DOM
-
2026-06-09days on market $225,000 Active 26 DOM
-
2026-06-09price $225,000 Active 25 DOM
-
2026-06-08days on market $234,900 Active 25 DOM
-
2026-06-07days on market $234,900 Active 24 DOM
-
2026-06-02days on market $234,900 Active 19 DOM
-
2026-06-01days on market $234,900 Active 18 DOM
-
2026-05-31days on market $234,900 Active 17 DOM
-
2026-05-30days on market $234,900 Active 16 DOM
-
2026-05-15price $234,900 515-char remark
-
2026-05-14$235,000 Active 515-char remark
-
2025-07-14soldstatus $176,500
-
2024-03-14soldstatus $124,000
-
2001-10-04soldstatus $56,000
ⓘ Source: listings_history table (triggers on properties + properties_extension) + one-shot
backfill from property_details.listing_events for pre-trigger history.
Tax reassessment forecast WI · Partial reset (capped growth)
- Current annual tax
- $2,677 · $223/mo
- Projected year-2 tax
- $3,420 · $285/mo
- Expected delta
- +$743/yr (+$62/mo · 27.8%)
ⓘ Screening estimate from a state-policy table — verify with the county assessor before closing.
Climate risk First Street
- Flood 6/10 Major FEMA zone X (unshaded) · 73% chance over 30 yrs
- Wildfire 1/10 Low
- Heat 2/10 Low 7 d/yr ≥97°F today · 13 d/yr by 30 yrs out
- Wind 2/10 Low
- Air quality 2/10 Low 1 unhealthy d/yr today · 2 by 30 yrs out
Nearby sold comps map
Loading sold comps map…
Walkable amenities ~0.75 mi
Loading nearby amenities…
Taxation est. · year 1
- Rental income
- $26,088
- − Mortgage interest
- −$12,603
- − Property taxes
- −$2,677
- − Insurance
- −$1,125
- − Repairs & maintenance
- −$2,087
- − Management
- −$2,087
- − Depreciation
- −$6,545
- Taxable loss
- −$1,037
- Est. tax savings @ 24.0%
- +$249
- After-tax cash flow
- $2,897/yr
For passive investors: Depreciation is non-cash, so a rental often shows a tax loss while cash-flowing — sheltering income. Rental losses are passive: they offset passive income freely, and up to $25,000/yr can offset ordinary (W-2) income if you actively participate and your MAGI is under $100k (phasing out to $0 by $150k); unused losses carry forward. On sale, claimed depreciation is recaptured at up to 25%, and gains may owe capital-gains tax (a 1031 exchange can defer both). Figures are a year-1 estimate at your 24.0% rate — not tax advice; consult a CPA.
Schools (NCES district)
- District
- Oshkosh Area School District
- NCES district ID
- 5511190
- Math proficiency
- 33% ▼ -7.00%
- Reading proficiency
- 34% ▼ -2.00%
- Median HH income
- $48,048
- Composite
- 28.92/100
- National rank
- #6634
- State rank
- #246 of 342 in WI
Livability — Oshkosh
- Score
- 85/100
- State rank
- #29
- US rank
- #574
Category grades
Schools grade is shown separately in the Schools card above.
Census & demographics
- Census place
- Oshkosh, WI
- County
- Winnebago County · 155,689 people
- City population
- 81,810
- Metro
- Oshkosh-Neenah, WI
- Population (ZIP)
- 37,294
- Household income
- $61,794
- Rent vs Own
- Severe rent burden
- 1484.0
Population outlook (Winnebago County) Hauer SSP2
- Today (2025)
- 175,480 people
- By 2030
- 177,928 · +1.4%
- By 2040
- 180,873 · +3.1%
- By 2050
- 181,302 · +3.3%
- By 2075
- 184,071 · +4.9%
- By 2100
- 175,932 · +0.3%
Race, ethnicity, and origin ACS 2023
- Neighborhood character
- Predominantly White (80%)
- Race & ethnicity
- White 80% Black 6% Hispanic / Latino 6% Two or more races 5% Asian 4%
- Hispanic origin (detail)
- Mexican 3% Puerto Rican 2%
- Common ancestry
- Romanian 6% Portuguese 4% Lithuanian 2%
- Foreign-born
- 4% · Canada
- Languages at home
- 93% English-only · Other Asian/Pacific 2% Spanish 2% Arabic 1%
Political lean MEDSL · Winnebago
- 2024 margin
- Toss-up / Even · D 46.9% · R 51.7% · Other 1.4%
- 2008→2024 swing
- -16.4pp toward R · 2008: 11.7pp · 2024: -4.8pp
- All cycles
- 2024: R+4.8 2020: R+4.0 2016: R+7.4 2012: D+3.8 2008: D+11.7
Not yet ingested
- Civics
- —
Market trends
- HPI YoY
- ▼ -128.12%
- Current HPI
- 187.7253
- Rent YoY
- ▲ 4.97%
- Metro
- Oshkosh-Neenah, WI
- State GDP YoY
- ▲ 2.10%
- F500 in state
- 20
Industry mix (Fortune 500 HQ in WI)
| Industry | F500 HQs | Revenue |
|---|---|---|
| Industrial Machinery | 4 | $23B |
|
||
| Industrial Technology | 2 | $36B |
|
||
| Insurance | 1 | $36B |
|
||
| Professional Services | 1 | $19B |
|
||
| Utilities | 1 | $9B |
|
||
| Consumer Goods | 1 | $3B |
|
||
Price history
+301.8% since first listed6 events — show timeline
- 2026-06-08 Price Changed $225,000 RANW
- 2026-05-15 Price Changed $234,900 RANW
- 2026-05-14 Listed $235,000 RANW
- 2025-07-14 Sold (Public Records) $176,500 Public Records
- 2024-03-14 Sold (Public Records) $124,000 Public Records
- 2001-10-04 Sold (Public Records) $56,000 Public Records
Property tax history
+3.0%/yrLatest (2024): $2,677 · +20.9% YoY. Source: county tax records.
Cash-flow waterfall
monthlySold comps — $/sqft
last 12 mo · ≤1 miLoading sold comps…