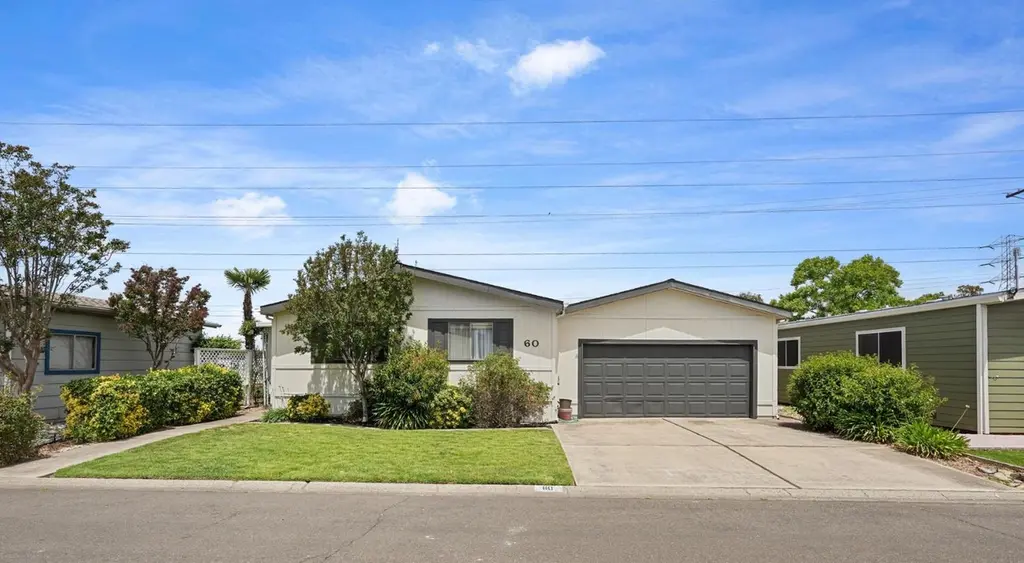
60 Hancock Dr · Roseville, CA
Flood risk 1/10 · Minimal
- FEMA flood zone
- X (unshaded)
- Chance of flooding over 30 yrs
- 0.0%
- Est. flood insurance / yr
- $507 – $1,088
Fire risk 5/10 · Moderate
- Est. fire insurance / yr
- $659 – $1,223
Heat risk 7/10 · Major
- Hot days now (above 104°F)
- 7 days/yr
- Hot days in 30 yrs
- 16 days/yr
Wind risk 1/10 · Minimal
- Chance of severe wind over 30 yrs
- —
Air-quality risk 10/10 · Severe
- Unhealthy air days now
- 33 days/yr
- Unhealthy air days in 30 yrs
- 37 days/yr
Risk factors via First Street. Map © Google.
Why this score? — see what drove the B grade
The composite is a weighted blend of 9 inputs, each scored 0–100. Each bar is that input's sub-score; the figure is the points it added to the 100-point composite (weight × sub-score).
- Cash flow +30.0/30.0
- 1% rule +10.0/10.0
- DSCR +10.0/10.0
- ARV discount +5.7/15.0
- Schools +5.1/10.0
- Livability +3.9/5.0
- Rent growth +2.9/5.0
- Condition / age +2.5/5.0
- Appreciation +0.0/10.0
$164,950
🖨 Deal sheet (PDF) 📄 Offer letter ✓ Due diligence
Listing remarks MLS
On the hunt for an easy-care haven that offers the laid-back lifestyle you've always wanted? Ready for you to move in, unpack, and live the dream, this incredible Roseville home might be exactly what you're searching for! Indulge in the tranquil setting of the Diamond K Estates 55+ community, which grants you access to tons of amenities and social activities. Enticing you inside is a well-maintained facade with lush greenery and vibrant pops of color that lend to the large lot's unique curb appeal. Built in 1985, its single-level floorplan spans 1,344 sq ft with 3 bedrooms, 2 baths, and multiple gathering areas for entertaining or unwinding. With a versatile open-concept design, you can easily transition from one room to another or transform the layout to meet your personal needs. From the covered entry, step into the well-sized proportions of the impressive interior that combines high ceilings and warm white tones. Soft carpet flows underfoot in the living room as multiple windows frame neighborhood views for guests to admire. Sure to delight, a galley-style kitchen with durable tile flooring has all the appliances the home chef needs to whip up favorite meals. There's plenty of white cabinetry for storing your cooking gadgets, and you'll have adequate countertop space for prepping dishes. Ideal for a seamless indoor-outdoor flow, sliding glass doors connect the sunlit dining area to the covered patio, so you can easily host weekend cookouts. Surrounded by mature landscaping, the backyard's also an excellent spot to spend your leisurely afternoons sipping lemonade or relaxing with a good book in hand. Cap off a tiring day in the bedrooms where serene vistas greet you upon waking. Topping them all is the primary suite with a ceiling fan and a large closet. One bath highlights an oversized walk-in shower and a sleek vanity while an additional 3-piece bath offers extra flexibility when you have visitors. Other noteworthy features include an indoor laundry area, an attached 2-car garage, and an electric wheelchair elevator that needs repair. Whenever you want to venture out, take a dip in the nearby community pool, socialize with neighbors in the clubhouse, or maintain an active lifestyle by playing a match on the tennis or pickleball courts. There are also pedestrian trails and a pond you can visit when you want to take in the peaceful setting. Convenience, comfort, and space await you, so why just read about it? Come for a tour before it’s gone for good!
Key facts
- Peninsula for dining
- Double vanity
- Attached garage
Tags
Property features AI
Finance
- Other: Land lease: No (note: a land lease amount was listed but property is indicated as not land-leased)
- HOA & community: No homeowners association; Located in a senior community
Exterior
- Parking: Attached garage; Garage door opener
- Utilities: Public water; Public sewer; 220V outlet in kitchen
- Home design: Manufactured in park (double wide); Silvercrest make and manufacturer; Built in 1985
- Construction: Composition roof; Wood skirting
- Exterior features: Backyard; Front yard with landscaping; Manual sprinkler for front and rear
Interior
- Kitchen: Pantry cabinet; Laminate counters
- Bedrooms: 3 bedrooms
- Bathrooms: 2 full bathrooms; Tub with shower over; Shower stall(s)
- Heating & cooling: Central heating; Central air conditioning; Ceiling fans
- Interior features: Covered deck; Porch; Cathedral/vaulted living room
- Laundry & utility: Indoor laundry room; 220V outlet in laundry
Neighborhood map
What this means for you Summary
Snapshot
- This is a 3-bed/2.0-bath manufactured listed at $165k.
Deal economics
- At list price, monthly cash flow is $1k ($13k/yr) — positive.
- The deal already cash-flows at list — no discount required.
- Meets the 1% rule at list price ($3k rent vs $165k).
- Recommended offer: $162k (1.5% below list) — sets the bar for market timing.
- Cap rate 14.0% vs local median 2.8% in Roseville — top-decile yield for the area; either an underpriced asset or a hidden risk that comps aren't pricing in. Stress-test before assuming the spread holds.
Location & tenants
- Location reads 77/100 on livability (#90 in CA, #3,239 nationally) — a middle-class / working-renter tenant base. Strengths: commute A+, employment A+, housing A+; Watch: cost of living F.
- Roseville Joint Union High (urban): math 42% / reading 71% proficiency, ranked #86 of 517 in CA (top 17%) — acceptable for families but not a draw, mixed tenant base, ~2y average lease.
- Zoned schools: Bradford Woodbridge Fundamental Elementary (288 students, 87% FRL); Robert C. Cooley Middle (800 students, 43% FRL); Roseville High (math 38% / reading 68%, grade C-, #285 of 1,170 statewide, top 25%, 1,617 students, 28% FRL).
- Market conditions: Rents rising (+1.8%/yr); 171 active listings in the ZIP; 15 comparable units currently listed for rent nearby; rentals leasing fast (median 3d on market — plan ~1-2 weeks tenant-placement turnaround); solid renter incomes; 3,535 units permitted in Placer County in 2024 (689 in 5+ unit buildings).
- This rent runs 33% of the median local income ($101k/yr) — at the standard rent-burdened threshold; future hikes will face affordability resistance.
Forward outlook
- Local home prices are declining (-3.0%/yr); year-one equity from $1k of loan paydown is wiped out by about $5k of value loss. Plan a longer hold.
- Placer County population projected at +20% by 2050 — long-run rental-demand tailwind backs the buy-and-hold thesis.
- At projected returns (-3.0% appreciation + 1.8% rent growth), your $46k cash investment doubles in ~5 years — after that, you're playing with house money.
Negotiation context
- It's been on market 23 days — a 2% lower offer ($162k) is reasonable based on typical stale-listing flexibility.
Risks & watch-outs
- Climate carrying-cost: moderate wildfire risk; extreme-heat days projected 7→16/yr by 2055 (HVAC capex compounding) — expect insurance premiums to compound above CPI over the hold.
Questions for the listing agent
- Is there a deadline driving the sale (1031 exchange, divorce, estate, relocation)? That informs how much negotiation room exists.
- Schools are B-rated — typically a magnet for longer-tenancy family renters. What's the average tenant stay here, and is there a school-zone premium baked into asking?
- What's the average days-on-market for RENTAL listings here right now (not sales)? A rising rental-DOM trend means longer vacancies and softer asking-rent achievability than the comps imply.
- What's the recent tenant-quality profile in this submarket — average credit score on applications, eviction rate, late-payment / NSF rate, and stable-employment percentage? A property-management company in the area should have these aggregated.
- How much new for-sale + rental construction is in the pipeline within 1–3 miles? Heavy new supply typically softens prices + rents 12–24 months out; constrained supply supports both.
Investment metrics
- 1% rule
- 1.69% ✓
- Cap rate
- 13.98%
- Cash-on-cash
- 27.45%
- DSCR
- 2.22
- GRM
- 4.9
CMA / ARV
- ARV (on-the-fly)
- $158,592
- Comps found
- 12
Show comp detail 12 sales within ~0.75 mi
| Address | Dist | Beds/Ba | Sqft | Sold | Price | $/sf | Match |
|---|---|---|---|---|---|---|---|
| 102 Richards Dr | 0.16mi | 2/2.0 (-1) | 1,352 (+1%) | 8mo | $143,900 | $106 | 80 |
| 240 Lafayette | 0.07mi | 2/2.0 (-1) | 1,440 (+7%) | 2mo | $135,000 | $94 | 78 |
| 70 Hancock Dr | 0.14mi | 3/2.0 | 1,404 (+4%) | 11mo | $165,000 | $118 | 77 |
| 154 Brunswick | 0.23mi | 3/2.0 | 1,440 (+7%) | 2mo | $190,000 | $132 | 76 |
| 350 Hendricks Way | 0.37mi | 2/2.0 (-1) | 1,344 (0%) | 8mo | $156,000 | $116 | 71 |
| 296 Lafayette Dr | 0.41mi | 2/2.0 (-1) | 1,368 (+2%) | 3mo | $165,000 | $121 | 71 |
| 293 Lafayette Dr | 0.39mi | 2/2.0 (-1) | 1,368 (+2%) | 7mo | $172,500 | $126 | 68 |
| 126 Kaseberg Dr | 0.10mi | 2/2.0 (-1) | 1,152 (-14%) | 1mo | $173,000 | $150 | 66 |
| 173 Livingston | 0.30mi | 2/2.0 (-1) | 1,440 (+7%) | 10mo | $120,000 | $83 | 61 |
| 49 Hancock Dr | 0.11mi | 2/2.0 (-1) | 1,152 (-14%) | 6mo | $85,000 | $74 | 61 |
| 322 Kaseberg Dr | 0.38mi | 2/2.0 (-1) | 1,440 (+7%) | 8mo | $169,900 | $118 | 59 |
| 284 Lafayette | 0.32mi | 2/2.0 (-1) | 1,176 (-12%) | 2mo | $129,000 | $110 | 58 |
Match score weights: distance 35% · size 25% · config 20% · recency 20%. Top-matched comps best support the ARV.
Projected returns pro-forma
-3.0% appreciation · 1.75% rent growth · sell at horizon
- IRR
- 20.1%
- Equity multiple
- 1.80×
- Total profit
- $37,156
- Equity at exit
- $24,595
- IRR
- 27.5%
- Equity multiple
- 3.28×
- Total profit
- $105,360
- Equity at exit
- $14,262
Cash invested: $46,186 (down + closing). Projections, not guarantees.
Landlord ↔ Tenant lean methodology
- Overall (STATE)
- 18 Strongly Tenant-Friendly
- State California
- 18 Strongly Tenant-Friendly · D+13
- County
- — inherits STATE
- City
- — inherits STATE
ZIP-level market 95678
- Rents YoY
- 1.8%
- Active inventory
- 171
- Price-to-rent
- 4.9×
Monthly cashflow live
- Estimated rent
- $2,780 high interval (Pro) →
- Mortgage (P&I)
- −$865
- Tax est. 1.5%
- −$206 /mo · $2,474/yr
- Insurance
- −$69
- HOA
- −$0
- Vacancy / Maint / Mgmt
- −$584
- Net cashflow
- $1,057
Break-even live
Sensitivity live
| Price | -10% $1,171 | -5% $1,114 | +0% $1,057 | +5% $1,000 | +10% $943 |
|---|---|---|---|---|---|
| Rent | -10% $837 | -5% $947 | +0% $1,057 | +5% $1,166 | +10% $1,276 |
| Rate | -1.0pp $1,140 | -0.5pp $1,099 | base $1,057 | +0.5pp $1,014 | +1.0pp $970 |
UW: 25.0% down · 7.5% · 30yr · 1.5% tax · 5.0% vac · 8.0% maint · 8.0% mgmt
Financing live
Cash to close
- Down payment
- $41,238
- Closing costs
- $4,948
- Reserves months
- —
- Total cash needed
- —
Loan-product check · same deal, 3 products live
Conventional
25% down · 7.5% · 30yr
- Down + closing
- —
- Monthly P&I
- —
- Monthly cashflow
- —
- DSCR
- —
- Eligible?
- —
Personal DTI + credit; lowest rate.
DSCR
20% down · 8.5% · 30yr
- Down + closing
- —
- Monthly P&I
- —
- Monthly cashflow
- —
- DSCR
- —
- Eligible?
- —
No personal income docs; deal must DSCR.
Hard money
10% down · 12.0% · 12mo
- Down + closing
- —
- Monthly P&I
- —
- Monthly cashflow
- —
- DSCR
- —
- Eligible?
- —
Short-term bridge; refi at stabilization.
Rent comps 15 comps
| Address | Beds | Baths | Sqft | Rent | $/sqft | DOM | Units | Dist |
|---|---|---|---|---|---|---|---|---|
| 1243 S Bluff Dr Roseville, CA | 3.0 | 2.0 | 1433 | $2,795 | $1.95 | 23d | 1 | 0.26mi |
| 5 Marcia Way Roseville, CA | 2.0–3.0 | 1.0–2.0 | 939 | $2,426 | $2.58 | 3d | 3 | 0.44mi |
| 317 Aspen Ct Roseville, CA | 3.0 | 2.0 | 1744 | $3,200 | $1.83 | 3d | 1 | 0.46mi |
| 700 Vallejo Ave Roseville, CA | 1.0–2.0 | 1.0–2.0 | 930 | $2,345 | $2.52 | 0d | 6 | 0.61mi |
| 512 Adora Cir Roseville, CA | 2.0 | 3.0 | 1225 | $3,387 | $2.76 | 6d | 1 | 0.65mi |
| 413 Adora Cir Roseville, CA | 1.0–2.0 | 1.0–2.5 | 985 | $2,885 | $2.93 | 0d | 3 | 0.66mi |
| 1317 Rice Ln Roseville, CA | 3.0 | 2.0 | 1442 | $2,395 | $1.66 | 3d | 1 | 0.66mi |
| 604 Hovey Way Roseville, CA | 3.0 | 2.0 | 1169 | $2,695 | $2.31 | 3d | 1 | 0.67mi |
| 248 Summer Grove Cir Roseville, CA | 3.0 | 2.0 | 1160 | $2,695 | $2.32 | 3d | 1 | 0.94mi |
| 1422 Lorimer Way Roseville, CA | 4.0 | 2.0 | 1650 | $2,795 | $1.69 | 3d | 1 | 0.94mi |
| 637 Shelby Ranch Ln Roseville, CA | 3.0 | 2.0 | 1241 | $2,700 | $2.18 | 23d | 1 | 1.06mi |
| 1057 Shenencock Way Roseville, CA | 3.0 | 2.0 | 1406 | $2,795 | $1.99 | 3d | 1 | 1.29mi |
| 1006 Circuit Dr Unit B-1 Roseville, CA | 2.0 | 1.0 | 900 | $1,395 | $1.55 | 9d | 1 | 1.41mi |
| 189 Hickory St Roseville, CA | 3.0 | 2.5 | 1525 | $2,995 | $1.96 | 0d | 1 | 1.47mi |
| 1218 Chablis Cir Roseville, CA | 3.0 | 2.0 | 1438 | $2,495 | $1.74 | 0d | 1 | 1.48mi |
Listing history 15 events
-
2026-06-21days on market $164,950 Active 23 DOM
-
2026-06-18days on market $164,950 Active 20 DOM
-
2026-06-17days on market $164,950 Active 19 DOM
-
2026-06-16days on market $164,950 Active 18 DOM
-
2026-06-15days on market $164,950 Active 17 DOM
-
2026-06-13pricedays on market $164,950 Active 15 DOM
-
2026-06-13pricedays on market $169,950 Active 14 DOM
-
2026-06-09days on market $174,950 Active 11 DOM
-
2026-06-08days on market $174,950 Active 10 DOM
-
2026-06-07days on market $174,950 Active 9 DOM
-
2026-06-05days on market $174,950 Active 6 DOM
-
2026-06-03days on market $174,950 Active 5 DOM
-
2026-06-02days on market $174,950 Active 4 DOM
-
2026-06-01days on market $174,950 Active 3 DOM
-
2026-05-31days on market $174,950 Active 2 DOM
ⓘ Source: listings_history table (triggers on properties + properties_extension) + one-shot
backfill from property_details.listing_events for pre-trigger history.
Climate risk First Street
- Flood 1/10 Low FEMA zone X (unshaded) · 0% chance over 30 yrs
- Wildfire 5/10 Major
- Heat 7/10 Severe 7 d/yr ≥104°F today · 16 d/yr by 30 yrs out
- Wind 1/10 Low
- Air quality 10/10 Extreme 33 unhealthy d/yr today · 37 by 30 yrs out
Nearby sold comps map
Loading sold comps map…
Walkable amenities ~0.75 mi
Loading nearby amenities…
Taxation est. · year 1
- Rental income
- $33,366
- − Mortgage interest
- −$9,240
- − Property taxes
- −$2,474
- − Insurance
- −$825
- − Repairs & maintenance
- −$2,669
- − Management
- −$2,669
- − Depreciation
- −$4,799
- Taxable income
- $10,690
- Est. tax owed @ 24.0%
- −$2,566
- After-tax cash flow
- $10,114/yr
For passive investors: Depreciation is non-cash, so a rental often shows a tax loss while cash-flowing — sheltering income. Rental losses are passive: they offset passive income freely, and up to $25,000/yr can offset ordinary (W-2) income if you actively participate and your MAGI is under $100k (phasing out to $0 by $150k); unused losses carry forward. On sale, claimed depreciation is recaptured at up to 25%, and gains may owe capital-gains tax (a 1031 exchange can defer both). Figures are a year-1 estimate at your 24.0% rate — not tax advice; consult a CPA.
Schools (NCES district)
- District
- Roseville Joint Union High
- NCES district ID
- 0633630
- Math proficiency
- 42% ▼ -6.00%
- Reading proficiency
- 71% ▼ -3.00%
- Median HH income
- $81,930
- Composite
- 51.11/100
- National rank
- #1763
- State rank
- #86 of 517 in CA
Livability — Roseville
- Score
- 77/100
- State rank
- #90
- US rank
- #3239
Category grades
Schools grade is shown separately in the Schools card above.
Census & demographics
- Census place
- Roseville, CA
- County
- Placer County · 390,510 people
- City population
- 161,837
- Metro
- Sacramento-Roseville-Folsom, CA
- Population (ZIP)
- 45,346
- Household income
- $100,554
- Rent vs Own
- Severe rent burden
- 2544.0
Population outlook (Placer County) Hauer SSP2
- Today (2025)
- 422,709 people
- By 2030
- 444,249 · +5.1%
- By 2040
- 480,192 · +13.6%
- By 2050
- 506,390 · +19.8%
- By 2075
- 550,219 · +30.2%
- By 2100
- 547,760 · +29.6%
Race, ethnicity, and origin ACS 2023
- Neighborhood character
- Diverse neighborhood (Simpson 0.58)
- Race & ethnicity
- White 60% Hispanic / Latino 23% Two or more races 17% Asian 8% Black 2%
- Hispanic origin (detail)
- Mexican 16% Puerto Rican 1%
- Common ancestry
- Russian 3% Slovak 2% Italian 2%
- Foreign-born
- 14% · Canada, China, South Korea
- Languages at home
- 79% English-only · Spanish 10% Other Indo-European 4% Russian/Polish/Slavic 2%
Political lean MEDSL · Placer
- 2024 margin
- Lean R (+8.5) · D 44.3% · R 52.8% · Other 2.9%
- 2008→2024 swing
- +2.8pp toward D · 2008: -11.3pp · 2024: -8.5pp
- All cycles
- 2024: R+8.5 2020: R+6.7 2016: R+11.3 2012: R+20.1 2008: R+11.3
Not yet ingested
- Civics
- —
Market trends
- HPI YoY
- ▼ -418.46%
- Current HPI
- 272.0182
- Rent YoY
- ▲ 1.75%
- Metro
- Sacramento-Roseville-Folsom, CA
- State GDP YoY
- ▲ 3.21%
- F500 in state
- 116
Industry mix (Fortune 500 HQ in CA)
| Industry | F500 HQs | Revenue |
|---|---|---|
| Technology | 27 | $1,492B |
|
||
| Financial Services | 3 | $174B |
|
||
| Retail | 3 | $44B |
|
||
| Insurance | 3 | $26B |
|
||
| Media / Entertainment | 2 | $115B |
|
||
| Pharmaceuticals / Biotech | 2 | $62B |
|
||
Price history
-16.7% since first listed5 events — show timeline
- 2023-06-09 Sold (MLS) $149,900 CRMLS
- 2023-04-28 Contingent — CRMLS
- 2023-01-31 Price Changed $159,900 CRMLS
- 2022-12-22 Price Changed $169,900 CRMLS
- 2022-10-25 Listed $179,900 CRMLS
Cash-flow waterfall
monthlySold comps — $/sqft
last 12 mo · ≤1 miLoading sold comps…