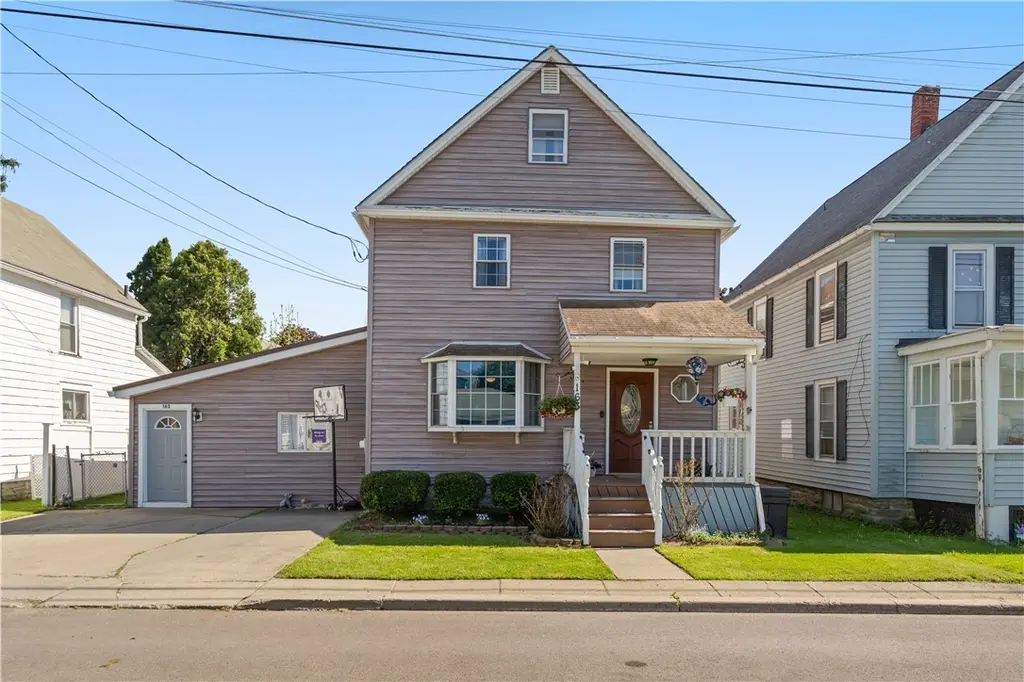
163 Leach Ave · Hornell, NY
Flood risk 1/10 · Minimal
- FEMA flood zone
- X (shaded)
- Chance of flooding over 30 yrs
- 0.0%
- Est. flood insurance / yr
- $473 – $860
Fire risk 3/10 · Minor
- Est. fire insurance / yr
- $691 – $1,283
Heat risk 3/10 · Minor
- Hot days now (above 92°F)
- 8 days/yr
- Hot days in 30 yrs
- 18 days/yr
Wind risk 1/10 · Minimal
- Chance of severe wind over 30 yrs
- —
Air-quality risk 1/10 · Minimal
- Unhealthy air days now
- 0 days/yr
- Unhealthy air days in 30 yrs
- 0 days/yr
Risk factors via First Street. Map © Google.
Why this score? — see what drove the C grade
The composite is a weighted blend of 9 inputs, each scored 0–100. Each bar is that input's sub-score; the figure is the points it added to the 100-point composite (weight × sub-score).
- Cash flow +20.1/30.0
- ARV discount +7.0/15.0
- Appreciation +7.0/10.0
- DSCR +6.4/10.0
- 1% rule +4.9/10.0
- Livability +3.5/5.0
- Schools +3.4/10.0
- Rent growth +2.5/5.0
- Condition / age +2.5/5.0
$174,900
🖨 Deal sheet 📄 Offer letter ✓ Due diligence
Listing remarks
Four bedrooms with a BIG Primary Suite on the main floor!! Large closet, full en suite bath, and a glass-panel door to the back deck. There is a second full bath and 3 bedrooms on the second floor. The mechanics are in great shape. .. . 4-year-old furnace, 4-year-old Central AC, 40-gallon water tank, 6 or 7 years, and roof 12-13 years. The kitchen has lots of cabinetry and Corian countertops. There is a breakfast bar with a large window pass-through to the dining area. This over 2200 sq ft home has a formal living room and a family room. Staying with the property are two sets of W/ D!!! One set on the main floor and one on the second floor. There are doors from the family room to the cut
Key facts
- Glass-panel door
- Full en suite bath
- Primary suite
Tags
Property features AI
Exterior
- Parking: No garage; Driveway parking
- Utilities: Public water; Sewer connected; Cable available; High-speed internet available
- Home design: Two-story house; Existing construction; Rectangular residential lot; City street frontage
- Construction: Vinyl siding; Blown-in insulation; Stone foundation
- Exterior features: Concrete driveway; Deck; Patio; Fully fenced yard; Shed(s) / storage
Interior
- Kitchen: Dishwasher; Electric oven; Electric range; Free-standing range; Disposal; Microwave; Oven; Refrigerator; Pantry; Breakfast bar; Eat-in kitchen
- Bedrooms: One main-level bedroom
- Flooring: Laminate; Vinyl; Varied flooring types
- Bathrooms: Two full bathrooms; One main-level bathroom
- Heating & cooling: Forced-air gas heating; Central air conditioning; Has heating and cooling
- Interior features: Breakfast bar; Eat-in kitchen; Separate formal living room; Pantry; Primary bedroom with private bath; Primary bedroom on main level; Full basement
- Laundry & utility: Washer; Dryer; Laundry on main level; Laundry on upper level; Gas water heater
Neighborhood map
What this means for you Summary
Snapshot
- This is a 3-bed/1.5-bath single-family listed at $175k.
Deal economics
- At list price, monthly cash flow is $217 ($3k/yr) — positive.
- The deal already cash-flows at list — no discount required.
- To meet the 1% rule (rent ≥ 1% of price), the offer needs to be $174k (0.5% below list).
- Recommended offer: $172k (1.5% below list) — sets the bar for market timing.
- Cap rate 7.8% vs local median 13.3% in Hornell — below-typical yield; the buyer is paying a premium for something (appreciation thesis, condition, location) that the cap rate doesn't capture.
Location & tenants
- Location reads 70/100 on livability (#451 in NY) — a middle-class / working-renter tenant base. Strengths: cost of living A+, housing A+, health & safety A+; Watch: amenities C-, schools D, crime F.
- Hornell City School District (town): math 33% / reading 49% proficiency, ranked #519 of 590 in NY (top 88%) — families likely to look elsewhere, expect single-tenant / working-renter base with shorter leases.
- Market conditions: 59 active listings in the ZIP; 5 comparable units currently listed for rent nearby; rentals lingering (median 44d on market — plan ~5-8 weeks vacancy on turnover, expect pricing pressure); 100% of comp listings sitting > 30 days — soft ceiling on asking rent; 196 units permitted in Steuben County in 2024 (0 in 5+ unit buildings).
- This rent runs 36% of the median local income ($58k/yr) — at the standard rent-burdened threshold; future hikes will face affordability resistance.
Forward outlook
- In year one you build about $8k of equity ($1k loan paydown + $7k appreciation (4.0% local appreciation)).
- Steuben County population projected at -20% by 2050 — secular population decline; favor cash flow + early exit over multi-decade hold.
- At projected returns (4.0% appreciation + 3.0% rent growth), your $49k cash investment doubles in ~5 years — after that, you're playing with house money.
- By year 5, paydown + projected appreciation supports a ~$35k cash-out refi (75% LTV) — recoverable capital for the next deal without selling this one.
Negotiation context
- It's been on market 23 days — a 2% lower offer ($172k) is reasonable based on typical stale-listing flexibility.
Risks & watch-outs
- Watch-outs: built in 1900 — expect roof / HVAC / electrical / plumbing capex.
Questions for the listing agent
- Built in 1900 — when were the roof, HVAC, electrical panel, plumbing, and water heater last replaced?
- Is there a deadline driving the sale (1031 exchange, divorce, estate, relocation)? That informs how much negotiation room exists.
- Schools are D-rated, which usually means shorter tenancies and higher turnover. Who's the typical renter profile here, and what's been the actual vacancy rate?
- Crime grade is F in this area — have there been break-ins, vandalism, or insurance claims at this property in the last 3 years? What carrier currently insures it and at what premium?
- What's the average days-on-market for RENTAL listings here right now (not sales)? A rising rental-DOM trend means longer vacancies and softer asking-rent achievability than the comps imply.
- What's the recent tenant-quality profile in this submarket — average credit score on applications, eviction rate, late-payment / NSF rate, and stable-employment percentage? A property-management company in the area should have these aggregated.
- How much new for-sale + rental construction is in the pipeline within 1–3 miles? Heavy new supply typically softens prices + rents 12–24 months out; constrained supply supports both.
Investment metrics
- 1% rule
- 0.99% ✗
- Cap rate
- 7.78%
- Cash-on-cash
- 5.31%
- DSCR
- 1.24
- GRM
- 8.4
CMA / ARV
- ARV (on-the-fly)
- $172,824
- Comps found
- 12
Show comp detail 12 sales within ~0.75 mi
| Address | Dist | Beds/Ba | Sqft | Sold | Price | $/sf | Match |
|---|---|---|---|---|---|---|---|
| 106 East Ave | 0.14mi | 3/2.5 | 2,472 (+9%) | 8mo | $190,000 | $77 | 68 |
| 113 River St | 0.21mi | 2/2.0 (-1) | 2,447 (+8%) | 9mo | $140,000 | $57 | 63 |
| 45 Jane St | 0.38mi | 4/2.5 (+1) | 2,212 (-3%) | 7mo | $185,000 | $84 | 63 |
| 27 Glen Ave | 0.20mi | 3/1.5 | 2,052 (-10%) | 16mo | $172,500 | $84 | 61 |
| 151 Canisteo Ave | 0.18mi | 3/2.0 | 1,972 (-13%) | 10mo | $130,000 | $66 | 59 |
| 11 Conklin St | 0.42mi | 3/2.5 | 2,134 (-6%) | 20mo | $206,000 | $97 | 50 |
| 33 E Vanscoter St | 0.53mi | 3/2.0 | 2,002 (-12%) | 10mo | $73,000 | $36 | 45 |
| 114 Genesee St | 0.49mi | 4/1.0 (+1) | 2,054 (-10%) | 18mo | $65,000 | $32 | 39 |
| 41 Davenport St | 0.41mi | 4/2.5 (+1) | 2,516 (+11%) | 18mo | $135,000 | $54 | 39 |
| 56 Sawyer St | 0.66mi | 3/2.0 | 1,960 (-14%) | 11mo | $149,900 | $76 | 35 |
| 384 Canisteo St | 0.58mi | 4/2.0 (+1) | 1,962 (-14%) | 13mo | $172,000 | $88 | 32 |
| 48 Crosby St | 0.75mi | 4/2.0 (+1) | 2,135 (-6%) | 19mo | $148,000 | $69 | 32 |
Match score weights: distance 35% · size 25% · config 20% · recency 20%. Top-matched comps best support the ARV.
Projected returns pro-forma
3.95% appreciation · 3.0% rent growth · sell at horizon
- IRR
- 14.9%
- Equity multiple
- 1.89×
- Total profit
- $43,807
- Equity at exit
- $88,144
- IRR
- 16.0%
- Equity multiple
- 3.57×
- Total profit
- $126,011
- Equity at exit
- $143,742
Cash invested: $48,972 (down + closing). Projections, not guarantees.
Landlord ↔ Tenant lean methodology
- Overall (STATE)
- 15 Strongly Tenant-Friendly
- State New York
- 15 Strongly Tenant-Friendly · D+10
- County
- — inherits STATE
- City
- — inherits STATE
ZIP-level market 14843
- Home prices YoY
- 1.9%
- Active inventory
- 59
- Price-to-rent
- 8.4×
Monthly cashflow live
- Estimated rent
- $1,740 high interval (Pro) →
- Mortgage (P&I)
- −$917
- Tax from tax record
- −$168 /mo · $2,013/yr
- Insurance
- −$73
- HOA
- −$0
- Vacancy / Maint / Mgmt
- −$365
- Net cashflow
- $217
Break-even live
UW: 25.0% down · 7.5% · 30yr · 1.5% tax · 5.0% vac · 8.0% maint · 8.0% mgmt
Financing live
Cash to close
- Down payment
- $43,725
- Closing costs
- $5,247
- Reserves months
- —
- Total cash needed
- —
Loan-product check · same deal, 3 products live
Conventional
25% down · 7.5% · 30yr
- Down + closing
- —
- Monthly P&I
- —
- Monthly cashflow
- —
- DSCR
- —
- Eligible?
- —
Personal DTI + credit; lowest rate.
DSCR
20% down · 8.5% · 30yr
- Down + closing
- —
- Monthly P&I
- —
- Monthly cashflow
- —
- DSCR
- —
- Eligible?
- —
No personal income docs; deal must DSCR.
Hard money
10% down · 12.0% · 12mo
- Down + closing
- —
- Monthly P&I
- —
- Monthly cashflow
- —
- DSCR
- —
- Eligible?
- —
Short-term bridge; refi at stabilization.
Rent comps 5 comps
| Address | Beds | Baths | Sqft | Rent | $/sqft | DOM | Units | Dist |
|---|---|---|---|---|---|---|---|---|
| 58 Elm St Hornell, NY | 4.0 | 2.0 | 1600 | $2,495 | $1.56 | 43d | 1 | 0.41mi |
| 15 Hakes Ave Unit 102 Hornell, NY | 4.0 | 2.0 | 2000 | $2,195 | $1.10 | 43d | 1 | 0.60mi |
| 54 Bemis Ave Hornell, NY | 2.0 | 1.0 | 1801 | $1,300 | $0.72 | 43d | 1 | 0.69mi |
| 14 Willow Pl Hornell, NY | 4.0 | 2.0 | 1726 | $2,000 | $1.16 | 43d | 1 | 0.89mi |
| 21 Armory Pl Hornell, NY | 2.0 | 1.0 | 2074 | $1,200 | $0.58 | 43d | 1 | 1.03mi |
Listing history 18 events
-
2026-06-19days on market $174,900 Active 23 DOM
-
2026-06-18days on market $174,900 Active 22 DOM
-
2026-06-17days on market $174,900 Active 21 DOM
-
2026-06-16days on market $174,900 Active 20 DOM
-
2026-06-15days on market $174,900 Active 19 DOM
-
2026-06-14days on market $174,900 Active 17 DOM
-
2026-06-12days on market $174,900 Active 16 DOM
-
2026-06-09days on market $174,900 Active 13 DOM
-
2026-06-09price $174,900 Active 12 DOM
-
2026-06-08days on market $192,000 Active 12 DOM
-
2026-06-07days on market $192,000 Active 11 DOM
-
2026-06-07days on market $192,000 Active 10 DOM
-
2026-06-03days on market $192,000 Active 7 DOM
-
2026-06-02days on market $192,000 Active 6 DOM
-
2026-06-01days on market $192,000 Active 5 DOM
-
2026-05-31days on market $192,000 Active 4 DOM
-
2026-05-30days on market $192,000 Active 3 DOM
-
2026-05-27$192,000 Active
ⓘ Source: listings_history table (triggers on properties + properties_extension) + one-shot
backfill from property_details.listing_events for pre-trigger history.
Tax reassessment forecast NY · Partial reset (capped growth)
- Current annual tax
- $2,013 · $168/mo
- Projected year-2 tax
- $2,484 · $207/mo
- Expected delta
- +$471/yr (+$39/mo · 23.4%)
ⓘ Screening estimate from a state-policy table — verify with the county assessor before closing.
Climate risk First Street
- Flood 1/10 Low FEMA zone X (shaded) · 0% chance over 30 yrs
- Wildfire 3/10 Moderate
- Heat 3/10 Moderate 8 d/yr ≥92°F today · 18 d/yr by 30 yrs out
- Wind 1/10 Low
- Air quality 1/10 Low 0 unhealthy d/yr today · 0 by 30 yrs out
Nearby sold comps map
Loading sold comps map…
Walkable amenities ~0.75 mi
Loading nearby amenities…
Taxation est. · year 1
- Rental income
- $20,881
- − Mortgage interest
- −$9,797
- − Property taxes
- −$2,013
- − Insurance
- −$874
- − Repairs & maintenance
- −$1,670
- − Management
- −$1,670
- − Depreciation
- −$5,088
- Taxable loss
- −$232
- Est. tax savings @ 24.0%
- +$56
- After-tax cash flow
- $2,658/yr
For passive investors: Depreciation is non-cash, so a rental often shows a tax loss while cash-flowing — sheltering income. Rental losses are passive: they offset passive income freely, and up to $25,000/yr can offset ordinary (W-2) income if you actively participate and your MAGI is under $100k (phasing out to $0 by $150k); unused losses carry forward. On sale, claimed depreciation is recaptured at up to 25%, and gains may owe capital-gains tax (a 1031 exchange can defer both). Figures are a year-1 estimate at your 24.0% rate — not tax advice; consult a CPA.
Schools (NCES district)
- District
- Hornell City School District
- NCES district ID
- 3614820
- Math proficiency
- 33% ▼ -8.00%
- Reading proficiency
- 49% ▲ 6.00%
- Median HH income
- $40,251
- Composite
- 34.33/100
- National rank
- #5234
- State rank
- #519 of 590 in NY
Livability — Hornell
- Score
- 70/100
- State rank
- #451
- US rank
- #7888
Category grades
Schools grade is shown separately in the Schools card above.
Census & demographics
- Census place
- Hornell, NY
- County
- Steuben County · 41,193 people
- City population
- 12,383
- Metro
- Corning, NY
- Population (ZIP)
- 12,383
- Household income
- $57,874
- Rent vs Own
- Severe rent burden
- 415.0
Population outlook (Steuben County) Hauer SSP2
- Today (2025)
- 93,062 people
- By 2030
- 89,793 · -3.5%
- By 2040
- 82,353 · -11.5%
- By 2050
- 74,286 · -20.2%
- By 2075
- 55,589 · -40.3%
- By 2100
- 37,587 · -59.6%
Race, ethnicity, and origin ACS 2023
- Neighborhood character
- Predominantly White (92%)
- Race & ethnicity
- White 92% Two or more races 3% Hispanic / Latino 3% Black 2%
- Common ancestry
- Lithuanian 3% Romanian 2% Iranian 2%
- Foreign-born
- 4% · Canada
- Languages at home
- 95% English-only · French/Haitian/Cajun 2% Arabic 1% Spanish 1%
Political lean MEDSL · Steuben
- 2024 margin
- Solid R (+31.8) · D 34.1% · R 65.9%
- 2008→2024 swing
- -15.0pp toward R · 2008: -16.8pp · 2024: -31.8pp
- All cycles
- 2024: R+31.8 2020: R+29.6 2016: R+36.2 2012: R+16.4 2008: R+16.8
Not yet ingested
- Civics
- —
Market trends
- HPI YoY
- ▲ 3.95%
- Current HPI
- 210.1986
- Rent YoY
- —
- Metro
- Corning, NY
- State GDP YoY
- ▲ 2.60%
- F500 in state
- 92
Industry mix (Fortune 500 HQ in NY)
| Industry | F500 HQs | Revenue |
|---|---|---|
| Financial Services | 10 | $950B |
|
||
| Consumer Goods | 9 | $162B |
|
||
| Insurance | 4 | $225B |
|
||
| Telecommunications | 2 | $144B |
|
||
| Pharmaceuticals | 2 | $112B |
|
||
| Media / Entertainment | 2 | $69B |
|
||
Price history
1 event — show timeline
- 2026-05-27 Listed $192,000 UNYREIS
Property tax history
+0.9%/yrLatest (2025): $2,013 · -0.4% YoY. Source: county tax records.
Cash-flow waterfall
monthlySold comps — $/sqft
last 12 mo · ≤1 miLoading sold comps…