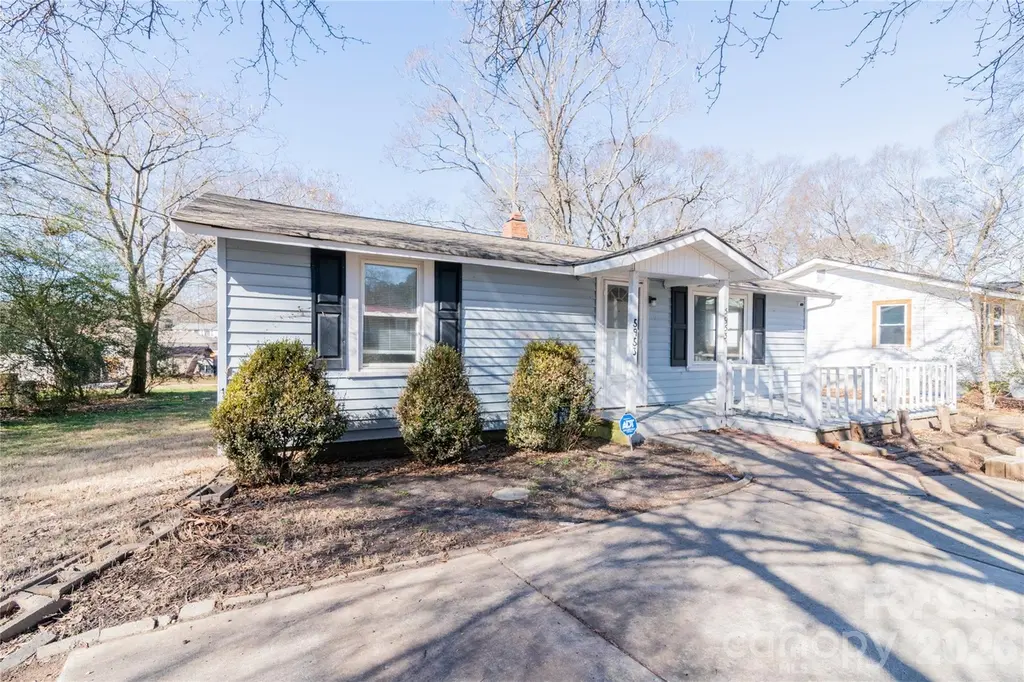
5953 Yale Ave · Kannapolis, NC
Flood risk 1/10 · Minimal
- FEMA flood zone
- X (unshaded)
- Chance of flooding over 30 yrs
- 0.0%
- Est. flood insurance / yr
- $507 – $1,088
Fire risk 3/10 · Minor
- Est. fire insurance / yr
- $906 – $1,684
Heat risk 5/10 · Moderate
- Hot days now (above 104°F)
- 7 days/yr
- Hot days in 30 yrs
- 17 days/yr
Wind risk 4/10 · Minor
- Chance of severe wind over 30 yrs
- 15.0%
Air-quality risk 3/10 · Minor
- Unhealthy air days now
- 3 days/yr
- Unhealthy air days in 30 yrs
- 4 days/yr
Risk factors via First Street. Map © Google.
Why this score? — see what drove the D+ grade
The composite is a weighted blend of 9 inputs, each scored 0–100. Each bar is that input's sub-score; the figure is the points it added to the 100-point composite (weight × sub-score).
- Cash flow +17.5/30.0
- ARV discount +7.5/15.0
- DSCR +5.5/10.0
- 1% rule +3.7/10.0
- Livability +3.2/5.0
- Rent growth +3.1/5.0
- Schools +2.6/10.0
- Condition / age +2.5/5.0
- Appreciation +0.0/10.0
$180,000
🖨 Deal sheet (PDF) 📄 Offer letter ✓ Due diligence
Listing remarks MLS
Cute! Recently remodeled in 2021 with new paint, LVP throughout, kitchen countertops and beautifully tiled custom shower. Great starter home or investment property. Located only 9 minutes from the newly revitalized downtown Kannapolis on a quiet street with great dining experience and the Cannon Ballers Stadium. Schedule your showing today before it's too late!
Key facts
- 0.28 acre lot
- Built 1900
- Listed 79 days
Property features AI
Finance
- Other: Property zoned LDR (low density residential)
- HOA & community: No HOA
Exterior
- Parking: Driveway
- Utilities: City water; Septic system installed; Electricity connected
- Home design: Single-family residence; One story; Site-built construction
- Construction: Vinyl exterior; Crawl space foundation
- Exterior features: Front porch; Shed(s) on the property; Roads are concrete, gravel, and paved; Publicly maintained road
Interior
- Kitchen: Electric range; Refrigerator
- Bedrooms: 2 bedrooms, both on the main level
- Flooring: Vinyl flooring
- Bathrooms: 1 full bathroom on the main level
- Heating & cooling: Electric heating; Heat pump; Central air conditioning
- Interior features: 4 total rooms; No additional interior features listed
- Laundry & utility: Washer hookup in kitchen; Electric dryer hookup
Neighborhood map
What this means for you Summary
Snapshot
- This is a 2-bed/1.0-bath single-family listed at $180k.
Deal economics
- At list price, monthly cash flow is $137 ($2k/yr) — positive.
- The deal already cash-flows at list — no discount required.
- To meet the 1% rule (rent ≥ 1% of price), the offer needs to be $156k (13.2% below list).
- Recommended offer: $156k (13.2% below list) — sets the bar for 1% rule.
- Cap rate 7.2% vs local median 3.5% in Kannapolis — top-decile yield for the area; either an underpriced asset or a hidden risk that comps aren't pricing in. Stress-test before assuming the spread holds.
Location & tenants
- Location reads 64/100 on livability (#354 in NC) — a middle-class / working-renter tenant base. Strengths: cost of living A+, housing A+, crime B; Watch: employment D+, amenities F, commute F.
- Kannapolis City Schools (suburban): math 30% / reading 33% proficiency, ranked #141 of 178 in NC (top 79%) — families likely to look elsewhere, expect single-tenant / working-renter base with shorter leases; 63% free/reduced lunch — lower-income household profile, screen leases tightly.
- Zoned schools: Fred L Wilson Elementary (math 37% / reading 32%, grade F, #835 of 1,410 statewide, top 62%, 463 students, 99% FRL); Kannapolis Middle (math 30% / reading 35%, grade F, #312 of 475 statewide, top 66%, 1,238 students, 100% FRL); A L Brown High (math 25% / reading 30%, grade F, #467 of 535 statewide, top 87%, 1,741 students, 100% FRL) — zoned schools average 100% FRL vs 63% district-wide (36 pts higher); higher-poverty schools than district average — tighter screening recommended.
- Market conditions: Rents rising (+2.5%/yr); 226 active listings in the ZIP; 2 comparable units currently listed for rent nearby; 2,485 units permitted in Cabarrus County in 2024 (677 in 5+ unit buildings).
Forward outlook
- Local home prices are declining (-3.0%/yr); year-one equity from $1k of loan paydown is wiped out by about $5k of value loss. Plan a longer hold.
- Cabarrus County population projected at +44% by 2050 — long-run rental-demand tailwind backs the buy-and-hold thesis.
Negotiation context
- It's been on market 79 days — a 6% lower offer ($169k) is reasonable based on typical stale-listing flexibility.
- 2 sale attempts since 5y ago; this cycle's ask has dropped $20k (10%) from the opening price — seller is motivated, your offer sets the floor, not the list.
- Current owner paid $125k; 44% above their basis — modest negotiation headroom, anchor on the comps not their cost.
Risks & watch-outs
- Watch-outs: built in 1900 — expect roof / HVAC / electrical / plumbing capex.
- Climate carrying-cost: extreme-heat days projected 7→17/yr by 2055 (HVAC capex compounding) — expect insurance premiums to compound above CPI over the hold.
Questions for the listing agent
- It's been on market 79 days. Have you received any prior offers? Is the seller open to a 13% concession, seller financing, or rate buy-down credit?
- Built in 1900 — when were the roof, HVAC, electrical panel, plumbing, and water heater last replaced?
- Why hasn't it sold? Are there any deal-killer items the seller is aware of (foundation, flood, title, zoning, code violations)?
- Is there a deadline driving the sale (1031 exchange, divorce, estate, relocation)? That informs how much negotiation room exists.
- Schools are F-rated, which usually means shorter tenancies and higher turnover. Who's the typical renter profile here, and what's been the actual vacancy rate?
- The area grade is low — what's the realistic commute time and amenity access for the typical tenant pool here? Any planned neighborhood developments (good or bad) we should know about?
- What's the average days-on-market for RENTAL listings here right now (not sales)? A rising rental-DOM trend means longer vacancies and softer asking-rent achievability than the comps imply.
- What's the recent tenant-quality profile in this submarket — average credit score on applications, eviction rate, late-payment / NSF rate, and stable-employment percentage? A property-management company in the area should have these aggregated.
- How much new for-sale + rental construction is in the pipeline within 1–3 miles? Heavy new supply typically softens prices + rents 12–24 months out; constrained supply supports both.
Investment metrics
- 1% rule
- 0.87% ✗
- Cap rate
- 7.21%
- Cash-on-cash
- 3.27%
- DSCR
- 1.15
- GRM
- 9.6
CMA / ARV
No comps found within radius.
Projected returns pro-forma
-3.0% appreciation · 2.5% rent growth · sell at horizon
- IRR
- -11.7%
- Equity multiple
- 0.58×
- Total profit
- $-21,272
- Equity at exit
- $26,839
- IRR
- -3.2%
- Equity multiple
- 0.79×
- Total profit
- $-10,711
- Equity at exit
- $15,563
Cash invested: $50,400 (down + closing). Projections, not guarantees.
Landlord ↔ Tenant lean methodology
- Overall (STATE)
- 85 Strongly Landlord-Friendly
- State North Carolina
- 85 Strongly Landlord-Friendly · R+3
- County
- — inherits STATE
- City
- — inherits STATE
ZIP-level market 28081
- Rents YoY
- 2.5%
- Active inventory
- 226
- Price-to-rent
- 9.6×
Monthly cashflow live
- Estimated rent
- $1,563 medium interval (Pro) →
- Mortgage (P&I)
- −$944
- Tax from tax record
- −$79 /mo · $942/yr
- Insurance
- −$75
- HOA
- −$0
- Vacancy / Maint / Mgmt
- −$328
- Net cashflow
- $137
Break-even live
Sensitivity live
| Price | -10% $239 | -5% $188 | +0% $137 | +5% $86 | +10% $35 |
|---|---|---|---|---|---|
| Rent | -10% $14 | -5% $76 | +0% $137 | +5% $199 | +10% $261 |
| Rate | -1.0pp $228 | -0.5pp $183 | base $137 | +0.5pp $91 | +1.0pp $43 |
UW: 25.0% down · 7.5% · 30yr · 1.5% tax · 5.0% vac · 8.0% maint · 8.0% mgmt
Financing live
Cash to close
- Down payment
- $45,000
- Closing costs
- $5,400
- Reserves months
- —
- Total cash needed
- —
Loan-product check · same deal, 3 products live
Conventional
25% down · 7.5% · 30yr
- Down + closing
- —
- Monthly P&I
- —
- Monthly cashflow
- —
- DSCR
- —
- Eligible?
- —
Personal DTI + credit; lowest rate.
DSCR
20% down · 8.5% · 30yr
- Down + closing
- —
- Monthly P&I
- —
- Monthly cashflow
- —
- DSCR
- —
- Eligible?
- —
No personal income docs; deal must DSCR.
Hard money
10% down · 12.0% · 12mo
- Down + closing
- —
- Monthly P&I
- —
- Monthly cashflow
- —
- DSCR
- —
- Eligible?
- —
Short-term bridge; refi at stabilization.
Rent comps 2 comps
| Address | Beds | Baths | Sqft | Rent | $/sqft | DOM | Units | Dist |
|---|---|---|---|---|---|---|---|---|
| 4301 Forestridge Ln Kannapolis, NC | 1.0–2.0 | 1.0–2.0 | 797 | $1,525 | $1.91 | 0d | 1 | 0.72mi |
| 200 Franklin Ave Unit 200 Kannapolis, NC | 2.0 | 1.5 | 1024 | $1,500 | $1.46 | 22d | 1 | 1.31mi |
Listing history 20 events
-
2026-06-21days on market $180,000 Active 79 DOM
-
2026-06-18price $180,000 Active 76 DOM
-
2026-06-18days on market $200,000 Active 76 DOM
-
2026-06-17days on market $200,000 Active 75 DOM
-
2026-06-16days on market $200,000 Active 74 DOM
-
2026-06-15days on market $200,000 Active 73 DOM
-
2026-06-13days on market $200,000 Active 71 DOM
-
2026-06-09days on market $200,000 Active 67 DOM
-
2026-06-08days on market $200,000 Active 66 DOM
-
2026-06-07days on market $200,000 Active 65 DOM
-
2026-06-04days on market $200,000 Active 62 DOM
-
2026-06-03days on market $200,000 Active 61 DOM
-
2026-06-02days on market $200,000 Active 60 DOM
-
2026-06-01days on market $200,000 Active 59 DOM
-
2026-05-31days on market $200,000 Active 58 DOM
-
2026-04-03$200,000 Active
-
2021-12-20soldstatus $125,000 Closed 363-char remark
Show marketing remark (363 chars)
Cute! Recently remodeled in 2021 with new paint, LVP throughout, kitchen countertops and beautifully tiled custom shower. Great starter home or investment property. Located only 9 minutes from the newly revitalized downtown Kannapolis on a quiet street with great dining experience and the Cannon Ballers Stadium. Schedule your showing today before it's too late!
-
2021-11-19historical Active Under Contract 363-char remark
Show marketing remark (363 chars)
Cute! Recently remodeled in 2021 with new paint, LVP throughout, kitchen countertops and beautifully tiled custom shower. Great starter home or investment property. Located only 9 minutes from the newly revitalized downtown Kannapolis on a quiet street with great dining experience and the Cannon Ballers Stadium. Schedule your showing today before it's too late!
-
2021-11-12$125,000 Active 363-char remark
Show marketing remark (363 chars)
Cute! Recently remodeled in 2021 with new paint, LVP throughout, kitchen countertops and beautifully tiled custom shower. Great starter home or investment property. Located only 9 minutes from the newly revitalized downtown Kannapolis on a quiet street with great dining experience and the Cannon Ballers Stadium. Schedule your showing today before it's too late!
-
2021-02-17soldstatus $66,000
ⓘ Source: listings_history table (triggers on properties + properties_extension) + one-shot
backfill from property_details.listing_events for pre-trigger history.
Tax reassessment forecast NC · Resets to sale price
- Current annual tax
- $942 · $79/mo
- Projected year-2 tax
- $1,476 · $123/mo
- Expected delta
- +$534/yr (+$44/mo · 56.6%)
ⓘ Screening estimate from a state-policy table — verify with the county assessor before closing.
Climate risk First Street
- Flood 1/10 Low FEMA zone X (unshaded) · 0% chance over 30 yrs
- Wildfire 3/10 Moderate
- Heat 5/10 Major 7 d/yr ≥104°F today · 17 d/yr by 30 yrs out
- Wind 4/10 Moderate 15% chance of damaging wind over 30 yrs
- Air quality 3/10 Moderate 3 unhealthy d/yr today · 4 by 30 yrs out
Nearby sold comps map
Loading sold comps map…
Walkable amenities ~0.75 mi
Loading nearby amenities…
Taxation est. · year 1
- Rental income
- $18,756
- − Mortgage interest
- −$10,083
- − Property taxes
- −$942
- − Insurance
- −$900
- − Repairs & maintenance
- −$1,500
- − Management
- −$1,500
- − Depreciation
- −$5,236
- Taxable loss
- −$1,406
- Est. tax savings @ 24.0%
- +$338
- After-tax cash flow
- $1,985/yr
For passive investors: Depreciation is non-cash, so a rental often shows a tax loss while cash-flowing — sheltering income. Rental losses are passive: they offset passive income freely, and up to $25,000/yr can offset ordinary (W-2) income if you actively participate and your MAGI is under $100k (phasing out to $0 by $150k); unused losses carry forward. On sale, claimed depreciation is recaptured at up to 25%, and gains may owe capital-gains tax (a 1031 exchange can defer both). Figures are a year-1 estimate at your 24.0% rate — not tax advice; consult a CPA.
Schools (NCES district)
- District
- Kannapolis City Schools
- NCES district ID
- 3702430
- Math proficiency
- 30% ▲ 7.00%
- Reading proficiency
- 33% ▼ -2.00%
- Median HH income
- $38,534
- Composite
- 26.34/100
- National rank
- #7237
- State rank
- #141 of 178 in NC
Livability — Kannapolis
- Score
- 64/100
- State rank
- #354
- US rank
- #14030
Category grades
Schools grade is shown separately in the Schools card above.
Census & demographics
- County
- Cabarrus County · 218,793 people
- City population
- 57,170
- Metro
- Charlotte-Concord-Gastonia, NC-SC
- Population (ZIP)
- 29,075
- Household income
- $71,665
- Rent vs Own
- Severe rent burden
- 763.0
Population outlook (Cabarrus County) Hauer SSP2
- Today (2025)
- 239,273 people
- By 2030
- 260,754 · +9.0%
- By 2040
- 303,953 · +27.0%
- By 2050
- 344,827 · +44.1%
- By 2075
- 435,623 · +82.1%
- By 2100
- 490,119 · +104.8%
Race, ethnicity, and origin ACS 2023
- Neighborhood character
- Majority White (65%)
- Race & ethnicity
- White 65% Black 18% Hispanic / Latino 12% Two or more races 6% Asian 1%
- Hispanic origin (detail)
- Mexican 6%
- Common ancestry
- Slovak 2% Italian 1% Serbian 1%
- Foreign-born
- 8% · Canada, China
- Languages at home
- 88% English-only · Spanish 10% French/Haitian/Cajun 1% Chinese 1%
Political lean MEDSL · Cabarrus
- 2024 margin
- Lean R (+7.7) · D 45.5% · R 53.2% · Other 1.3%
- 2008→2024 swing
- +10.7pp toward D · 2008: -18.4pp · 2024: -7.7pp
- All cycles
- 2024: R+7.7 2020: R+9.4 2016: R+20.0 2012: R+20.2 2008: R+18.4
Not yet ingested
- Civics
- —
Market trends
- HPI YoY
- ▼ -202.75%
- Current HPI
- 282.9002
- Rent YoY
- ▲ 2.50%
- Metro
- Charlotte-Concord-Gastonia, NC-SC
- State GDP YoY
- ▲ 3.28%
- F500 in state
- 26
Industry mix (Fortune 500 HQ in NC)
| Industry | F500 HQs | Revenue |
|---|---|---|
| Financial Services | 2 | $213B |
|
||
| Retail | 2 | $95B |
|
||
| Industrial Conglomerate | 1 | $38B |
|
||
| Metals / Steel | 1 | $35B |
|
||
| Utilities | 1 | $30B |
|
||
| Industrial Machinery | 1 | $19B |
|
||
Price history
+203.0% since first listed5 events — show timeline
- 2026-04-03 Listed $200,000 CANOPYMLS as Distributed by MLS Grid
- 2021-12-20 Sold (MLS) $125,000 CANOPYMLS as Distributed by MLS Grid
- 2021-11-19 Contingent — CANOPYMLS as Distributed by MLS Grid
- 2021-11-12 Listed $125,000 CANOPYMLS as Distributed by MLS Grid
- 2021-02-17 Sold (Public Records) $66,000 Public Records
Property tax history
+6.6%/yrLatest (2025): $942 · +0.0% YoY. Source: county tax records.
Cash-flow waterfall
monthlySold comps — $/sqft
last 12 mo · ≤1 miLoading sold comps…