 Triplex
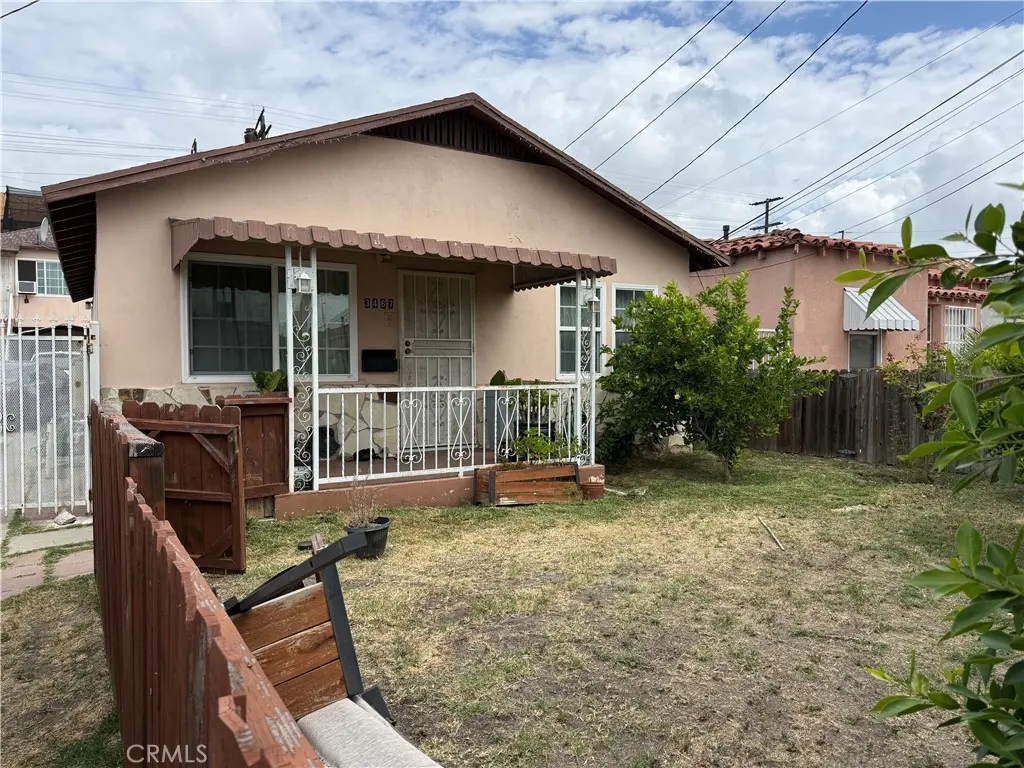
3467 Walnut · Huntington Park, CA
Flood risk 3/10 · Minor
- FEMA flood zone
- X (unshaded)
- Chance of flooding over 30 yrs
- 0.1%
- Est. flood insurance / yr
- $507 – $1,088
Fire risk 1/10 · Minimal
- Est. fire insurance / yr
- $659 – $1,223
Heat risk 5/10 · Moderate
- Hot days now (above 91°F)
- 7 days/yr
- Hot days in 30 yrs
- 20 days/yr
Wind risk 1/10 · Minimal
- Chance of severe wind over 30 yrs
- —
Air-quality risk 5/10 · Moderate
- Unhealthy air days now
- 9 days/yr
- Unhealthy air days in 30 yrs
- 9 days/yr
Risk factors via First Street. Map © Google.
Why this score? — see what drove the F grade
The composite is a weighted blend of 9 inputs, each scored 0–100. Each bar is that input's sub-score; the figure is the points it added to the 100-point composite (weight × sub-score).
- Cash flow +12.1/30.0
- DSCR +3.6/10.0
- Schools +3.6/10.0
- 1% rule +3.1/10.0
- Livability +3.1/5.0
- Condition / age +2.5/5.0
- Rent growth +2.1/5.0
- ARV discount +1.2/15.0
- Appreciation +0.0/10.0
$835,000
🖨 Deal sheet 📄 Offer letter ✓ Due diligence
Multi-family units
County records classify this as Multi-Family (2-4 Unit). Listing-text estimate: 3 units. confirmed
Listing remarks
Great investment opportunity in Huntington Park! This well-maintained 3-unit property offers flexibility for both investors and owner-occupants. All three units are currently occupied on convenient month-to-month leases, providing immediate rental income with the option to adjust rents or occupancy as desired. The front unit is ideal for an owner-user looking to live on-site while generating income from the rear units, or you can maximize returns by renting out all three units. Located in a desirable area with strong rental demand, this property presents excellent upside potential. Property includes three garages, one of which has been previously converted into a studio without permits. It
Key facts
- 4,997 sq ft lot
- 3 garage spots
- Built 1926
Property features AI
Finance
- Other: Total building area reported as 1,868; Property consists of 2 buildings; Number of leased units: 3
- Financial info: Gross scheduled income: $58,344; Gross income: $58,344; Total actual rent currently: $4,862; Net operating income: $44,821; Operating expenses: $13,523; Expense breakdown include insurance, water/sewer, electric, and trash
Exterior
- Parking: Total of 3 parking spaces; Each unit includes one attached garage space
- Utilities: Public sewer; District/public water; Three separate electric meters; Three separate gas meters; One separate water meter
- Home design: Multi-unit property (3 total units); Two stories; No ADU; Rectangular lot shape
- Construction: Year built per assessor (source: Assessor)
- Exterior features: No pool; Gutters
Interior
- Kitchen: Appliances not specified
- Bedrooms: Three 1-bed units and one 3-bed unit across the property (unit breakdown: two 1-bed units, one 3-bed unit); Units are unfurnished
- Bathrooms: Each unit has one full bathroom
- Heating & cooling: Wall heating
- Interior features: Two-level layout; Front entry; Wall heater
- Laundry & utility: Washer hookup available; No on-site laundry machines specified
Neighborhood map
What this means for you Summary
Snapshot
- This is a 3 × 5-bed/3.0-bath units multifamily listed at $835k.
Deal economics
- At list price, monthly cash flow is $-180 ($-2k/yr) — negative. Per door: $-60/mo.
- To cash-flow at today's rent, offer at most $803k (3.8% below list).
- To meet the 1% rule (rent ≥ 1% of price), the offer needs to be $675k (19.1% below list).
- Recommended offer: $675k (19.1% below list) — sets the bar for 1% rule.
- Cap rate 6.0% vs local median 3.1% in Huntington Park — top-decile yield for the area; either an underpriced asset or a hidden risk that comps aren't pricing in. Stress-test before assuming the spread holds.
Location & tenants
- Location reads 62/100 on livability (#491 in CA) — a middle-class / working-renter tenant base. Strengths: commute A+; Watch: employment D+, health & safety D, schools D-.
- Los Angeles Unified (urban): math 29% / reading 54% proficiency, ranked #223 of 517 in CA (top 43%) — families likely to look elsewhere, expect single-tenant / working-renter base with shorter leases; 67% free/reduced lunch — lower-income household profile, screen leases tightly.
- Market conditions: Rents soft (-1.4%/yr); 52 active listings in the ZIP; 19,697 units permitted in Los Angeles County in 2024 (9,426 in 5+ unit buildings).
- At $6,753/mo this rent would consume 125% of the median local household income ($65k/yr) (locally 3774% of renters already pay >50% of income on rent) — very limited rent-growth headroom before tenants either downsize or default.
Forward outlook
- Local home prices are declining (-3.0%/yr); year-one equity from $6k of loan paydown is wiped out by about $25k of value loss. Plan a longer hold.
- Los Angeles County population projected at +9% by 2050 — modest demand growth; plan on rents tracking national, not racing it.
Negotiation context
- It's been on market 44 days — a 3% lower offer ($810k) is reasonable based on typical stale-listing flexibility.
- Current owner paid $125k; list at $835k implies a 568% gain — meaningful room to come down on a strong offer.
Risks & watch-outs
- Watch-outs: built in 1926 — expect roof / HVAC / electrical / plumbing capex.
- Climate carrying-cost: extreme-heat days projected 7→20/yr by 2055 (HVAC capex compounding) — expect insurance premiums to compound above CPI over the hold.
Questions for the listing agent
- What do current leases actually rent for vs. the listed asking? Can we see a recent rent roll and the last 12 months of T-12 income?
- It's been on market 44 days. Have you received any prior offers? Is the seller open to a 19% concession, seller financing, or rate buy-down credit?
- Can we see the unit-by-unit rent roll, current vacancy, and any below-market leases? What's the average tenancy length?
- What capital expenditures (roof, boiler, parking lot, exteriors) have been made in the last 5 years, and what's planned in the next 2?
- Built in 1926 — when were the roof, HVAC, electrical panel, plumbing, and water heater last replaced?
- Is there a deadline driving the sale (1031 exchange, divorce, estate, relocation)? That informs how much negotiation room exists.
- Schools are D-rated, which usually means shorter tenancies and higher turnover. Who's the typical renter profile here, and what's been the actual vacancy rate?
- Crime grade is F in this area — have there been break-ins, vandalism, or insurance claims at this property in the last 3 years? What carrier currently insures it and at what premium?
- The area grade is low — what's the realistic commute time and amenity access for the typical tenant pool here? Any planned neighborhood developments (good or bad) we should know about?
- What's the average days-on-market for RENTAL listings here right now (not sales)? A rising rental-DOM trend means longer vacancies and softer asking-rent achievability than the comps imply.
- What's the recent tenant-quality profile in this submarket — average credit score on applications, eviction rate, late-payment / NSF rate, and stable-employment percentage? A property-management company in the area should have these aggregated.
- How much new apartment / multifamily construction is in the pipeline within 1–3 miles? Heavy new supply (>2% of stock underway) typically softens rents 12–24 months out; light construction supports rent growth.
Investment metrics
- 1% rule
- 0.81% ✗
- Cap rate
- 6.03%
- Cash-on-cash
- -0.92%
- DSCR
- 0.96
- GRM
- 10.3
CMA / ARV
- ARV (median comp)
- $732,859
- List price
- $835,000
- Delta
- 13.94%
- Verdict
- OVERPRICED
- Comps
- 20 within 1.0 mi
Projected returns pro-forma
-3.0% appreciation · 0.0% rent growth · sell at horizon
- IRR
- -21.1%
- Equity multiple
- 0.29×
- Total profit
- $-166,596
- Equity at exit
- $124,501
- IRR
- -23.1%
- Equity multiple
- -0.01×
- Total profit
- $-236,513
- Equity at exit
- $72,196
Cash invested: $233,800 (down + closing). Projections, not guarantees.
Landlord ↔ Tenant lean methodology
- Overall (STATE)
- 18 Strongly Tenant-Friendly
- State California
- 18 Strongly Tenant-Friendly · D+13
- County
- — inherits STATE
- City
- — inherits STATE
ZIP-level market 90255
- Rents YoY
- -1.4%
- Active inventory
- 52
- Price-to-rent
- 30.9×
Monthly cashflow live
- Estimated rent
- $6,753 medium interval (Pro) →
- Mortgage (P&I)
- −$4,379
- Tax from tax record
- −$788 /mo · $9,454/yr
- Insurance
- −$348
- HOA
- −$0
- Vacancy / Maint / Mgmt
- −$1,418
- Net cashflow
- $-180
Break-even live
3-unit breakdown (identical units grouped — click to expand)
| Units | Beds | Baths | Est. rent |
|---|---|---|---|
| 3× units | 5 | 3 | $6,753 |
| #1 | 5 | 3 | $2,251 |
| #2 | 5 | 3 | $2,251 |
| #3 | 5 | 3 | $2,251 |
| Total (3 units) | $6,753 | ||
UW: 25.0% down · 7.5% · 30yr · 1.5% tax · 5.0% vac · 8.0% maint · 8.0% mgmt
Financing live
Cash to close
- Down payment
- $208,750
- Closing costs
- $25,050
- Reserves months
- —
- Total cash needed
- —
Loan-product check · same deal, 3 products live
Conventional
25% down · 7.5% · 30yr
- Down + closing
- —
- Monthly P&I
- —
- Monthly cashflow
- —
- DSCR
- —
- Eligible?
- —
Personal DTI + credit; lowest rate.
DSCR
20% down · 8.5% · 30yr
- Down + closing
- —
- Monthly P&I
- —
- Monthly cashflow
- —
- DSCR
- —
- Eligible?
- —
No personal income docs; deal must DSCR.
Hard money
10% down · 12.0% · 12mo
- Down + closing
- —
- Monthly P&I
- —
- Monthly cashflow
- —
- DSCR
- —
- Eligible?
- —
Short-term bridge; refi at stabilization.
Listing history 15 events
-
2026-06-18days on market $835,000 Active 44 DOM
-
2026-06-17days on market $835,000 Active 43 DOM
-
2026-06-16days on market $835,000 Active 42 DOM
-
2026-06-15days on market $835,000 Active 41 DOM
-
2026-06-13days on market $835,000 Active 39 DOM
-
2026-06-09days on market $835,000 Active 35 DOM
-
2026-06-08days on market $835,000 Active 34 DOM
-
2026-06-07days on market $835,000 Active 33 DOM
-
2026-06-04days on market $835,000 Active 30 DOM
-
2026-06-03days on market $835,000 Active 29 DOM
-
2026-06-02days on market $835,000 Active 28 DOM
-
2026-06-01days on market $835,000 Active 27 DOM
-
2026-05-31days on market $835,000 Active 26 DOM
-
2026-05-05$835,000 Active 979-char remark
-
1983-05-26soldstatus $125,000
ⓘ Source: listings_history table (triggers on properties + properties_extension) + one-shot
backfill from property_details.listing_events for pre-trigger history.
Tax reassessment forecast CA · Resets to sale price
- Current annual tax
- $9,454 · $788/mo
- Projected year-2 tax
- $9,454 · $788/mo
- Expected delta
- $0/yr ($0/mo · 0.0%)
ⓘ Screening estimate from a state-policy table — verify with the county assessor before closing.
Climate risk First Street
- Flood 3/10 Moderate FEMA zone X (unshaded) · 10% chance over 30 yrs
- Wildfire 1/10 Low
- Heat 5/10 Major 7 d/yr ≥91°F today · 20 d/yr by 30 yrs out
- Wind 1/10 Low
- Air quality 5/10 Major 9 unhealthy d/yr today · 9 by 30 yrs out
Nearby sold comps map
Loading sold comps map…
Walkable amenities ~0.75 mi
Loading nearby amenities…
Taxation est. · year 1
- Rental income
- $81,036
- − Mortgage interest
- −$46,773
- − Property taxes
- −$9,454
- − Insurance
- −$4,175
- − Repairs & maintenance
- −$6,483
- − Management
- −$6,483
- − Depreciation
- −$24,291
- Taxable loss
- −$16,622
- Est. tax savings @ 24.0%
- +$3,989
- After-tax cash flow
- $1,833/yr
For passive investors: Depreciation is non-cash, so a rental often shows a tax loss while cash-flowing — sheltering income. Rental losses are passive: they offset passive income freely, and up to $25,000/yr can offset ordinary (W-2) income if you actively participate and your MAGI is under $100k (phasing out to $0 by $150k); unused losses carry forward. On sale, claimed depreciation is recaptured at up to 25%, and gains may owe capital-gains tax (a 1031 exchange can defer both). Figures are a year-1 estimate at your 24.0% rate — not tax advice; consult a CPA.
Schools (NCES district)
- District
- Los Angeles Unified
- NCES district ID
- 0622710
- Math proficiency
- 29% ▼ -4.00%
- Reading proficiency
- 54% ▲ 10.00%
- Median HH income
- $50,403
- Composite
- 35.67/100
- National rank
- #4875
- State rank
- #223 of 517 in CA
Livability — Huntington Park
- Score
- 62/100
- State rank
- #491
- US rank
- #16649
Category grades
Schools grade is shown separately in the Schools card above.
Census & demographics
- Census place
- Huntington Park, CA
- County
- Los Angeles County · 9,444,647 people
- City population
- 69,349
- Metro
- Los Angeles-Long Beach-Anaheim, CA
- Population (ZIP)
- 69,349
- Household income
- $64,766
- Rent vs Own
- Severe rent burden
- 3774.0
Population outlook (Los Angeles County) Hauer SSP2
- Today (2025)
- 10,940,515 people
- By 2030
- 11,256,481 · +2.9%
- By 2040
- 11,729,929 · +7.2%
- By 2050
- 11,948,407 · +9.2%
- By 2075
- 11,818,114 · +8.0%
- By 2100
- 10,842,928 · -0.9%
Race, ethnicity, and origin ACS 2023
- Neighborhood character
- Predominantly Hispanic (97%)
- Race & ethnicity
- Hispanic / Latino 97% Two or more races 31% Native American 2% White 1%
- Hispanic origin (detail)
- Mexican 78%
- Foreign-born
- 46% · Canada
- Languages at home
- 11% English-only · Spanish 88%
Political lean MEDSL · Los Angeles
- 2024 margin
- Solid D (+32.9) · D 64.8% · R 31.9% · Other 3.3%
- 2008→2024 swing
- -7.4pp toward R · 2008: 40.4pp · 2024: 32.9pp
- All cycles
- 2024: D+32.9 2020: D+44.2 2016: D+48.0 2012: D+40.0 2008: D+40.4
Not yet ingested
- Civics
- —
Market trends
- HPI YoY
- ▼ -666.90%
- Current HPI
- 432.2813
- Rent YoY
- ▼ -1.44%
- Metro
- Los Angeles-Long Beach-Anaheim, CA
- State GDP YoY
- ▲ 3.21%
- F500 in state
- 116
Industry mix (Fortune 500 HQ in CA)
| Industry | F500 HQs | Revenue |
|---|---|---|
| Technology | 27 | $1,492B |
|
||
| Financial Services | 3 | $174B |
|
||
| Retail | 3 | $44B |
|
||
| Insurance | 3 | $26B |
|
||
| Media / Entertainment | 2 | $115B |
|
||
| Pharmaceuticals / Biotech | 2 | $62B |
|
||
Price history
+568.0% since first listed2 events — show timeline
- 2026-05-05 Listed $835,000 CRMLS
- 1983-05-26 Sold (Public Records) $125,000 Public Records
Property tax history
+6.2%/yrLatest (2025): $9,454 · +2.7% YoY. Source: county tax records.
Cash-flow waterfall
monthlySold comps — $/sqft
last 12 mo · ≤1 miLoading sold comps…