 Duplex
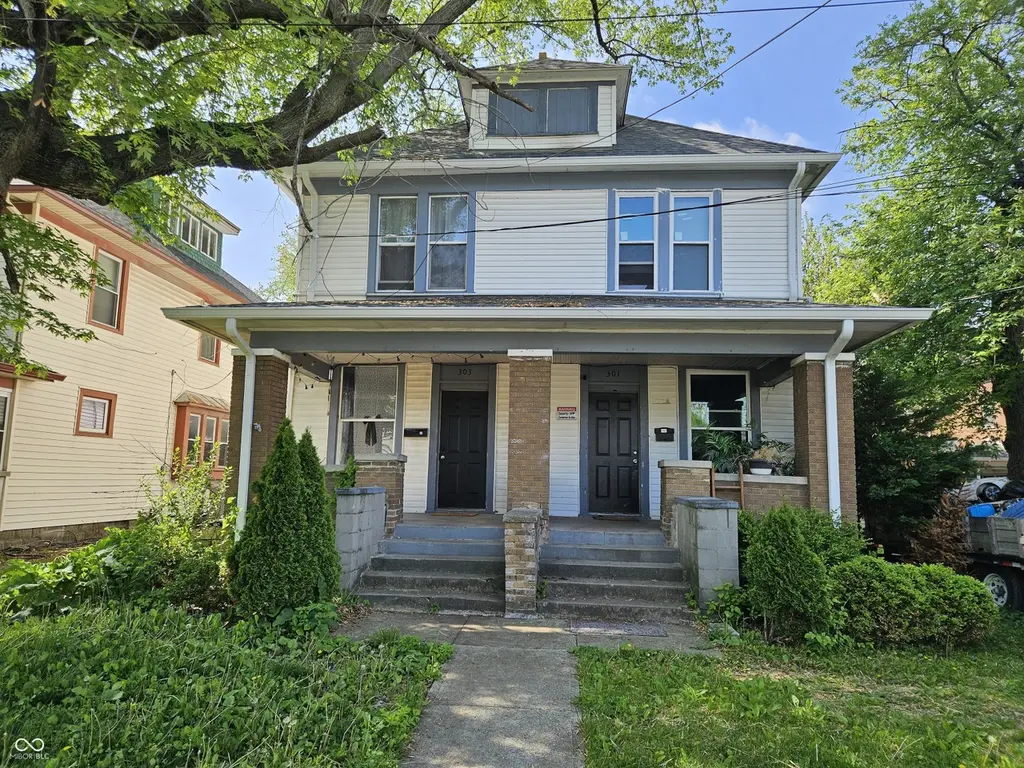
301 E Southern Ave · Indianapolis city (balance), IN
Flood risk 1/10 · Minimal
- FEMA flood zone
- X (unshaded)
- Chance of flooding over 30 yrs
- 0.0%
- Est. flood insurance / yr
- $473 – $860
Fire risk 1/10 · Minimal
- Est. fire insurance / yr
- $717 – $1,331
Heat risk 4/10 · Minor
- Hot days now (above 101°F)
- 7 days/yr
- Hot days in 30 yrs
- 19 days/yr
Wind risk 2/10 · Minimal
- Chance of severe wind over 30 yrs
- 0.0%
Air-quality risk 3/10 · Minor
- Unhealthy air days now
- 2 days/yr
- Unhealthy air days in 30 yrs
- 3 days/yr
Risk factors via First Street. Map © Google.
Why this score? — see what drove the B- grade
The composite is a weighted blend of 9 inputs, each scored 0–100. Each bar is that input's sub-score; the figure is the points it added to the 100-point composite (weight × sub-score).
- Cash flow +25.2/30.0
- ARV discount +14.1/15.0
- DSCR +8.3/10.0
- 1% rule +7.4/10.0
- Rent growth +5.0/5.0
- Livability +2.5/5.0
- Condition / age +2.5/5.0
- Schools +1.4/10.0
- Appreciation +0.0/10.0
$205,000
🖨 Deal sheet 📄 Offer letter ✓ Due diligence
Multi-family units
County records classify this as Multi-Family (2-4 Unit). Listing-text estimate: 2 units. confirmed
Listing remarks MLS
Don't miss this exceptional duplex located in the highly desirable Garfield Park area! With significant investment and revitalization efforts underway, this is a prime opportunity to secure a property in a flourishing neighborhood. Perfect for a first-time homebuyer that wants to use a renovation loan to buy and renovate, or an newer investor that could live on one side and rent the other side out. This duplex is currently occupied by tenants who are on a month-to-month lease, providing $1,950 total/month, with market rent potential of $2,420 total/month. Addresses are 301 and 303 E Southern Ave. Recent updates to the property include a newer roof, fresh paint, modern light fixtures, updated appliances, and renovated kitchen and bathroom, ensuring it's attractive to tenants and requires minimal upkeep. Located conveniently on the west side, this property offers easy access to a variety of amenities, including schools, parks, and shopping centers. Enjoy seamless connectivity to S Meridian St, Raymond St, Madison Ave, and highways I-70/65. Major employment hubs such as 16 Tech, IU Health Methodist Hospital, Eli Lilly, and downtown Indianapolis are just a short commute away, enhancing the property's desirability.
Key facts
- Updated appliances
- Fresh paint
- Newer roof
Tags
Neighborhood map
What this means for you Summary
Snapshot
- This is a 2 × 3-bed/3.0-bath units multifamily listed at $205k.
Deal economics
- At list price, monthly cash flow is $460 ($6k/yr) — positive. Per door: $230/mo.
- The deal already cash-flows at list — no discount required.
- Meets the 1% rule at list price ($3k rent vs $205k).
- Recommended offer: $180k (12.0% below list) — sets the bar for market timing.
- Cap rate 9.0% vs local median 4.4% in Indianapolis city (balance) — top-decile yield for the area; either an underpriced asset or a hidden risk that comps aren't pricing in. Stress-test before assuming the spread holds.
Location & tenants
- Location reads: area grade B — affects rentability + tenant quality, not the cash-flow math above.
- Indianapolis Public Schools (urban): math 14% / reading 20% proficiency, ranked #286 of 301 in IN (top 95%) — low school quality limits family demand, transient renter base, plan for 1-2y turnover; 77% free/reduced lunch — lower-income household profile, screen leases tightly.
- Market conditions: Rents rising fast (+11.0%/yr); 129 active listings in the ZIP; 40 comparable units currently listed for rent nearby; rentals at typical pace (median 24d on market — plan ~3-4 weeks tenant-placement turnaround); 40% of comp listings sitting > 30 days — soft ceiling on asking rent; 1,906 units permitted in Marion County in 2024 (621 in 5+ unit buildings).
- At $2,541/mo this rent would consume 55% of the median local household income ($55k/yr) (locally 311% of renters already pay >50% of income on rent) — very limited rent-growth headroom before tenants either downsize or default.
Forward outlook
- Local home prices are declining (-3.0%/yr); year-one equity from $1k of loan paydown is wiped out by about $6k of value loss. Plan a longer hold.
- Marion County population projected at +18% by 2050 — long-run rental-demand tailwind backs the buy-and-hold thesis.
- At projected returns (-3.0% appreciation + 8.0% rent growth), your $57k cash investment doubles in ~8 years — after that, you're playing with house money.
Negotiation context
- It's been on market 313 days — a 12% lower offer ($180k) is reasonable based on typical stale-listing flexibility.
- 6 sale attempts since 21y ago with the ask held roughly flat each time — persistent listings suggest the price (not the market) is what's stuck; bring a comps-based counter.
- Current owner paid $24k; list at $205k implies a 754% gain — meaningful room to come down on a strong offer.
Risks & watch-outs
- Watch-outs: built in 1920 — expect roof / HVAC / electrical / plumbing capex.
Questions for the listing agent
- It's been on market 313 days. Have you received any prior offers? Is the seller open to a 12% concession, seller financing, or rate buy-down credit?
- Can we see the unit-by-unit rent roll, current vacancy, and any below-market leases? What's the average tenancy length?
- What capital expenditures (roof, boiler, parking lot, exteriors) have been made in the last 5 years, and what's planned in the next 2?
- Built in 1920 — when were the roof, HVAC, electrical panel, plumbing, and water heater last replaced?
- Why hasn't it sold? Are there any deal-killer items the seller is aware of (foundation, flood, title, zoning, code violations)?
- Is there a deadline driving the sale (1031 exchange, divorce, estate, relocation)? That informs how much negotiation room exists.
- What's the average days-on-market for RENTAL listings here right now (not sales)? A rising rental-DOM trend means longer vacancies and softer asking-rent achievability than the comps imply.
- What's the recent tenant-quality profile in this submarket — average credit score on applications, eviction rate, late-payment / NSF rate, and stable-employment percentage? A property-management company in the area should have these aggregated.
- How much new apartment / multifamily construction is in the pipeline within 1–3 miles? Heavy new supply (>2% of stock underway) typically softens rents 12–24 months out; light construction supports rent growth.
Investment metrics
- 1% rule
- 1.24% ✓
- Cap rate
- 8.98%
- Cash-on-cash
- 9.61%
- DSCR
- 1.43
- GRM
- 6.7
CMA / ARV
- ARV (median comp)
- $240,086
- List price
- $205,000
- Delta
- -14.61%
- Verdict
- UNDERPRICED
- Comps
- 13 within 1.0 mi
Show comp detail 1 sale within ~0.75 mi
| Address | Dist | Beds/Ba | Sqft | Sold | Price | $/sf | Match |
|---|---|---|---|---|---|---|---|
| 1201 Finley Ave | 0.73mi | 3/1.0 | 1,100 (-10%) | 6mo | $320,500 | $291 | 25 |
Match score weights: distance 35% · size 25% · config 20% · recency 20%. Top-matched comps best support the ARV.
Projected returns pro-forma
-3.0% appreciation · 8.0% rent growth · sell at horizon
- IRR
- 4.1%
- Equity multiple
- 1.17×
- Total profit
- $9,611
- Equity at exit
- $30,566
- IRR
- 18.1%
- Equity multiple
- 2.88×
- Total profit
- $107,677
- Equity at exit
- $17,725
Cash invested: $57,400 (down + closing). Projections, not guarantees.
Landlord ↔ Tenant lean methodology
- Overall (STATE)
- 90 Strongly Landlord-Friendly
- State Indiana
- 90 Strongly Landlord-Friendly · R+11
- County
- — inherits STATE
- City
- — inherits STATE
ZIP-level market 46225
- Home prices YoY
- -8.2%
- Rents YoY
- 11.0%
- Active inventory
- 129
- Price-to-rent
- 13.4×
Monthly cashflow live
- Estimated rent
- $2,541 high interval (Pro) →
- Mortgage (P&I)
- −$1,075
- Tax from tax record
- −$387 /mo · $4,646/yr
- Insurance
- −$85
- HOA
- −$0
- Vacancy / Maint / Mgmt
- −$534
- Net cashflow
- $460
Break-even live
2-unit breakdown (identical units grouped — click to expand)
| Units | Beds | Baths | Est. rent |
|---|---|---|---|
| 2× units | 3 | 3 | $2,540 |
| #1 | 3 | 3 | $1,270 |
| #2 | 3 | 3 | $1,270 |
| Total (2 units) | $2,541 | ||
UW: 25.0% down · 7.5% · 30yr · 1.5% tax · 5.0% vac · 8.0% maint · 8.0% mgmt
Financing live
Cash to close
- Down payment
- $51,250
- Closing costs
- $6,150
- Reserves months
- —
- Total cash needed
- —
Loan-product check · same deal, 3 products live
Conventional
25% down · 7.5% · 30yr
- Down + closing
- —
- Monthly P&I
- —
- Monthly cashflow
- —
- DSCR
- —
- Eligible?
- —
Personal DTI + credit; lowest rate.
DSCR
20% down · 8.5% · 30yr
- Down + closing
- —
- Monthly P&I
- —
- Monthly cashflow
- —
- DSCR
- —
- Eligible?
- —
No personal income docs; deal must DSCR.
Hard money
10% down · 12.0% · 12mo
- Down + closing
- —
- Monthly P&I
- —
- Monthly cashflow
- —
- DSCR
- —
- Eligible?
- —
Short-term bridge; refi at stabilization.
Rent comps 40 comps
| Address | Beds | Baths | Sqft | Rent | $/sqft | DOM | Units | Dist |
|---|---|---|---|---|---|---|---|---|
| 265 E Southern Ave Indianapolis, IN | 1.0–2.0 | 1.0 | 800 | $1,150 | $1.44 | 2d | 2 | 0.07mi |
| 110 Pennsylvania Ct Indianapolis, IN | 3.0 | 2.0 | 1202 | $1,700 | $1.41 | 4d | 1 | 0.22mi |
| 2760 S East St Indianapolis, IN | 2.0–3.0 | 2.0 | 1072 | $1,045 | $0.97 | 3d | 3 | 0.28mi |
| 2770 S East St Apt 103 Indianapolis, IN | 3.0 | 2.0 | 1190 | $1,045 | $0.88 | 14d | 1 | 0.29mi |
| 2770 South East St Unit 302 Indianapolis, IN | 3.0 | 2.0 | 1158 | $1,015 | $0.88 | 3d | 1 | 0.29mi |
| 2236 Ransdell St Indianapolis, IN | 2.0 | 1.0 | 850 | $1,150 | $1.35 | 43d | 1 | 0.41mi |
| 2314 Union St Indianapolis, IN | 3.0 | 2.0 | 892 | $1,295 | $1.45 | 43d | 1 | 0.44mi |
| 2859 S Meridian St Indianapolis, IN | 1.0–2.0 | 1.0 | 771 | $906 | $1.17 | 23d | 2 | 0.47mi |
| 2859 S Meridian St Indianapolis, IN | 1.0–2.0 | 1.0 | 771 | $906 | $1.17 | 43d | 2 | 0.47mi |
| 2209 Ransdell St Indianapolis, IN | 2.0 | 1.0 | 710 | $900 | $1.27 | 43d | 1 | 0.47mi |
| 2109 Singleton St Indianapolis, IN | 3.0 | 2.0 | 1340 | $2,100 | $1.57 | 7d | 1 | 0.67mi |
| 1011 E Raymond St Indianapolis, IN | 2.0 | 2.0 | 1100 | $1,350 | $1.23 | 23d | 1 | 0.74mi |
| 1144 McDougal St Indianapolis, IN | 3.0 | 1.0 | 876 | $1,500 | $1.71 | 21d | 1 | 0.79mi |
| 2948 Shelby St Unit D Indianapolis, IN | 2.0 | 1.0 | 750 | $1,025 | $1.37 | 43d | 1 | 0.80mi |
| 438 E Beecher St Indianapolis, IN | 3.0 | 2.5 | 1500 | $1,450 | $0.97 | 23d | 1 | 0.83mi |
| 620 E Beecher St Indianapolis, IN | 3.0 | 2.0 | 1072 | $1,639 | $1.53 | 20d | 1 | 0.85mi |
| 1819 Union St Unit 1817 Indianapolis, IN | 3.0 | 2.0 | 1020 | $1,199 | $1.18 | 43d | 1 | 0.90mi |
| 1756 Delaware St Indianapolis, IN | 3.0 | 2.0 | 1014 | $1,300 | $1.28 | 43d | 1 | 0.92mi |
| 1756 S Delaware St Unit 1754 Indianapolis, IN | 3.0 | 2.0 | 1014 | $1,300 | $1.28 | 14d | 1 | 0.92mi |
| 1833 Orleans St Unit 1 Indianapolis, IN | 3.0 | 1.0 | 1260 | $1,350 | $1.07 | 43d | 1 | 0.93mi |
| 224 Iowa St Indianapolis, IN | 3.0 | 1.0 | 1254 | $1,450 | $1.16 | 23d | 1 | 0.95mi |
| 823 Iowa St Indianapolis, IN | 2.0 | 1.0 | 812 | $1,100 | $1.35 | 43d | 1 | 1.01mi |
| 1549 Nelson Ave Indianapolis, IN | 3.0 | 1.0 | 950 | $1,380 | $1.45 | 43d | 1 | 1.03mi |
| 1861 Barth Ave Unit 1861 Indianapolis, IN | 2.0 | 1.0 | 1300 | $1,600 | $1.23 | 23d | 1 | 1.04mi |
| 512 E Minnesota St Unit 203 Indianapolis, IN | 2.0 | 1.0 | 903 | $1,195 | $1.32 | 23d | 1 | 1.04mi |
| 3312 Olive St Indianapolis, IN | 3.0 | 2.0 | 1000 | $1,395 | $1.40 | 23d | 1 | 1.11mi |
| 2020 Boyd Ave Indianapolis, IN | 3.0 | 1.5 | 1160 | $1,450 | $1.25 | 23d | 1 | 1.11mi |
| 2018 Boyd Ave Indianapolis, IN | 3.0 | 1.5 | 1160 | $1,350 | $1.16 | 43d | 1 | 1.11mi |
| 1637 Hoefgen St Indianapolis, IN | 2.0 | 1.0 | 780 | $1,000 | $1.28 | 43d | 1 | 1.12mi |
| 1604 E Kelly St Indianapolis, IN | 2.0 | 1.0 | 750 | $1,025 | $1.37 | 17d | 1 | 1.13mi |
| 1604 E Kelly St Indianapolis, IN | 2.0 | 1.0 | 800 | $1,025 | $1.28 | 10d | 1 | 1.13mi |
| 944 E Minnesota St Indianapolis, IN | 2.0 | 2.0 | 944 | $1,299 | $1.38 | 43d | 1 | 1.14mi |
| 3311 Linden St Indianapolis, IN | 3.0 | 1.0 | 1056 | $1,150 | $1.09 | 43d | 1 | 1.14mi |
| 1436 S New Jersey St Unit A Indianapolis, IN | 3.0 | 2.5 | 1300 | $2,100 | $1.62 | 23d | 1 | 1.18mi |
| 1439 South East St Indianapolis, IN | 2.0 | 2.0 | 1114 | $1,425 | $1.28 | 20d | 1 | 1.19mi |
| 1437 S East St Indianapolis, IN | 2.0 | 2.0 | 1114 | $1,425 | $1.28 | 43d | 1 | 1.19mi |
| 3334 Laurel St Indianapolis, IN | 3.0 | 1.0 | 1068 | $1,200 | $1.12 | 20d | 1 | 1.20mi |
| 835 Weghorst St Unit 837 Indianapolis, IN | 3.0 | 1.5 | 1500 | $1,399 | $0.93 | 23d | 1 | 1.21mi |
| 1409 S Alabama St Indianapolis, IN | 2.0 | 1.0 | 949 | $1,245 | $1.31 | 43d | 1 | 1.23mi |
| 1621 Knox St Indianapolis, IN | 4.0 | 2.0 | 1411 | $930 | $0.66 | 4d | 1 | 1.23mi |
Listing history 23 events
-
2026-06-18days on market $205,000 Active 313 DOM
-
2026-06-17days on market $205,000 Active 312 DOM
-
2026-06-16days on market $205,000 Active 311 DOM
-
2026-06-15days on market $205,000 Active 310 DOM
-
2026-06-13days on market $205,000 Active 308 DOM
-
2026-06-13days on market $205,000 Active 307 DOM
-
2026-06-09days on market $205,000 Active 304 DOM
-
2026-06-08days on market $205,000 Active 303 DOM
-
2026-06-07days on market $205,000 Active 302 DOM
-
2026-06-03days on market $205,000 Active 298 DOM
-
2026-06-02days on market $205,000 Active 297 DOM
-
2026-06-01days on market $205,000 Active 296 DOM
-
2026-05-31days on market $205,000 Active 295 DOM
-
2026-05-07status Active 1229-char remark
Show marketing remark (1229 chars)
Don't miss this exceptional duplex located in the highly desirable Garfield Park area! With significant investment and revitalization efforts underway, this is a prime opportunity to secure a property in a flourishing neighborhood. Perfect for a first-time homebuyer that wants to use a renovation loan to buy and renovate, or an newer investor that could live on one side and rent the other side out. This duplex is currently occupied by tenants who are on a month-to-month lease, providing $1,950 total/month, with market rent potential of $2,420 total/month. Addresses are 301 and 303 E Southern Ave. Recent updates to the property include a newer roof, fresh paint, modern light fixtures, updated appliances, and renovated kitchen and bathroom, ensuring it's attractive to tenants and requires minimal upkeep. Located conveniently on the west side, this property offers easy access to a variety of amenities, including schools, parks, and shopping centers. Enjoy seamless connectivity to S Meridian St, Raymond St, Madison Ave, and highways I-70/65. Major employment hubs such as 16 Tech, IU Health Methodist Hospital, Eli Lilly, and downtown Indianapolis are just a short commute away, enhancing the property's desirability.
-
2026-04-14status Pending 1229-char remark
Show marketing remark (1229 chars)
Don't miss this exceptional duplex located in the highly desirable Garfield Park area! With significant investment and revitalization efforts underway, this is a prime opportunity to secure a property in a flourishing neighborhood. Perfect for a first-time homebuyer that wants to use a renovation loan to buy and renovate, or an newer investor that could live on one side and rent the other side out. This duplex is currently occupied by tenants who are on a month-to-month lease, providing $1,950 total/month, with market rent potential of $2,420 total/month. Addresses are 301 and 303 E Southern Ave. Recent updates to the property include a newer roof, fresh paint, modern light fixtures, updated appliances, and renovated kitchen and bathroom, ensuring it's attractive to tenants and requires minimal upkeep. Located conveniently on the west side, this property offers easy access to a variety of amenities, including schools, parks, and shopping centers. Enjoy seamless connectivity to S Meridian St, Raymond St, Madison Ave, and highways I-70/65. Major employment hubs such as 16 Tech, IU Health Methodist Hospital, Eli Lilly, and downtown Indianapolis are just a short commute away, enhancing the property's desirability.
-
2025-08-15status Active 1229-char remark
Show marketing remark (1229 chars)
Don't miss this exceptional duplex located in the highly desirable Garfield Park area! With significant investment and revitalization efforts underway, this is a prime opportunity to secure a property in a flourishing neighborhood. Perfect for a first-time homebuyer that wants to use a renovation loan to buy and renovate, or an newer investor that could live on one side and rent the other side out. This duplex is currently occupied by tenants who are on a month-to-month lease, providing $1,950 total/month, with market rent potential of $2,420 total/month. Addresses are 301 and 303 E Southern Ave. Recent updates to the property include a newer roof, fresh paint, modern light fixtures, updated appliances, and renovated kitchen and bathroom, ensuring it's attractive to tenants and requires minimal upkeep. Located conveniently on the west side, this property offers easy access to a variety of amenities, including schools, parks, and shopping centers. Enjoy seamless connectivity to S Meridian St, Raymond St, Madison Ave, and highways I-70/65. Major employment hubs such as 16 Tech, IU Health Methodist Hospital, Eli Lilly, and downtown Indianapolis are just a short commute away, enhancing the property's desirability.
-
2025-07-16$205,000 Active 1229-char remark
Show marketing remark (1229 chars)
Don't miss this exceptional duplex located in the highly desirable Garfield Park area! With significant investment and revitalization efforts underway, this is a prime opportunity to secure a property in a flourishing neighborhood. Perfect for a first-time homebuyer that wants to use a renovation loan to buy and renovate, or an newer investor that could live on one side and rent the other side out. This duplex is currently occupied by tenants who are on a month-to-month lease, providing $1,950 total/month, with market rent potential of $2,420 total/month. Addresses are 301 and 303 E Southern Ave. Recent updates to the property include a newer roof, fresh paint, modern light fixtures, updated appliances, and renovated kitchen and bathroom, ensuring it's attractive to tenants and requires minimal upkeep. Located conveniently on the west side, this property offers easy access to a variety of amenities, including schools, parks, and shopping centers. Enjoy seamless connectivity to S Meridian St, Raymond St, Madison Ave, and highways I-70/65. Major employment hubs such as 16 Tech, IU Health Methodist Hospital, Eli Lilly, and downtown Indianapolis are just a short commute away, enhancing the property's desirability.
-
2012-08-28historical
-
2012-02-27$62,000
-
2010-09-13historical
-
2010-04-15$49,900
-
2006-05-16soldstatus $24,000
-
2005-11-17$22,900
ⓘ Source: listings_history table (triggers on properties + properties_extension) + one-shot
backfill from property_details.listing_events for pre-trigger history.
Tax reassessment forecast IN · Partial reset (capped growth)
- Current annual tax
- $4,646 · $387/mo
- Projected year-2 tax
- $4,646 · $387/mo
- Expected delta
- $0/yr ($0/mo · 0.0%)
ⓘ Screening estimate from a state-policy table — verify with the county assessor before closing.
Climate risk First Street
- Flood 1/10 Low FEMA zone X (unshaded) · 0% chance over 30 yrs
- Wildfire 1/10 Low
- Heat 4/10 Moderate 7 d/yr ≥101°F today · 19 d/yr by 30 yrs out
- Wind 2/10 Low 0% chance of damaging wind over 30 yrs
- Air quality 3/10 Moderate 2 unhealthy d/yr today · 3 by 30 yrs out
Nearby sold comps map
Loading sold comps map…
Walkable amenities ~0.75 mi
Loading nearby amenities…
Taxation est. · year 1
- Rental income
- $30,492
- − Mortgage interest
- −$11,483
- − Property taxes
- −$4,646
- − Insurance
- −$1,025
- − Repairs & maintenance
- −$2,439
- − Management
- −$2,439
- − Depreciation
- −$5,964
- Taxable income
- $2,495
- Est. tax owed @ 24.0%
- −$599
- After-tax cash flow
- $4,918/yr
For passive investors: Depreciation is non-cash, so a rental often shows a tax loss while cash-flowing — sheltering income. Rental losses are passive: they offset passive income freely, and up to $25,000/yr can offset ordinary (W-2) income if you actively participate and your MAGI is under $100k (phasing out to $0 by $150k); unused losses carry forward. On sale, claimed depreciation is recaptured at up to 25%, and gains may owe capital-gains tax (a 1031 exchange can defer both). Figures are a year-1 estimate at your 24.0% rate — not tax advice; consult a CPA.
Schools (NCES district)
- District
- Indianapolis Public Schools
- NCES district ID
- 1804770
- Math proficiency
- 14% ▼ -7.00%
- Reading proficiency
- 20% ▼ -3.00%
- Median HH income
- $32,034
- Composite
- 13.69/100
- National rank
- #9499
- State rank
- #286 of 301 in IN
Livability — Indianapolis city (balance)
No livability data for this city. (Only ~50 U.S. cities are tracked.)
Census & demographics
- Census place
- Indianapolis city (balance), IN
- County
- Marion County · 998,460 people
- City population
- 881,119
- Metro
- Indianapolis-Carmel-Anderson, IN
- Population (ZIP)
- 6,037
- Household income
- $55,190
- Rent vs Own
- Severe rent burden
- 311.0
Population outlook (Marion County) Hauer SSP2
- Today (2025)
- 1,025,572 people
- By 2030
- 1,065,727 · +3.9%
- By 2040
- 1,141,577 · +11.3%
- By 2050
- 1,208,920 · +17.9%
- By 2075
- 1,367,288 · +33.3%
- By 2100
- 1,438,201 · +40.2%
Race, ethnicity, and origin ACS 2023
- Neighborhood character
- Predominantly White (68%)
- Race & ethnicity
- White 68% Two or more races 12% Black 11% Hispanic / Latino 10% Asian 2%
- Hispanic origin (detail)
- Mexican 6%
- Common ancestry
- Romanian 2% Italian 2% Slovak 1%
- Foreign-born
- 9% · Canada
- Languages at home
- 88% English-only · Spanish 10% German/W. Germanic 1%
Political lean MEDSL · Marion
- 2024 margin
- Strong D (+27.7) · D 63.0% · R 35.3% · Other 1.7%
- 2008→2024 swing
- -0.7pp no change · 2008: 28.4pp · 2024: 27.7pp
- All cycles
- 2024: D+27.7 2020: D+29.1 2016: D+22.8 2012: D+22.2 2008: D+28.4
Not yet ingested
- Civics
- —
Market trends
- HPI YoY
- ▼ -36.19%
- Current HPI
- 403.9271
- Rent YoY
- ▲ 10.98%
- Metro
- Indianapolis-Carmel-Anderson, IN
- State GDP YoY
- ▲ 2.90%
- F500 in state
- 18
Industry mix (Fortune 500 HQ in IN)
| Industry | F500 HQs | Revenue |
|---|---|---|
| Industrial Machinery | 2 | $37B |
|
||
| Healthcare | 1 | $177B |
|
||
| Pharmaceuticals | 1 | $45B |
|
||
| Metals / Steel | 1 | $18B |
|
||
| Agriculture | 1 | $17B |
|
||
| Packaging | 1 | $12B |
|
||
Price history
+795.2% since first listed10 events — show timeline
- 2026-05-07 Relisted — MIBOR as Distributed by MLS Grid
- 2026-04-14 Pending — MIBOR as Distributed by MLS Grid
- 2025-08-15 Relisted — MIBOR as Distributed by MLS Grid
- 2025-07-16 Listed $205,000 MIBOR as Distributed by MLS Grid
- 2012-08-28 Listing Removed — MIBOR as Distributed by MLS Grid
- 2012-02-27 Listed $62,000 MIBOR as Distributed by MLS Grid
- 2010-09-13 Listing Removed — MIBOR as Distributed by MLS Grid
- 2010-04-15 Listed $49,900 MIBOR as Distributed by MLS Grid
- 2006-05-16 Sold (MLS) $24,000 MIBOR as Distributed by MLS Grid
- 2005-11-17 Listed $22,900 MIBOR as Distributed by MLS Grid
Property tax history
+27.0%/yrLatest (2025): $4,646 · +9.4% YoY. Source: county tax records.
Cash-flow waterfall
monthlySold comps — $/sqft
last 12 mo · ≤1 miLoading sold comps…