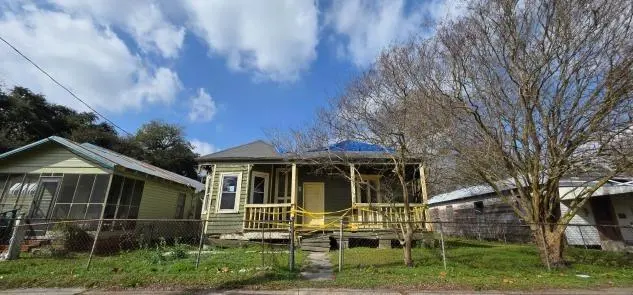
518 Saint Patrick St · Donaldsonville, LA
Flood risk 1/10 · Minimal
- FEMA flood zone
- X
- Chance of flooding over 30 yrs
- 0.0%
- Est. flood insurance / yr
- $507 – $1,088
Fire risk 1/10 · Minimal
- Est. fire insurance / yr
- $1,269 – $2,357
Heat risk 8/10 · Major
- Hot days now (above 107°F)
- 7 days/yr
- Hot days in 30 yrs
- 21 days/yr
Wind risk 9/10 · Severe
- Chance of severe wind over 30 yrs
- 99.0%
Air-quality risk 3/10 · Minor
- Unhealthy air days now
- 2 days/yr
- Unhealthy air days in 30 yrs
- 3 days/yr
Risk factors via First Street. Map © Google.
Why this score? — see what drove the B grade
The composite is a weighted blend of 9 inputs, each scored 0–100. Each bar is that input's sub-score; the figure is the points it added to the 100-point composite (weight × sub-score).
- Cash flow +30.0/30.0
- 1% rule +10.0/10.0
- DSCR +10.0/10.0
- ARV discount +7.5/15.0
- Schools +4.7/10.0
- Livability +2.9/5.0
- Rent growth +2.5/5.0
- Condition / age +2.5/5.0
- Appreciation +0.0/10.0
$45,000
🖨 Deal sheet (PDF) 📄 Offer letter ✓ Due diligence
Listing remarks MLS
Perfect Investment opportunity in Historic Donaldsonville, LA. 4-bedroom, 1-bathroom sitting on a spacious lot.
Key facts
- 7,405 sq ft lot
- Built 1950
- Listed 164 days
Neighborhood map
What this means for you Summary
Snapshot
- This is a 4-bed/1.0-bath single-family listed at $45k.
Deal economics
- At list price, monthly cash flow is $1k ($13k/yr) — positive.
- The deal already cash-flows at list — no discount required.
- Meets the 1% rule at list price ($2k rent vs $45k).
- Recommended offer: $40k (12.0% below list) — sets the bar for market timing.
Location & tenants
- Location reads 58/100 on livability (#292 in LA) — a working-class tenant base; expect higher turnover. Strengths: cost of living A+, health & safety A; Watch: crime F, amenities F, commute F.
- Ascension Parish (suburban): math 48% / reading 58% proficiency, ranked #7 of 98 in LA (top 7%) — acceptable for families but not a draw, mixed tenant base, ~2y average lease.
- Zoned schools: Donaldsonville Primary School (432 students, 89% FRL); Lowery Middle School (math 7% / reading 21%, grade F, #187 of 218 statewide, top 86%, 295 students, 86% FRL); Donaldsonville High School (math 22% / reading 27%, grade F, #153 of 265 statewide, top 62%, 435 students, 85% FRL) — zoned schools average 87% FRL vs 44% district-wide (42 pts higher); higher-poverty schools than district average — tighter screening recommended.
- Zoned-school proficiency averages 19% at this address vs 53% district-wide (-34 pts) — the specific schools serving this property underperform the Ascension Parish average; the district grade overstates school quality for this exact location.
- Market conditions: 33 active listings in the ZIP; 579 units permitted in Ascension Parish in 2024 (0 in 5+ unit buildings).
Forward outlook
- Local home prices are declining (-3.0%/yr); year-one equity from $311 of loan paydown is wiped out by about $1k of value loss. Plan a longer hold.
- Ascension County population projected at +43% by 2050 — long-run rental-demand tailwind backs the buy-and-hold thesis.
- At projected returns (-3.0% appreciation + 3.0% rent growth), your $13k cash investment doubles in ~2 years — after that, you're playing with house money.
Negotiation context
- It's been on market 164 days — a 12% lower offer ($40k) is reasonable based on typical stale-listing flexibility.
- 2 sale attempts since 27y ago; this cycle's ask has dropped $15k (25%) from the opening price — seller is motivated, your offer sets the floor, not the list.
Risks & watch-outs
- Watch-outs: built in 1950 — expect roof / HVAC / electrical / plumbing capex.
- Climate carrying-cost: severe wind risk, 99% chance of damaging wind over 30y; extreme-heat days projected 7→21/yr by 2055 (HVAC capex compounding) — expect insurance premiums to compound above CPI over the hold.
Questions for the listing agent
- It's been on market 164 days. Have you received any prior offers? Is the seller open to a 12% concession, seller financing, or rate buy-down credit?
- Built in 1950 — when were the roof, HVAC, electrical panel, plumbing, and water heater last replaced?
- Why hasn't it sold? Are there any deal-killer items the seller is aware of (foundation, flood, title, zoning, code violations)?
- Is there a deadline driving the sale (1031 exchange, divorce, estate, relocation)? That informs how much negotiation room exists.
- Schools are D-rated, which usually means shorter tenancies and higher turnover. Who's the typical renter profile here, and what's been the actual vacancy rate?
- Crime grade is F in this area — have there been break-ins, vandalism, or insurance claims at this property in the last 3 years? What carrier currently insures it and at what premium?
- What's the average days-on-market for RENTAL listings here right now (not sales)? A rising rental-DOM trend means longer vacancies and softer asking-rent achievability than the comps imply.
- What's the recent tenant-quality profile in this submarket — average credit score on applications, eviction rate, late-payment / NSF rate, and stable-employment percentage? A property-management company in the area should have these aggregated.
- How much new for-sale + rental construction is in the pipeline within 1–3 miles? Heavy new supply typically softens prices + rents 12–24 months out; constrained supply supports both.
Investment metrics
- 1% rule
- 3.70% ✓
- Cap rate
- 34.08%
- Cash-on-cash
- 99.26%
- DSCR
- 5.42
- GRM
- 2.3
CMA / ARV
- ARV (median comp)
- $206,322
- List price
- $45,000
- Delta
- -78.19%
- Verdict
- UNDERPRICED
- Comps
- 20 within 1.0 mi
Show comp detail 6 sales within ~0.75 mi
| Address | Dist | Beds/Ba | Sqft | Sold | Price | $/sf | Match |
|---|---|---|---|---|---|---|---|
| 1327 Marshland Ave | 0.60mi | 3/2.0 (-1) | 1,564 (-2%) | 1mo | $274,065 | $175 | 59 |
| 318 Opelousas St | 0.20mi | 3/2.0 (-1) | 1,635 (+3%) | 23mo | $75,000 | $46 | 58 |
| 600 Lee Ave | 0.25mi | 3/1.0 (-1) | 1,416 (-11%) | 10mo | $163,000 | $115 | 57 |
| 1451 Marshland Ave | 0.68mi | 3/2.0 (-1) | 1,690 (+6%) | 1mo | $289,410 | $171 | 48 |
| 1440 Marshland Ave | 0.69mi | 4/2.5 | 1,788 (+12%) | 0mo | $292,547 | $164 | 41 |
| 310 Gardenia Dr | 0.64mi | 3/2.0 (-1) | 1,462 (-8%) | 21mo | $189,500 | $130 | 30 |
Match score weights: distance 35% · size 25% · config 20% · recency 20%. Top-matched comps best support the ARV.
Projected returns pro-forma
-3.0% appreciation · 3.0% rent growth · sell at horizon
- IRR
- —
- Equity multiple
- 5.69×
- Total profit
- $59,087
- Equity at exit
- $6,710
- IRR
- —
- Equity multiple
- 11.87×
- Total profit
- $136,928
- Equity at exit
- $3,891
Cash invested: $12,600 (down + closing). Projections, not guarantees.
Landlord ↔ Tenant lean methodology
- Overall (STATE)
- 90 Strongly Landlord-Friendly
- State Louisiana
- 90 Strongly Landlord-Friendly · R+12
- County
- — inherits STATE
- City
- — inherits STATE
ZIP-level market 70346
- Home prices YoY
- -34.5%
- Active inventory
- 33
- Price-to-rent
- 2.3×
Monthly cashflow live
- Estimated rent
- $1,663 medium interval (Pro) →
- Mortgage (P&I)
- −$236
- Tax from tax record
- −$17 /mo · $203/yr
- Insurance
- −$19
- HOA
- −$0
- Vacancy / Maint / Mgmt
- −$349
- Net cashflow
- $1,042
Break-even live
Sensitivity live
| Price | -10% $1,068 | -5% $1,055 | +0% $1,042 | +5% $1,029 | +10% $1,017 |
|---|---|---|---|---|---|
| Rent | -10% $911 | -5% $977 | +0% $1,042 | +5% $1,108 | +10% $1,174 |
| Rate | -1.0pp $1,065 | -0.5pp $1,054 | base $1,042 | +0.5pp $1,031 | +1.0pp $1,019 |
UW: 25.0% down · 7.5% · 30yr · 1.5% tax · 5.0% vac · 8.0% maint · 8.0% mgmt
Financing live
Cash to close
- Down payment
- $11,250
- Closing costs
- $1,350
- Reserves months
- —
- Total cash needed
- —
Loan-product check · same deal, 3 products live
Conventional
25% down · 7.5% · 30yr
- Down + closing
- —
- Monthly P&I
- —
- Monthly cashflow
- —
- DSCR
- —
- Eligible?
- —
Personal DTI + credit; lowest rate.
DSCR
20% down · 8.5% · 30yr
- Down + closing
- —
- Monthly P&I
- —
- Monthly cashflow
- —
- DSCR
- —
- Eligible?
- —
No personal income docs; deal must DSCR.
Hard money
10% down · 12.0% · 12mo
- Down + closing
- —
- Monthly P&I
- —
- Monthly cashflow
- —
- DSCR
- —
- Eligible?
- —
Short-term bridge; refi at stabilization.
Listing history 22 events
-
2026-06-21days on market $45,000 Active 164 DOM
-
2026-06-18days on market $45,000 Active 161 DOM
-
2026-06-17days on market $45,000 Active 160 DOM
-
2026-06-16days on market $45,000 Active 159 DOM
-
2026-06-15days on market $45,000 Active 158 DOM
-
2026-06-14days on market $45,000 Active 156 DOM
-
2026-06-10days on market $45,000 Active 153 DOM
-
2026-06-09days on market $45,000 Active 152 DOM
-
2026-06-08days on market $45,000 Active 151 DOM
-
2026-06-07days on market $45,000 Active 150 DOM
-
2026-06-05days on market $45,000 Active 147 DOM
-
2026-06-03days on market $45,000 Active 146 DOM
-
2026-06-02days on market $45,000 Active 145 DOM
-
2026-06-01days on market $45,000 Active 144 DOM
-
2026-05-31days on market $45,000 Active 143 DOM
-
2026-05-31days on market $45,000 Active 142 DOM
-
2026-04-16price $45,000 111-char remark
Show marketing remark (111 chars)
Perfect Investment opportunity in Historic Donaldsonville, LA. 4-bedroom, 1-bathroom sitting on a spacious lot.
-
2026-03-16price $50,000 111-char remark
Show marketing remark (111 chars)
Perfect Investment opportunity in Historic Donaldsonville, LA. 4-bedroom, 1-bathroom sitting on a spacious lot.
-
2026-02-11price $55,000 111-char remark
Show marketing remark (111 chars)
Perfect Investment opportunity in Historic Donaldsonville, LA. 4-bedroom, 1-bathroom sitting on a spacious lot.
-
2026-01-06$60,000 Active 111-char remark
Show marketing remark (111 chars)
Perfect Investment opportunity in Historic Donaldsonville, LA. 4-bedroom, 1-bathroom sitting on a spacious lot.
-
2005-02-14soldstatus $58,703
-
1999-08-07$29,900
ⓘ Source: listings_history table (triggers on properties + properties_extension) + one-shot
backfill from property_details.listing_events for pre-trigger history.
Tax reassessment forecast LA · Resets to sale price
- Current annual tax
- $203 · $17/mo
- Projected year-2 tax
- $247 · $21/mo
- Expected delta
- +$44/yr (+$4/mo · 21.7%)
ⓘ Screening estimate from a state-policy table — verify with the county assessor before closing.
Climate risk First Street
- Flood 1/10 Low FEMA zone X · 0% chance over 30 yrs
- Wildfire 1/10 Low
- Heat 8/10 Severe 7 d/yr ≥107°F today · 21 d/yr by 30 yrs out
- Wind 9/10 Extreme 99% chance of damaging wind over 30 yrs
- Air quality 3/10 Moderate 2 unhealthy d/yr today · 3 by 30 yrs out
Nearby sold comps map
Loading sold comps map…
Walkable amenities ~0.75 mi
Loading nearby amenities…
Taxation est. · year 1
- Rental income
- $19,958
- − Mortgage interest
- −$2,521
- − Property taxes
- −$203
- − Insurance
- −$225
- − Repairs & maintenance
- −$1,597
- − Management
- −$1,597
- − Depreciation
- −$1,309
- Taxable income
- $12,506
- Est. tax owed @ 24.0%
- −$3,001
- After-tax cash flow
- $9,505/yr
For passive investors: Depreciation is non-cash, so a rental often shows a tax loss while cash-flowing — sheltering income. Rental losses are passive: they offset passive income freely, and up to $25,000/yr can offset ordinary (W-2) income if you actively participate and your MAGI is under $100k (phasing out to $0 by $150k); unused losses carry forward. On sale, claimed depreciation is recaptured at up to 25%, and gains may owe capital-gains tax (a 1031 exchange can defer both). Figures are a year-1 estimate at your 24.0% rate — not tax advice; consult a CPA.
Schools (NCES district)
- District
- Ascension Parish
- NCES district ID
- 2200090
- Math proficiency
- 48% ▼ -31.00%
- Reading proficiency
- 58% ▼ -25.00%
- Median HH income
- $68,423
- Composite
- 47.0/100
- National rank
- #2347
- State rank
- #7 of 98 in LA
Livability — Donaldsonville
- Score
- 58/100
- State rank
- #292
- US rank
- #20697
Category grades
Schools grade is shown separately in the Schools card above.
Census & demographics
- Census place
- Donaldsonville, LA
- Population (ZIP)
- 9,831
Population outlook (Ascension County) Hauer SSP2
- Today (2025)
- 145,480 people
- By 2030
- 158,329 · +8.8%
- By 2040
- 183,741 · +26.3%
- By 2050
- 207,615 · +42.7%
- By 2075
- 260,244 · +78.9%
- By 2100
- 289,576 · +99.0%
Race, ethnicity, and origin ACS 2023
- Neighborhood character
- Predominantly Black (68%)
- Race & ethnicity
- Black 68% White 27% Hispanic / Latino 3% Two or more races 2%
- Common ancestry
- Lithuanian 8%
- Foreign-born
- 1% · Vietnam
- Languages at home
- 98% English-only · Spanish 1% French/Haitian/Cajun 1%
Political lean MEDSL · Ascension
- 2024 margin
- Solid R (+34.0) · D 32.2% · R 66.1% · Other 1.7%
- 2008→2024 swing
- +1.7pp toward D · 2008: -35.7pp · 2024: -34.0pp
- All cycles
- 2024: R+34.0 2020: R+32.5 2016: R+36.0 2012: R+34.3 2008: R+35.7
Not yet ingested
- Civics
- —
Market trends
- HPI YoY
- ▼ -68.89%
- Current HPI
- 130.5878
- Rent YoY
- —
- Metro
- —
- State GDP YoY
- ▲ 3.29%
- F500 in state
- 10
Industry mix (Fortune 500 HQ in LA)
| Industry | F500 HQs | Revenue |
|---|---|---|
| Telecommunications | 2 | $23B |
|
||
| Utilities | 1 | $12B |
|
||
| Wholesale / Distribution | 1 | $5B |
|
||
| Advertising | 1 | $2B |
|
||
Price history
+50.5% since first listed6 events — show timeline
- 2026-04-16 Price Changed $45,000 AcadianaMLS
- 2026-03-16 Price Changed $50,000 AcadianaMLS
- 2026-02-11 Price Changed $55,000 AcadianaMLS
- 2026-01-06 Listed $60,000 AcadianaMLS
- 2005-02-14 Sold (Public Records) $58,703 Public Records
- 1999-08-07 Listed $29,900 AcadianaMLS
Property tax history
+1.7%/yrLatest (2025): $203 · -1.5% YoY. Source: county tax records.
Cash-flow waterfall
monthlySold comps — $/sqft
last 12 mo · ≤1 miLoading sold comps…