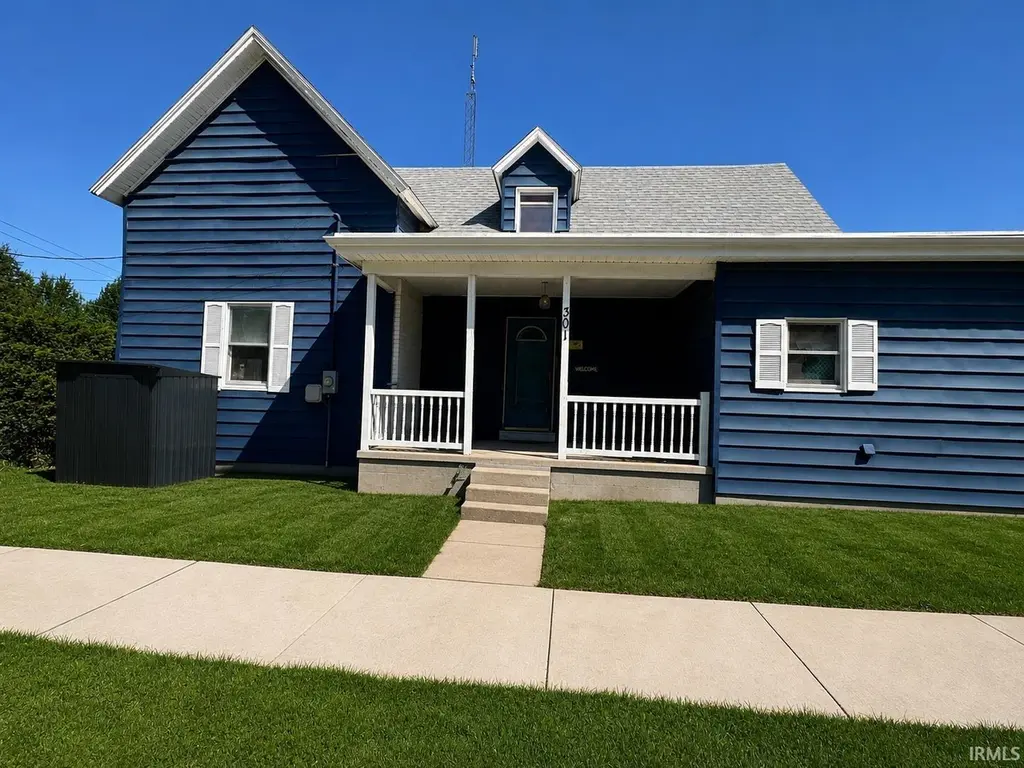
301 E E Sycamore St · Silver Lake, IN
Flood risk 1/10 · Minimal
- FEMA flood zone
- X (unshaded)
- Chance of flooding over 30 yrs
- 0.0%
- Est. flood insurance / yr
- $473 – $860
Fire risk 1/10 · Minimal
- Est. fire insurance / yr
- $717 – $1,331
Heat risk 3/10 · Minor
- Hot days now (above 100°F)
- 7 days/yr
- Hot days in 30 yrs
- 16 days/yr
Wind risk 2/10 · Minimal
- Chance of severe wind over 30 yrs
- —
Air-quality risk 3/10 · Minor
- Unhealthy air days now
- 2 days/yr
- Unhealthy air days in 30 yrs
- 3 days/yr
Risk factors via First Street. Map © Google.
Why this score? — see what drove the A- grade
The composite is a weighted blend of 9 inputs, each scored 0–100. Each bar is that input's sub-score; the figure is the points it added to the 100-point composite (weight × sub-score).
- Cash flow +29.9/30.0
- ARV discount +15.0/15.0
- DSCR +10.0/10.0
- 1% rule +7.6/10.0
- Appreciation +6.4/10.0
- Schools +4.1/10.0
- Livability +3.4/5.0
- Rent growth +2.5/5.0
- Condition / age +2.5/5.0
$98,900
🖨 Deal sheet (PDF) 📄 Offer letter ✓ Due diligence
Listing remarks
Step into a home with classic character and flexible living spaces, where upstairs walkthrough rooms and a creative bedroom conversion offer unique options for families or investors. The spacious 1,742 sqft layout sits on a generous 0.4-acre lot, featuring an attached 2-car garage, city utilities, and a newer roof for peace of mind. With original windows ready for your custom upgrades and a solid mechanical foundation including boiler heat and an updated electrical panel, this property is perfect for those looking to add value or personalize their next investment. Move-in ready with room to make it your own. Property is being sold As-Is
Key facts
- Generous lot
- Newer roof
- Original windows
Tags
Property features AI
Exterior
- Parking: Attached 2-car garage
- Utilities: Public water; Public sewer
- Home design: Single-family, site-built home; 2 stories
- Construction: Vinyl siding; Asphalt construction material
- Exterior features: Level lot; Lot dimensions about 66 x 132
Interior
- Bathrooms: 1 full bathroom (main level)
- Heating & cooling: No cooling
- Interior features: Crawl space basement (unfinished)
- Laundry & utility: Laundry on main level
Neighborhood map
What this means for you Summary
Snapshot
- This is a 3-bed/1.0-bath single-family listed at $99k.
Deal economics
- At list price, monthly cash flow is $365 ($4k/yr) — positive.
- The deal already cash-flows at list — no discount required.
- Meets the 1% rule at list price ($1k rent vs $99k).
Location & tenants
- Location reads 68/100 on livability (#208 in IN) — a middle-class / working-renter tenant base. Strengths: crime A+, cost of living A+, housing A+; Watch: employment C-, schools F, amenities F.
- Warsaw Community Schools (town): math 45% / reading 49% proficiency, ranked #78 of 301 in IN (top 26%) — families likely to look elsewhere, expect single-tenant / working-renter base with shorter leases.
- Market conditions: 10 active listings in the ZIP; 261 units permitted in Kosciusko County in 2024 (10 in 5+ unit buildings).
Forward outlook
- In year one you build about $3k of equity ($684 loan paydown + $3k appreciation (2.8% local appreciation)).
- Kosciusko County population projected at +3% by 2050 — modest demand growth; plan on rents tracking national, not racing it.
- At projected returns (2.8% appreciation + 3.0% rent growth), your $28k cash investment doubles in ~4 years — after that, you're playing with house money.
- By year 10, paydown + projected appreciation supports a ~$34k cash-out refi (75% LTV) — recoverable capital for the next deal without selling this one.
Negotiation context
- Only 12 days on market — expect competitive offers; lowballing is unlikely to land.
- 2 sale attempts with the ask held roughly flat each time — persistent listings suggest the price (not the market) is what's stuck; bring a comps-based counter.
Risks & watch-outs
- Watch-outs: built in 1880 — expect roof / HVAC / electrical / plumbing capex.
Questions for the listing agent
- Built in 1880 — when were the roof, HVAC, electrical panel, plumbing, and water heater last replaced?
- Is there a deadline driving the sale (1031 exchange, divorce, estate, relocation)? That informs how much negotiation room exists.
- Schools are F-rated, which usually means shorter tenancies and higher turnover. Who's the typical renter profile here, and what's been the actual vacancy rate?
- What's the average days-on-market for RENTAL listings here right now (not sales)? A rising rental-DOM trend means longer vacancies and softer asking-rent achievability than the comps imply.
- What's the recent tenant-quality profile in this submarket — average credit score on applications, eviction rate, late-payment / NSF rate, and stable-employment percentage? A property-management company in the area should have these aggregated.
- How much new for-sale + rental construction is in the pipeline within 1–3 miles? Heavy new supply typically softens prices + rents 12–24 months out; constrained supply supports both.
Investment metrics
- 1% rule
- 1.26% ✓
- Cap rate
- 10.73%
- Cash-on-cash
- 15.84%
- DSCR
- 1.70
- GRM
- 6.6
CMA / ARV
- ARV (on-the-fly)
- $181,168
- Comps found
- 7
Show comp detail 7 sales within ~0.75 mi
| Address | Dist | Beds/Ba | Sqft | Sold | Price | $/sf | Match |
|---|---|---|---|---|---|---|---|
| 501 E Sycamore St | 0.12mi | 4/1.0 (+1) | 1,791 (+3%) | 4mo | $117,500 | $66 | 81 |
| 106 E Sycamore St | 0.11mi | 3/1.0 | 1,605 (-8%) | 8mo | $172,500 | $107 | 75 |
| 202 E Main St | 0.07mi | 4/2.0 (+1) | 1,832 (+5%) | 5mo | $164,000 | $90 | 75 |
| 501 E Main St | 0.14mi | 3/2.5 | 1,928 (+11%) | 9mo | $199,900 | $104 | 62 |
| 405 W Main St | 0.35mi | 3/1.0 | 1,556 (-11%) | 20mo | $167,900 | $108 | 48 |
| 603 S Jefferson St | 0.43mi | 4/2.0 (+1) | 1,680 (-4%) | 22mo | $148,000 | $88 | 47 |
| 706 W Neher Rd | 0.74mi | 3/2.0 | 1,536 (-12%) | 1mo | $304,900 | $199 | 41 |
Match score weights: distance 35% · size 25% · config 20% · recency 20%. Top-matched comps best support the ARV.
Projected returns pro-forma
2.84% appreciation · 3.0% rent growth · sell at horizon
- IRR
- 22.0%
- Equity multiple
- 2.24×
- Total profit
- $34,314
- Equity at exit
- $43,557
- IRR
- 23.1%
- Equity multiple
- 4.27×
- Total profit
- $90,596
- Equity at exit
- $66,426
Cash invested: $27,692 (down + closing). Projections, not guarantees.
Landlord ↔ Tenant lean methodology
- Overall (STATE)
- 90 Strongly Landlord-Friendly
- State Indiana
- 90 Strongly Landlord-Friendly · R+11
- County
- — inherits STATE
- City
- — inherits STATE
ZIP-level market 46982
- Home prices YoY
- 1.0%
- Active inventory
- 10
- Price-to-rent
- 6.6×
Monthly cashflow live
- Estimated rent
- $1,250 medium interval (Pro) →
- Mortgage (P&I)
- −$519
- Tax from tax record
- −$63 /mo · $750/yr
- Insurance
- −$41
- HOA
- −$0
- Vacancy / Maint / Mgmt
- −$263
- Net cashflow
- $365
Break-even live
Sensitivity live
| Price | -10% $421 | -5% $393 | +0% $365 | +5% $337 | +10% $309 |
|---|---|---|---|---|---|
| Rent | -10% $267 | -5% $316 | +0% $365 | +5% $415 | +10% $464 |
| Rate | -1.0pp $415 | -0.5pp $391 | base $365 | +0.5pp $340 | +1.0pp $314 |
UW: 25.0% down · 7.5% · 30yr · 1.5% tax · 5.0% vac · 8.0% maint · 8.0% mgmt
Financing live
Cash to close
- Down payment
- $24,725
- Closing costs
- $2,967
- Reserves months
- —
- Total cash needed
- —
Loan-product check · same deal, 3 products live
Conventional
25% down · 7.5% · 30yr
- Down + closing
- —
- Monthly P&I
- —
- Monthly cashflow
- —
- DSCR
- —
- Eligible?
- —
Personal DTI + credit; lowest rate.
DSCR
20% down · 8.5% · 30yr
- Down + closing
- —
- Monthly P&I
- —
- Monthly cashflow
- —
- DSCR
- —
- Eligible?
- —
No personal income docs; deal must DSCR.
Hard money
10% down · 12.0% · 12mo
- Down + closing
- —
- Monthly P&I
- —
- Monthly cashflow
- —
- DSCR
- —
- Eligible?
- —
Short-term bridge; refi at stabilization.
Listing history 8 events
-
2026-06-02pricedays on market $98,900 Active 12 DOM
-
2026-06-01days on market $99,900 Active 11 DOM
-
2026-05-31days on market $99,900 Active 10 DOM
-
2026-05-30days on market $99,900 Active 9 DOM
-
2026-05-21$99,900 Active
-
2025-10-26price $109,900
-
2025-10-25price $100,000
-
2025-10-08$129,900 Active
ⓘ Source: listings_history table (triggers on properties + properties_extension) + one-shot
backfill from property_details.listing_events for pre-trigger history.
Tax reassessment forecast IN · Partial reset (capped growth)
- Current annual tax
- $750 · $63/mo
- Projected year-2 tax
- $795 · $66/mo
- Expected delta
- +$45/yr (+$4/mo · 6.0%)
ⓘ Screening estimate from a state-policy table — verify with the county assessor before closing.
Climate risk First Street
- Flood 1/10 Low FEMA zone X (unshaded) · 0% chance over 30 yrs
- Wildfire 1/10 Low
- Heat 3/10 Moderate 7 d/yr ≥100°F today · 16 d/yr by 30 yrs out
- Wind 2/10 Low
- Air quality 3/10 Moderate 2 unhealthy d/yr today · 3 by 30 yrs out
Nearby sold comps map
Loading sold comps map…
Walkable amenities ~0.75 mi
Loading nearby amenities…
Taxation est. · year 1
- Rental income
- $15,005
- − Mortgage interest
- −$5,540
- − Property taxes
- −$750
- − Insurance
- −$494
- − Repairs & maintenance
- −$1,200
- − Management
- −$1,200
- − Depreciation
- −$2,877
- Taxable income
- $2,943
- Est. tax owed @ 24.0%
- −$706
- After-tax cash flow
- $3,679/yr
For passive investors: Depreciation is non-cash, so a rental often shows a tax loss while cash-flowing — sheltering income. Rental losses are passive: they offset passive income freely, and up to $25,000/yr can offset ordinary (W-2) income if you actively participate and your MAGI is under $100k (phasing out to $0 by $150k); unused losses carry forward. On sale, claimed depreciation is recaptured at up to 25%, and gains may owe capital-gains tax (a 1031 exchange can defer both). Figures are a year-1 estimate at your 24.0% rate — not tax advice; consult a CPA.
Schools (NCES district)
- District
- Warsaw Community Schools
- NCES district ID
- 1812420
- Math proficiency
- 45% ▼ -4.00%
- Reading proficiency
- 49% ▬ 0.00%
- Median HH income
- $52,461
- Composite
- 40.53/100
- National rank
- #3705
- State rank
- #78 of 301 in IN
Livability — Silver Lake
- Score
- 68/100
- State rank
- #208
- US rank
- #9160
Category grades
Schools grade is shown separately in the Schools card above.
Census & demographics
- Census place
- Silver Lake, IN
- Population (ZIP)
- 2,653
Population outlook (Kosciusko County) Hauer SSP2
- Today (2025)
- 81,747 people
- By 2030
- 82,878 · +1.4%
- By 2040
- 84,270 · +3.1%
- By 2050
- 84,191 · +3.0%
- By 2075
- 82,918 · +1.4%
- By 2100
- 74,808 · -8.5%
Race, ethnicity, and origin ACS 2023
- Neighborhood character
- Predominantly White (99%)
- Race & ethnicity
- White 99% Two or more races 1%
- Common ancestry
- Italian 2% Slovak 2% Lithuanian 1%
- Foreign-born
- 2% · Canada
- Languages at home
- 99% English-only · Other Indo-European 1%
Political lean MEDSL · Kosciusko
- 2024 margin
- Solid R (+52.3) · D 22.9% · R 75.2% · Other 1.9%
- 2008→2024 swing
- -14.9pp toward R · 2008: -37.3pp · 2024: -52.3pp
- All cycles
- 2024: R+52.3 2020: R+50.7 2016: R+55.1 2012: R+52.2 2008: R+37.3
Not yet ingested
- Civics
- —
Market trends
- HPI YoY
- ▲ 2.84%
- Current HPI
- 278.4323
- Rent YoY
- —
- Metro
- —
- State GDP YoY
- ▲ 2.90%
- F500 in state
- 18
Industry mix (Fortune 500 HQ in IN)
| Industry | F500 HQs | Revenue |
|---|---|---|
| Industrial Machinery | 2 | $37B |
|
||
| Healthcare | 1 | $177B |
|
||
| Pharmaceuticals | 1 | $45B |
|
||
| Metals / Steel | 1 | $18B |
|
||
| Agriculture | 1 | $17B |
|
||
| Packaging | 1 | $12B |
|
||
Price history
-23.9% since first listed5 events — show timeline
- 2026-06-02 Price Changed $98,900 IRMLS
- 2026-05-21 Listed $99,900 IRMLS
- 2025-10-26 Price Changed $109,900 IRMLS
- 2025-10-25 Price Changed $100,000 IRMLS
- 2025-10-08 Listed $129,900 IRMLS
Property tax history
+8.1%/yrLatest (2024): $750 · +3.0% YoY. Source: county tax records.
Cash-flow waterfall
monthlySold comps — $/sqft
last 12 mo · ≤1 miLoading sold comps…