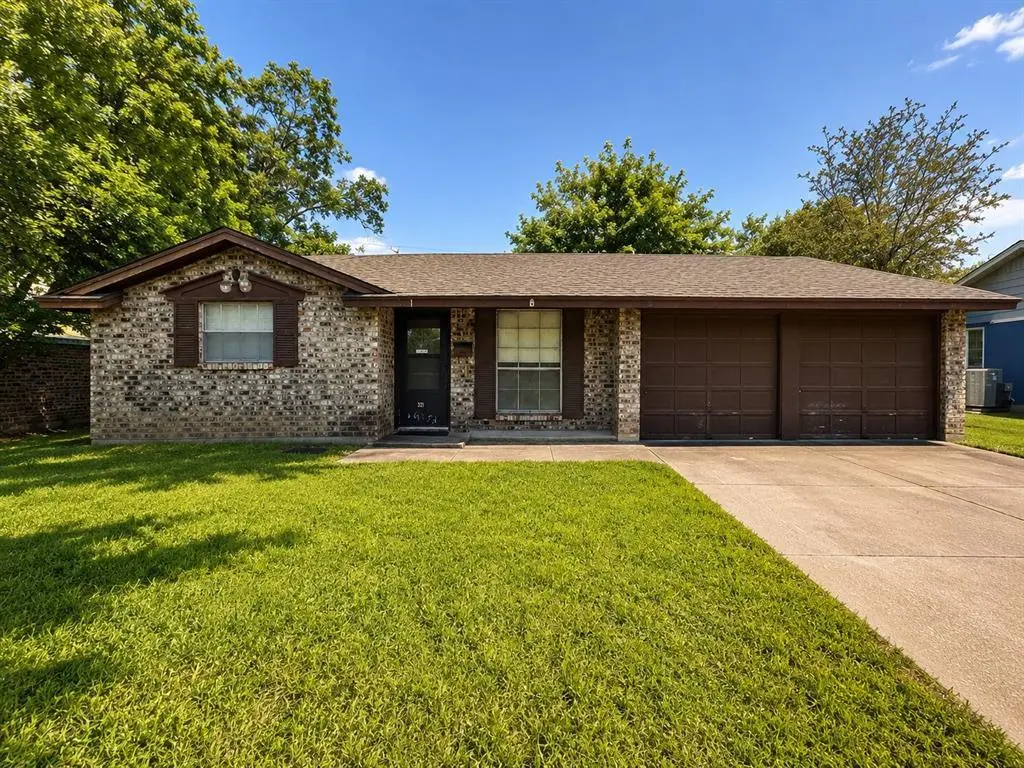
321 NW Wintercrest Rd · Burleson, TX
Flood risk 1/10 · Minimal
- FEMA flood zone
- X (unshaded)
- Chance of flooding over 30 yrs
- 0.0%
- Est. flood insurance / yr
- $507 – $1,088
Fire risk 4/10 · Minor
- Est. fire insurance / yr
- $1,222 – $2,270
Heat risk 7/10 · Major
- Hot days now (above 110°F)
- 7 days/yr
- Hot days in 30 yrs
- 24 days/yr
Wind risk 6/10 · Moderate
- Chance of severe wind over 30 yrs
- 27.0%
Air-quality risk 2/10 · Minimal
- Unhealthy air days now
- 2 days/yr
- Unhealthy air days in 30 yrs
- 2 days/yr
Risk factors via First Street. Map © Google.
Why this score? — see what drove the B- grade
The composite is a weighted blend of 9 inputs, each scored 0–100. Each bar is that input's sub-score; the figure is the points it added to the 100-point composite (weight × sub-score).
- Cash flow +25.4/30.0
- ARV discount +15.0/15.0
- DSCR +8.4/10.0
- 1% rule +7.2/10.0
- Schools +4.0/10.0
- Livability +4.0/5.0
- Rent growth +2.9/5.0
- Condition / age +2.5/5.0
- Appreciation +0.0/10.0
$157,900
🖨 Deal sheet 📄 Offer letter ✓ Due diligence
Listing remarks
Discover this inviting 3-bedroom, 2-bath home located in the heart of Burleson, TX. Nestled in a well-established neighborhood, this is a rare opportunity full of possibilities for homeowners and investors alike. Step inside to find a functional layout featuring two living rooms, offering flexible space for entertaining, relaxing, or creating a home office or media area. The kitchen provides ample cabinet space and flows conveniently into the main living area. The three bedrooms offer comfortable accommodations, while the two bathrooms add everyday convenience, with one currently in the process of being prepped for renovations. Recent updates include a brand-new roof, offering peace of mind
Key facts
- Spacious yard
- Brand-new roof
- Ample cabinet space
Tags
Property features AI
Finance
- Other: Possession at closing/funding; Standard listing conditions; Subdivision: Summercrest
- Financial info: Listing terms include cash and conventional financing; No second mortgage reported
- HOA & community: No homeowners association
Exterior
- Parking: Attached garage with inside entrance; Two covered parking spaces; Garage faces front; Concrete driveway; Alley access; Lighted parking area
- Utilities: City water; City sewer; Electricity connected; Natural gas available; Cable available; Asphalt and concrete streets with curbs
- Home design: Single family residence; Residential property; One story; 1965 construction
- Construction: Brick and wood construction; Composition roof; Slab foundation
- Exterior features: Covered porch(es); Storage; Chain link fence; Few trees; Large backyard with grass; Interior lot in a subdivision
Interior
- Kitchen: Built-in cabinets; Breakfast bar; Dishwasher; Disposal; Gas cooktop; Gas oven
- Bedrooms: Three bedrooms (all on main level); Primary bedroom with built-in desk and ensuite bath; Secondary bedroom with built-in cabinets
- Flooring: Carpet; Vinyl
- Bathrooms: Two full bathrooms
- Heating & cooling: Central heating (natural gas); Central electric air conditioning
- Interior features: Cable TV available; Decorative lighting; High-speed internet available; Two living areas; One dining area; Nine total rooms; One level
- Laundry & utility: Washer hookup; Laundry located in garage; Gas water heater
Neighborhood map
What this means for you Summary
Snapshot
- This is a 3-bed/2.0-bath single-family listed at $158k.
Deal economics
- At list price, monthly cash flow is $364 ($4k/yr) — positive.
- The deal already cash-flows at list — no discount required.
- Meets the 1% rule at list price ($2k rent vs $158k).
- Cap rate 9.1% vs local median 3.5% in Burleson — top-decile yield for the area; either an underpriced asset or a hidden risk that comps aren't pricing in. Stress-test before assuming the spread holds.
Location & tenants
- Location reads 79/100 on livability (#53 in TX, #2,133 nationally) — a middle-class / working-renter tenant base. Strengths: employment A+, cost of living A+, housing A+; Watch: amenities F, commute F.
- Burleson ISD (suburban): math 41% / reading 48% proficiency, ranked #236 of 826 in TX (top 29%) — families likely to look elsewhere, expect single-tenant / working-renter base with shorter leases.
- Zoned schools: Mound El (math 37% / reading 42%, grade F, #1,545 of 4,322 statewide, top 38%, 452 students, 57% FRL) — zoned schools average 57% FRL vs 32% district-wide (25 pts higher); higher-poverty schools than district average — tighter screening recommended.
- Market conditions: Rents rising (+1.8%/yr); 679 active listings in the ZIP; 40 comparable units currently listed for rent nearby; rentals at typical pace (median 25d on market — plan ~3-4 weeks tenant-placement turnaround); solid renter incomes; 2,152 units permitted in Johnson County in 2024 (76 in 5+ unit buildings).
Forward outlook
- Local home prices are declining (-3.0%/yr); year-one equity from $1k of loan paydown is wiped out by about $5k of value loss. Plan a longer hold.
- Johnson County population projected at +24% by 2050 — long-run rental-demand tailwind backs the buy-and-hold thesis.
Negotiation context
- Only 1 days on market — expect competitive offers; lowballing is unlikely to land.
Risks & watch-outs
- Climate carrying-cost: major wind risk, 27% chance of damaging wind over 30y; extreme-heat days projected 7→24/yr by 2055 (HVAC capex compounding) — expect insurance premiums to compound above CPI over the hold.
Questions for the listing agent
- Built in 1965 — when were the roof, HVAC, electrical panel, plumbing, and water heater last replaced?
- Is there a deadline driving the sale (1031 exchange, divorce, estate, relocation)? That informs how much negotiation room exists.
- What's the average days-on-market for RENTAL listings here right now (not sales)? A rising rental-DOM trend means longer vacancies and softer asking-rent achievability than the comps imply.
- What's the recent tenant-quality profile in this submarket — average credit score on applications, eviction rate, late-payment / NSF rate, and stable-employment percentage? A property-management company in the area should have these aggregated.
- How much new for-sale + rental construction is in the pipeline within 1–3 miles? Heavy new supply typically softens prices + rents 12–24 months out; constrained supply supports both.
Investment metrics
- 1% rule
- 1.22% ✓
- Cap rate
- 9.06%
- Cash-on-cash
- 9.87%
- DSCR
- 1.44
- GRM
- 6.8
CMA / ARV
- ARV (on-the-fly)
- $245,856
- Comps found
- 12
Show comp detail 12 sales within ~0.75 mi
| Address | Dist | Beds/Ba | Sqft | Sold | Price | $/sf | Match |
|---|---|---|---|---|---|---|---|
| 321 NW Wintercrest Rd | 0.00mi | 3/2.0 | 1,248 (0%) | 1mo | $157,900 | $127 | 99 |
| 125 NW Jill Ann Dr | 0.30mi | 3/2.0 | 1,240 (-1%) | 1mo | $220,000 | $177 | 84 |
| 913 Jayellen Ct | 0.34mi | 3/2.0 | 1,265 (+1%) | 0mo | $249,000 | $197 | 82 |
| 120 NW Suzanne Ter | 0.33mi | 3/2.0 | 1,310 (+5%) | 2mo | $245,000 | $187 | 75 |
| 341 NW Summercrest Blvd | 0.27mi | 3/2.0 | 1,343 (+8%) | 2mo | $263,000 | $196 | 73 |
| 716 Nicole Dr | 0.45mi | 3/2.0 | 1,200 (-4%) | 1mo | $209,900 | $175 | 72 |
| 133 NW Jill Ann Dr | 0.28mi | 3/2.0 | 1,350 (+8%) | 2mo | $260,000 | $193 | 72 |
| 941 Willow Cir S | 0.30mi | 3/2.0 | 1,132 (-9%) | 2mo | $255,000 | $225 | 69 |
| 800 Crestview Dr | 0.37mi | 3/2.0 | 1,353 (+8%) | 2mo | $275,000 | $203 | 67 |
| 845 Willow Cir N | 0.37mi | 3/2.0 | 1,135 (-9%) | 1mo | $257,000 | $226 | 67 |
| 1013 Darren Dr | 0.69mi | 3/2.0 | 1,235 (-1%) | 1mo | $249,900 | $202 | 66 |
| 520 NW Charlyne Dr | 0.75mi | 3/2.0 | 1,283 (+3%) | 2mo | $274,000 | $214 | 58 |
Match score weights: distance 35% · size 25% · config 20% · recency 20%. Top-matched comps best support the ARV.
Projected returns pro-forma
-3.0% appreciation · 1.78% rent growth · sell at horizon
- IRR
- -2.9%
- Equity multiple
- 0.89×
- Total profit
- $-4,693
- Equity at exit
- $23,543
- IRR
- 5.4%
- Equity multiple
- 1.38×
- Total profit
- $16,657
- Equity at exit
- $13,652
Cash invested: $44,212 (down + closing). Projections, not guarantees.
Landlord ↔ Tenant lean methodology
- Overall (STATE)
- 87 Strongly Landlord-Friendly
- State Texas
- 87 Strongly Landlord-Friendly · R+5
- County
- — inherits STATE
- City
- — inherits STATE
ZIP-level market 76028
- Home prices YoY
- -33.4%
- Rents YoY
- 1.8%
- Active inventory
- 679
- Price-to-rent
- 6.8×
Monthly cashflow live
- Estimated rent
- $1,931 high interval (Pro) →
- Mortgage (P&I)
- −$828
- Tax from tax record
- −$268 /mo · $3,213/yr
- Insurance
- −$66
- HOA
- −$0
- Vacancy / Maint / Mgmt
- −$405
- Net cashflow
- $364
Break-even live
UW: 25.0% down · 7.5% · 30yr · 1.5% tax · 5.0% vac · 8.0% maint · 8.0% mgmt
Financing live
Cash to close
- Down payment
- $39,475
- Closing costs
- $4,737
- Reserves months
- —
- Total cash needed
- —
Loan-product check · same deal, 3 products live
Conventional
25% down · 7.5% · 30yr
- Down + closing
- —
- Monthly P&I
- —
- Monthly cashflow
- —
- DSCR
- —
- Eligible?
- —
Personal DTI + credit; lowest rate.
DSCR
20% down · 8.5% · 30yr
- Down + closing
- —
- Monthly P&I
- —
- Monthly cashflow
- —
- DSCR
- —
- Eligible?
- —
No personal income docs; deal must DSCR.
Hard money
10% down · 12.0% · 12mo
- Down + closing
- —
- Monthly P&I
- —
- Monthly cashflow
- —
- DSCR
- —
- Eligible?
- —
Short-term bridge; refi at stabilization.
Rent comps 40 comps
| Address | Beds | Baths | Sqft | Rent | $/sqft | DOM | Units | Dist |
|---|---|---|---|---|---|---|---|---|
| 213 NW Jayellen Ave Burleson, TX | 4.0 | 2.0 | 1412 | $2,000 | $1.42 | 5d | 1 | 0.13mi |
| 716 SW Sunset Ln Burleson, TX | 3.0 | 1.0 | 1018 | $1,725 | $1.69 | 43d | 1 | 0.29mi |
| 900 Vaughn Dr Burleson, TX | 3.0 | 2.0 | 1408 | $2,200 | $1.56 | 43d | 1 | 0.30mi |
| 912 Vaughn Dr Burleson, TX | 3.0 | 2.0 | 1144 | $1,700 | $1.49 | 17d | 1 | 0.31mi |
| 621 Barkridge Trl Burleson, TX | 3.0 | 2.0 | 1444 | $2,000 | $1.39 | 12d | 1 | 0.39mi |
| 128 Meador Ln Burleson, TX | 2.0 | 2.0 | 947 | $1,500 | $1.58 | 43d | 1 | 0.43mi |
| 105 SE Gardens Blvd Apt 108 Burleson, TX | 2.0 | 1.5 | 1019 | $1,425 | $1.40 | 24d | 1 | 0.49mi |
| 105 SE Gardens Blvd Apt 112 Burleson, TX | 2.0 | 1.5 | 1019 | $1,425 | $1.40 | 7d | 1 | 0.50mi |
| 155 Elk Dr Burleson, TX | 2.0 | 2.0 | 1150 | $1,797 | $1.56 | 1d | 6 | 0.65mi |
| 745 W Hidden Creek Pkwy Burleson, TX | 2.0–3.0 | 2.0 | 1059 | $1,679 | $1.58 | 1d | 6 | 0.72mi |
| 634 Lisa St Burleson, TX | 3.0 | 2.0 | 1239 | $1,845 | $1.49 | 24d | 1 | 0.75mi |
| 100 Arnold Ave Burleson, TX | 3.0 | 2.0 | 1432 | $2,095 | $1.46 | 22d | 1 | 0.75mi |
| NW Summercrest Blvd Burleson, TX | 3.0 | 1.5 | 1085 | $1,450 | $1.34 | 24d | 1 | 0.76mi |
| 207 Stefanie St Burleson, TX | 3.0 | 2.0 | 1145 | $1,695 | $1.48 | 24d | 1 | 0.76mi |
| 926 Irene St Burleson, TX | 3.0 | 2.0 | 1500 | $1,675 | $1.12 | 24d | 1 | 0.78mi |
| 812 NW Summercrest Blvd Apt B Burleson, TX | 3.0 | 1.5 | 1085 | $1,450 | $1.34 | 24d | 1 | 0.89mi |
| 724 Sue Ann Ln Burleson, TX | 3.0 | 2.0 | 1124 | $1,795 | $1.60 | 43d | 1 | 0.89mi |
| 772 Hampshire Dr Burleson, TX | 3.0 | 2.0 | 1210 | $2,350 | $1.94 | 43d | 1 | 0.95mi |
| 1015 Tyler James Dr Burleson, TX | 3.0 | 2.0 | 1454 | $1,950 | $1.34 | 15d | 1 | 0.96mi |
| 428 Tinker Trl Burleson, TX | 2.0 | 2.0 | 1329 | $1,735 | $1.31 | 17d | 1 | 0.97mi |
| 285 SE John Jones Dr Burleson, TX | 1.0–3.0 | 1.0–2.0 | 1094 | $2,154 | $1.97 | 1d | 16 | 0.97mi |
| 1045 Mitchell Ln Unit 1045 Burleson, TX | 2.0 | 2.0 | 1100 | $1,600 | $1.45 | 18d | 1 | 0.97mi |
| 804 Sheryn Dr Burleson, TX | 3.0 | 2.0 | 1304 | $1,890 | $1.45 | 43d | 1 | 1.05mi |
| 1008 Rock Springs Dr Burleson, TX | 3.0 | 2.0 | 1472 | $1,995 | $1.36 | 43d | 1 | 1.08mi |
| 112 SW Murphy Rd Burleson, TX | 3.0 | 2.0 | 1210 | $1,850 | $1.53 | 2d | 1 | 1.14mi |
| 1633 Greenridge Dr Burleson, TX | 1.0–2.0 | 1.0–2.0 | 945 | $1,740 | $1.84 | 2d | 27 | 1.16mi |
| 344 NW Renfro St Burleson, TX | 3.0 | 1.0 | 1026 | $1,580 | $1.54 | 24d | 1 | 1.20mi |
| 109 SW Cindy Ln Burleson, TX | 3.0 | 1.0 | 1276 | $1,700 | $1.33 | 43d | 1 | 1.22mi |
| 1356 SW Alsbury Blvd Burleson, TX | 2.0 | 2.0 | 994 | $1,675 | $1.69 | 43d | 1 | 1.25mi |
| 1350 SW Alsbury Blvd Unit 1387 Burleson, TX | 2.0 | 2.0 | 1078 | $1,438 | $1.33 | 2d | 1 | 1.27mi |
| 1350 SW Alsbury Blvd Unit 1383 Burleson, TX | 3.0 | 2.0 | 1227 | $1,823 | $1.49 | 2d | 1 | 1.27mi |
| 1350 SW Alsbury Blvd Unit 1407 Burleson, TX | 2.0 | 2.0 | 1078 | $1,436 | $1.33 | 43d | 1 | 1.27mi |
| 1350 SW Alsbury Blvd Burleson, TX | 2.0 | 2.0 | 1078 | $1,842 | $1.71 | 12d | 1 | 1.27mi |
| 1350 SW Alsbury Blvd Burleson, TX | 3.0 | 2.0 | 1227 | $2,636 | $2.15 | 20d | 1 | 1.27mi |
| 1350 SW Alsbury Blvd Burleson, TX | 3.0 | 2.0 | 1227 | $2,433 | $1.98 | 1d | 1 | 1.27mi |
| 1350 SW Alsbury Blvd Burleson, TX | 3.0 | 2.0 | 1227 | $2,127 | $1.73 | 43d | 1 | 1.27mi |
| 532 NW King St Burleson, TX | 3.0 | 1.0 | 1300 | $1,550 | $1.19 | 43d | 1 | 1.31mi |
| 609 NW Lorna St Burleson, TX | 3.0 | 2.0 | 1381 | $1,800 | $1.30 | 43d | 1 | 1.39mi |
| 1626 SW Wilshire Blvd Burleson, TX | 3.0 | 2.0 | 1380 | $1,925 | $1.39 | 7d | 1 | 1.46mi |
| 1650 Candler Dr Burleson, TX | 1.0–2.0 | 1.0–2.0 | 896 | $1,699 | $1.90 | 2d | 63 | 1.48mi |
Listing history 4 events
-
2026-05-15status Pending
-
2026-05-14$157,900 Active
-
2025-10-07soldstatus
-
1988-06-21soldstatus
ⓘ Source: listings_history table (triggers on properties + properties_extension) + one-shot
backfill from property_details.listing_events for pre-trigger history.
Tax reassessment forecast TX · Resets to sale price
- Current annual tax
- $3,213 · $268/mo
- Projected year-2 tax
- $3,213 · $268/mo
- Expected delta
- $0/yr ($0/mo · 0.0%)
ⓘ Screening estimate from a state-policy table — verify with the county assessor before closing.
Climate risk First Street
- Flood 1/10 Low FEMA zone X (unshaded) · 0% chance over 30 yrs
- Wildfire 4/10 Moderate
- Heat 7/10 Severe 7 d/yr ≥110°F today · 24 d/yr by 30 yrs out
- Wind 6/10 Major 27% chance of damaging wind over 30 yrs
- Air quality 2/10 Low 2 unhealthy d/yr today · 2 by 30 yrs out
Nearby sold comps map
Loading sold comps map…
Walkable amenities ~0.75 mi
Loading nearby amenities…
Taxation est. · year 1
- Rental income
- $23,168
- − Mortgage interest
- −$8,845
- − Property taxes
- −$3,213
- − Insurance
- −$790
- − Repairs & maintenance
- −$1,853
- − Management
- −$1,853
- − Depreciation
- −$4,593
- Taxable income
- $2,021
- Est. tax owed @ 24.0%
- −$485
- After-tax cash flow
- $3,879/yr
For passive investors: Depreciation is non-cash, so a rental often shows a tax loss while cash-flowing — sheltering income. Rental losses are passive: they offset passive income freely, and up to $25,000/yr can offset ordinary (W-2) income if you actively participate and your MAGI is under $100k (phasing out to $0 by $150k); unused losses carry forward. On sale, claimed depreciation is recaptured at up to 25%, and gains may owe capital-gains tax (a 1031 exchange can defer both). Figures are a year-1 estimate at your 24.0% rate — not tax advice; consult a CPA.
Schools (NCES district)
- District
- Burleson ISD
- NCES district ID
- 4812180
- Math proficiency
- 41% ▼ -8.00%
- Reading proficiency
- 48% ▼ -3.00%
- Median HH income
- $69,349
- Composite
- 40.05/100
- National rank
- #3818
- State rank
- #236 of 826 in TX
Livability — Burleson
- Score
- 79/100
- State rank
- #53
- US rank
- #2133
Category grades
Schools grade is shown separately in the Schools card above.
Census & demographics
- Census place
- Burleson, TX
- County
- Johnson County · 147,987 people
- City population
- 81,549
- Metro
- Dallas-Fort Worth-Arlington, TX
- Population (ZIP)
- 81,549
- Household income
- $101,138
- Rent vs Own
- Severe rent burden
- 1117.0
Population outlook (Johnson County) Hauer SSP2
- Today (2025)
- 179,678 people
- By 2030
- 189,208 · +5.3%
- By 2040
- 207,261 · +15.4%
- By 2050
- 223,064 · +24.1%
- By 2075
- 259,979 · +44.7%
- By 2100
- 275,395 · +53.3%
Race, ethnicity, and origin ACS 2023
- Neighborhood character
- Predominantly White (69%)
- Race & ethnicity
- White 69% Hispanic / Latino 19% Two or more races 11% Black 6% Asian 1%
- Hispanic origin (detail)
- Mexican 17%
- Common ancestry
- Lithuanian 2% Italian 2% Slovak 2%
- Foreign-born
- 5% · Canada
- Languages at home
- 88% English-only · Spanish 10% Other Indo-European 1%
Political lean MEDSL · Johnson
- 2024 margin
- Solid R (+51.4) · D 23.9% · R 75.3%
- 2008→2024 swing
- -3.9pp toward R · 2008: -47.5pp · 2024: -51.4pp
- All cycles
- 2024: R+51.4 2020: R+53.0 2016: R+58.3 2012: R+55.6 2008: R+47.5
Not yet ingested
- Civics
- —
Market trends
- HPI YoY
- ▼ -141.44%
- Current HPI
- 282.466
- Rent YoY
- ▲ 1.78%
- Metro
- Dallas-Fort Worth-Arlington, TX
- State GDP YoY
- ▲ 3.95%
- F500 in state
- 110
Industry mix (Fortune 500 HQ in TX)
| Industry | F500 HQs | Revenue |
|---|---|---|
| Energy | 16 | $1,198B |
|
||
| Technology | 5 | $198B |
|
||
| Engineering / Construction | 4 | $72B |
|
||
| Energy Services | 3 | $60B |
|
||
| Utilities | 3 | $41B |
|
||
| Healthcare | 2 | $330B |
|
||
Price history
4 events — show timeline
- 2026-05-15 Pending — NTREIS
- 2026-05-14 Listed $157,900 NTREIS
- 2025-10-07 Sold (Public Records) — Public Records
- 1988-06-21 Sold (Public Records) — Public Records
Property tax history
+3.7%/yrLatest (2025): $3,213 · +13.3% YoY. Source: county tax records.
Cash-flow waterfall
monthlySold comps — $/sqft
last 12 mo · ≤1 miLoading sold comps…