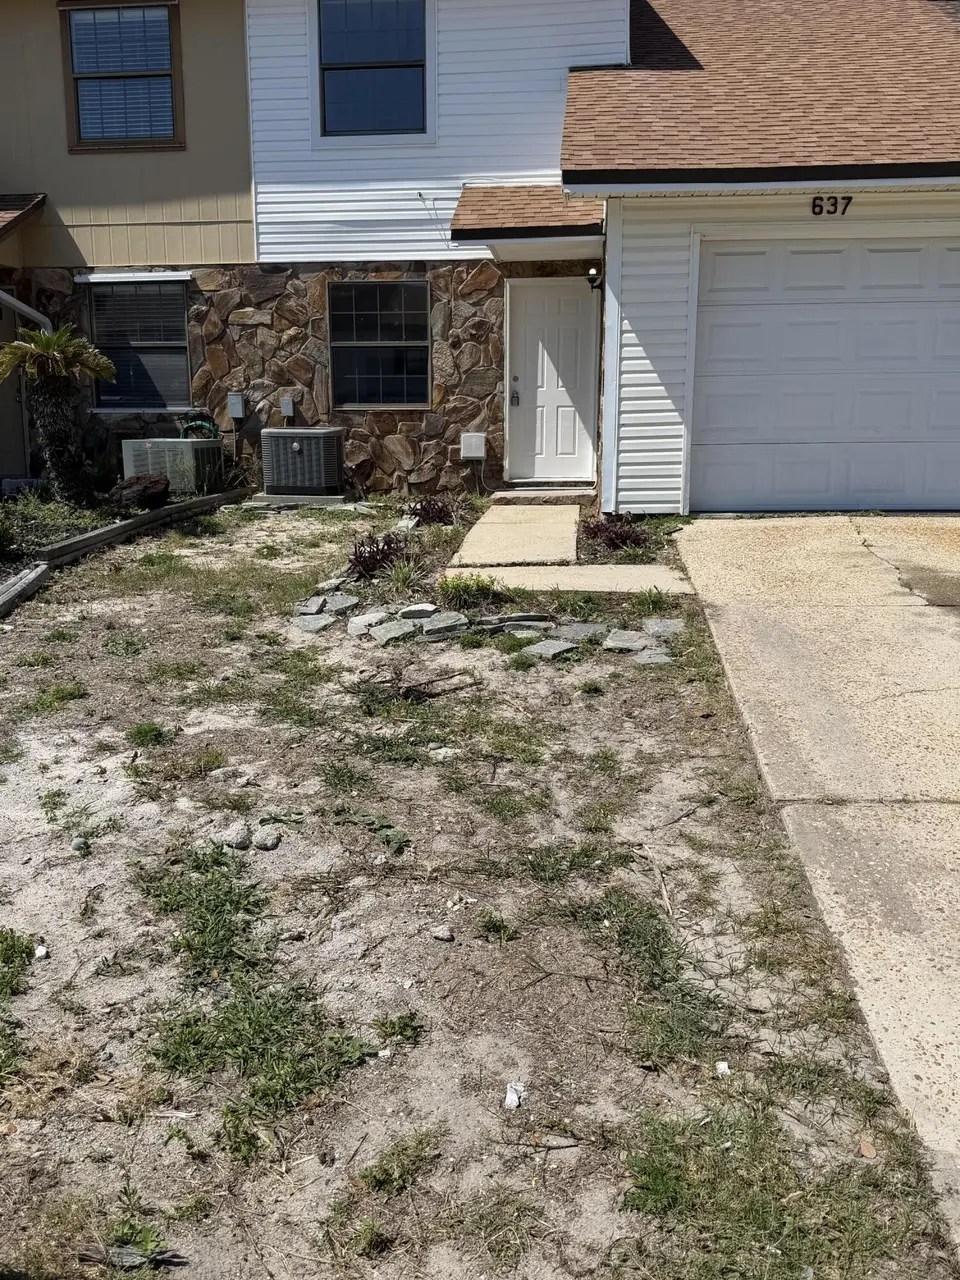
637 Sandalwood Dr · Destin, FL
Flood risk 1/10 · Minimal
- FEMA flood zone
- X (unshaded)
- Chance of flooding over 30 yrs
- 0.0%
- Est. flood insurance / yr
- $507 – $1,088
Fire risk 1/10 · Minimal
- Est. fire insurance / yr
- $947 – $1,759
Heat risk 10/10 · Severe
- Hot days now (above 103°F)
- 7 days/yr
- Hot days in 30 yrs
- 22 days/yr
Wind risk 9/10 · Severe
- Chance of severe wind over 30 yrs
- 99.0%
Air-quality risk 1/10 · Minimal
- Unhealthy air days now
- 0 days/yr
- Unhealthy air days in 30 yrs
- 0 days/yr
Risk factors via First Street. Map © Google.
Why this score? — see what drove the C- grade
The composite is a weighted blend of 9 inputs, each scored 0–100. Each bar is that input's sub-score; the figure is the points it added to the 100-point composite (weight × sub-score).
- ARV discount +15.0/15.0
- Cash flow +13.3/30.0
- Schools +5.2/10.0
- DSCR +4.0/10.0
- Livability +4.0/5.0
- Rent growth +3.4/5.0
- 1% rule +3.0/10.0
- Condition / age +2.5/5.0
- Appreciation +0.0/10.0
$276,000
🖨 Deal sheet (PDF) 📄 Offer letter ✓ Due diligence
Listing remarks
Please call 850-664-6000 or email [email protected] for more information. 'Lowest-Priced 3 Bedroom Opportunity in the Heart of Destin - No HOA & Priced to Sell AS-IS!' Looking for a way to get into Destin at a price point rarely available? This 3-bedroom, 2-bath townhome with garage and fenced yard offers an incredible opportunity to add value and build equity in one of the area's most convenient locations. Located in the established Sandalwood Manor community with NO HOA, you're just minutes from the beaches, harbor, shopping, and dining--an area that consistently attracts both homeowners and investors. This property does need updates--but that's where the opportunity is. Renovate
Key facts
- Garage
- Built 1983
- Listed 31 days
Property features AI
Finance
- HOA & community: Located in the Sandalwood Manor subdivision
Exterior
- Parking: Attached garage
- Utilities: Electric service; Public water; Public sewer
- Home design: Townhome; 2 stories; Built in 1983; Shake roof
- Construction: Brick, stone, and vinyl siding exterior
- Exterior features: Privacy fencing; Open patio; City street frontage; Paved road access
Interior
- Kitchen: Dishwasher
- Bedrooms: 3 bedrooms (master bedroom is carpeted); Bedroom on first floor; two bedrooms on second floor
- Flooring: Tile; Vinyl
- Bathrooms: 2 full bathrooms
- Heating & cooling: Central heating; Central air conditioning; Ceiling fans
- Interior features: Breakfast bar; Cathedral ceilings; Fireplace; Newly painted; Washer/dryer hookup
- Laundry & utility: Washer/dryer hookup; Electric water heater
Neighborhood map
What this means for you Summary
Snapshot
- This is a 3-bed/2.0-bath townhouse listed at $276k.
Deal economics
- At list price, monthly cash flow is $1 ($13/yr) — positive.
- The deal already cash-flows at list — no discount required.
- To meet the 1% rule (rent ≥ 1% of price), the offer needs to be $220k (20.1% below list).
- Recommended offer: $220k (20.1% below list) — sets the bar for 1% rule.
- Cap rate 6.3% vs local median 0.9% in Destin — top-decile yield for the area; either an underpriced asset or a hidden risk that comps aren't pricing in. Stress-test before assuming the spread holds.
Location & tenants
- Location reads 79/100 on livability (#158 in FL, #2,247 nationally) — a middle-class / working-renter tenant base. Strengths: crime A+, employment A+, housing A+; Watch: amenities F, commute F, cost of living D-.
- Okaloosa (other): math 60% / reading 60% proficiency, ranked #12 of 73 in FL (top 16%) — acceptable for families but not a draw, mixed tenant base, ~2y average lease.
- Zoned schools: Destin Elementary School (math 79% / reading 70%, grade A, #230 of 2,144 statewide, top 12%, 976 students, 41% FRL); Destin High School (470 students, 11% FRL, charter).
- Zoned-school proficiency averages 74% at this address vs 60% district-wide (+14 pts) — the actual schools serving this property are materially stronger than the Okaloosa average implies; a family-tenant draw the district grade alone would hide.
- Market conditions: Rents rising (+3.7%/yr); 918 active listings in the ZIP; 23 comparable units currently listed for rent nearby; rentals lingering (median 46d on market — plan ~5-8 weeks vacancy on turnover, expect pricing pressure); 52% of comp listings sitting > 30 days — soft ceiling on asking rent; solid renter incomes; 1,268 units permitted in Okaloosa County in 2024 (175 in 5+ unit buildings).
Forward outlook
- Local home prices are declining (-3.0%/yr); year-one equity from $2k of loan paydown is wiped out by about $8k of value loss. Plan a longer hold.
- Okaloosa County population projected at +37% by 2050 — long-run rental-demand tailwind backs the buy-and-hold thesis.
Negotiation context
- It's been on market 31 days — a 3% lower offer ($268k) is reasonable based on typical stale-listing flexibility.
Risks & watch-outs
- Climate carrying-cost: severe wind risk, 99% chance of damaging wind over 30y; extreme-heat days projected 7→22/yr by 2055 (HVAC capex compounding) — expect insurance premiums to compound above CPI over the hold.
Questions for the listing agent
- It's been on market 31 days. Have you received any prior offers? Is the seller open to a 20% concession, seller financing, or rate buy-down credit?
- Is there a deadline driving the sale (1031 exchange, divorce, estate, relocation)? That informs how much negotiation room exists.
- Schools are A-rated — typically a magnet for longer-tenancy family renters. What's the average tenant stay here, and is there a school-zone premium baked into asking?
- What's the average days-on-market for RENTAL listings here right now (not sales)? A rising rental-DOM trend means longer vacancies and softer asking-rent achievability than the comps imply.
- What's the recent tenant-quality profile in this submarket — average credit score on applications, eviction rate, late-payment / NSF rate, and stable-employment percentage? A property-management company in the area should have these aggregated.
- How much new for-sale + rental construction is in the pipeline within 1–3 miles? Heavy new supply typically softens prices + rents 12–24 months out; constrained supply supports both.
Investment metrics
- 1% rule
- 0.80% ✗
- Cap rate
- 6.30%
- Cash-on-cash
- 0.02%
- DSCR
- 1.00
- GRM
- 10.4
CMA / ARV
- ARV (on-the-fly)
- $411,424
- Comps found
- 12
Show comp detail 12 sales within ~0.75 mi
| Address | Dist | Beds/Ba | Sqft | Sold | Price | $/sf | Match |
|---|---|---|---|---|---|---|---|
| 513 Sandalwood Ct #513 | 0.07mi | 2/1.5 (-1) | 1,238 (+4%) | 10mo | $198,900 | $161 | 75 |
| 734 Legion Dr #64 | 0.47mi | 2/2.0 (-1) | 1,188 (-1%) | 2mo | $235,000 | $198 | 70 |
| 30 Moreno Point Rd Unit 305C | 0.56mi | 2/2.0 (-1) | 1,193 (-0%) | 1mo | $410,000 | $344 | 68 |
| 153 Bent Arrow Dr | 0.37mi | 2/2.0 (-1) | 1,250 (+4%) | 7mo | $305,000 | $244 | 64 |
| 30 Moreno Point Rd Unit 205B | 0.56mi | 2/2.0 (-1) | 1,193 (-0%) | 7mo | $420,000 | $352 | 63 |
| 30 Moreno Point Rd Unit 406A | 0.56mi | 2/2.0 (-1) | 1,193 (-0%) | 8mo | $280,000 | $235 | 62 |
| 30 Moreno Point Dr Unit 303A | 0.56mi | 2/2.0 (-1) | 1,169 (-2%) | 4mo | $350,000 | $299 | 62 |
| 30 Moreno Point Rd Unit 702A | 0.56mi | 2/2.0 (-1) | 1,223 (+2%) | 5mo | $485,000 | $397 | 61 |
| 226 Indian Oaks Dr #226 | 0.35mi | 2/1.5 (-1) | 1,060 (-11%) | 3mo | $243,500 | $230 | 55 |
| 22 Moreno Point Rd Unit 06 | 0.63mi | 2/2.0 (-1) | 1,076 (-10%) | 8mo | $390,000 | $362 | 42 |
| 223 Durango Rd Unit 2 D | 0.74mi | 2/2.0 (-1) | 1,292 (+8%) | 8mo | $655,000 | $507 | 40 |
| 223 Durango Rd Unit 5D | 0.74mi | 2/2.0 (-1) | 1,292 (+8%) | 9mo | $725,000 | $561 | 40 |
Match score weights: distance 35% · size 25% · config 20% · recency 20%. Top-matched comps best support the ARV.
Projected returns pro-forma
-3.0% appreciation · 3.68% rent growth · sell at horizon
- IRR
- -15.6%
- Equity multiple
- 0.44×
- Total profit
- $-43,208
- Equity at exit
- $41,152
- IRR
- -6.2%
- Equity multiple
- 0.59×
- Total profit
- $-31,504
- Equity at exit
- $23,863
Cash invested: $77,280 (down + closing). Projections, not guarantees.
Landlord ↔ Tenant lean methodology
- Overall (STATE)
- 87 Strongly Landlord-Friendly
- State Florida
- 87 Strongly Landlord-Friendly · R+3
- County
- — inherits STATE
- City
- — inherits STATE
ZIP-level market 32541
- Rents YoY
- 3.7%
- Active inventory
- 918
- Price-to-rent
- 10.4×
Monthly cashflow live
- Estimated rent
- $2,204 high interval (Pro) →
- Mortgage (P&I)
- −$1,447
- Tax from tax record
- −$178 /mo · $2,135/yr
- Insurance
- −$115
- HOA
- −$0
- Vacancy / Maint / Mgmt
- −$463
- Net cashflow
- $1
Break-even live
Sensitivity live
| Price | -10% $157 | -5% $79 | +0% $1 | +5% $-77 | +10% $-155 |
|---|---|---|---|---|---|
| Rent | -10% $-173 | -5% $-86 | +0% $1 | +5% $88 | +10% $175 |
| Rate | -1.0pp $140 | -0.5pp $71 | base $1 | +0.5pp $-70 | +1.0pp $-143 |
UW: 25.0% down · 7.5% · 30yr · 1.5% tax · 5.0% vac · 8.0% maint · 8.0% mgmt
Financing live
Cash to close
- Down payment
- $69,000
- Closing costs
- $8,280
- Reserves months
- —
- Total cash needed
- —
Loan-product check · same deal, 3 products live
Conventional
25% down · 7.5% · 30yr
- Down + closing
- —
- Monthly P&I
- —
- Monthly cashflow
- —
- DSCR
- —
- Eligible?
- —
Personal DTI + credit; lowest rate.
DSCR
20% down · 8.5% · 30yr
- Down + closing
- —
- Monthly P&I
- —
- Monthly cashflow
- —
- DSCR
- —
- Eligible?
- —
No personal income docs; deal must DSCR.
Hard money
10% down · 12.0% · 12mo
- Down + closing
- —
- Monthly P&I
- —
- Monthly cashflow
- —
- DSCR
- —
- Eligible?
- —
Short-term bridge; refi at stabilization.
Rent comps 23 comps
| Address | Beds | Baths | Sqft | Rent | $/sqft | DOM | Units | Dist |
|---|---|---|---|---|---|---|---|---|
| 204 Ann Cir Unit C Destin, FL | 2.0 | 1.0 | 1000 | $1,550 | $1.55 | 45d | 1 | 0.23mi |
| 710 Legion Dr Unit O2 Destin, FL | 2.0 | 1.0 | 898 | $1,450 | $1.61 | 22d | 1 | 0.26mi |
| 710 Legion Dr Unit O2 Destin, FL | 2.0 | 1.0 | 898 | $1,600 | $1.78 | 45d | 1 | 0.26mi |
| 710 Legion Dr Unit D2 Destin, FL | 2.0 | 1.0 | 850 | $1,750 | $2.06 | 15d | 1 | 0.28mi |
| 710 Legion Dr Unit D2 Destin, FL | 2.0 | 1.0 | 850 | $1,800 | $2.12 | 45d | 1 | 0.28mi |
| 150 Bent Arrow Dr Destin, FL | 3.0 | 2.5 | 1440 | $2,250 | $1.56 | 45d | 1 | 0.36mi |
| 150 Bent Arrow Dr #36 Destin, FL | 3.0 | 2.5 | 1452 | $2,100 | $1.45 | 22d | 1 | 0.45mi |
| 150 Bent Arrow Dr #36 Destin, FL | 3.0 | 2.5 | 1452 | $2,100 | $1.45 | 15d | 1 | 0.45mi |
| 734 Legion Dr #70 Destin, FL | 2.0 | 2.0 | 1180 | $2,099 | $1.78 | 45d | 1 | 0.49mi |
| 235 Pelican Pl #11 Destin, FL | 2.0 | 2.5 | 1465 | $2,400 | $1.64 | 45d | 1 | 0.54mi |
| 234 Pelican Pl Destin, FL | 2.0 | 2.5 | 1332 | $2,100 | $1.58 | 45d | 1 | 0.62mi |
| 22 Moreno Point Rd Unit 1285898P Destin, FL | 2.0 | 2.5 | 1065 | $3,068 | $2.88 | 15d | 1 | 0.64mi |
| 22 Moreno Point Rd #12 Destin, FL | 3.0 | 2.5 | 1236 | $3,295 | $2.67 | 45d | 1 | 0.64mi |
| 2004-2098 Palm St Destin, FL | 1.0–3.0 | 1.0–2.0 | 1061 | $3,156 | $2.97 | 15d | 22 | 0.65mi |
| 197 Durango Rd Destin, FL | 2.0 | 1.0 | 852 | $2,700 | $3.17 | 22d | 1 | 0.68mi |
| 132 Bayou Dr Destin, FL | 2.0 | 1.5 | 1161 | $2,200 | $1.89 | 45d | 1 | 1.02mi |
| 100 Gulf Shore Dr #104 Destin, FL | 2.0 | 2.0 | 1100 | $3,200 | $2.91 | 45d | 1 | 1.04mi |
| 47 Pine Ridge Trce Destin, FL | 3.0 | 2.0 | 1188 | $2,900 | $2.44 | 15d | 1 | 1.05mi |
| 37 Log Pl Destin, FL | 2.0 | 1.5 | 1261 | $1,750 | $1.39 | 22d | 1 | 1.09mi |
| 2 Court Dr Destin, FL | 2.0 | 2.5 | 1216 | $2,000 | $1.64 | 22d | 1 | 1.15mi |
| 27 Court Dr Destin, FL | 2.0 | 2.5 | 1216 | $2,300 | $1.89 | 45d | 1 | 1.17mi |
| 1014 Airport Rd #138 Destin, FL | 3.0 | 2.5 | 1440 | $2,300 | $1.60 | 45d | 1 | 1.40mi |
| 160 S Mattie M Kelly Blvd Destin, FL | 1.0–3.0 | 1.0–2.0 | 1074 | $2,650 | $2.47 | 15d | 24 | 1.44mi |
Listing history 18 events
-
2026-06-21days on market $276,000 Active 31 DOM
-
2026-06-18days on market $276,000 Active 28 DOM
-
2026-06-17days on market $276,000 Active 27 DOM
-
2026-06-16days on market $276,000 Active 26 DOM
-
2026-06-15days on market $276,000 Active 25 DOM
-
2026-06-14days on market $276,000 Active 23 DOM
-
2026-06-13remarks 695-char remark
-
2026-06-13pricedays on market $276,000 Active 22 DOM
-
2026-06-10days on market $279,900 Active 20 DOM
-
2026-06-09days on market $279,900 Active 19 DOM
-
2026-06-08days on market $279,900 Active 18 DOM
-
2026-06-07days on market $279,900 Active 17 DOM
-
2026-06-05days on market $279,900 Active 14 DOM
-
2026-06-02days on market $279,900 Active 12 DOM
-
2026-06-01days on market $279,900 Active 11 DOM
-
2026-05-31days on market $279,900 Active 10 DOM
-
2026-05-30days on market $279,900 Active 9 DOM
-
2026-05-21$279,900 Active
ⓘ Source: listings_history table (triggers on properties + properties_extension) + one-shot
backfill from property_details.listing_events for pre-trigger history.
Tax reassessment forecast FL · Resets to sale price
- Current annual tax
- $2,135 · $178/mo
- Projected year-2 tax
- $2,291 · $191/mo
- Expected delta
- +$155/yr (+$13/mo · 7.3%)
ⓘ Screening estimate from a state-policy table — verify with the county assessor before closing.
Climate risk First Street
- Flood 1/10 Low FEMA zone X (unshaded) · 0% chance over 30 yrs
- Wildfire 1/10 Low
- Heat 10/10 Extreme 7 d/yr ≥103°F today · 22 d/yr by 30 yrs out
- Wind 9/10 Extreme 99% chance of damaging wind over 30 yrs
- Air quality 1/10 Low 0 unhealthy d/yr today · 0 by 30 yrs out
Nearby sold comps map
Loading sold comps map…
Walkable amenities ~0.75 mi
Loading nearby amenities…
Taxation est. · year 1
- Rental income
- $26,451
- − Mortgage interest
- −$15,460
- − Property taxes
- −$2,135
- − Insurance
- −$1,380
- − Repairs & maintenance
- −$2,116
- − Management
- −$2,116
- − Depreciation
- −$8,029
- Taxable loss
- −$4,786
- Est. tax savings @ 24.0%
- +$1,149
- After-tax cash flow
- $1,161/yr
For passive investors: Depreciation is non-cash, so a rental often shows a tax loss while cash-flowing — sheltering income. Rental losses are passive: they offset passive income freely, and up to $25,000/yr can offset ordinary (W-2) income if you actively participate and your MAGI is under $100k (phasing out to $0 by $150k); unused losses carry forward. On sale, claimed depreciation is recaptured at up to 25%, and gains may owe capital-gains tax (a 1031 exchange can defer both). Figures are a year-1 estimate at your 24.0% rate — not tax advice; consult a CPA.
Schools (NCES district)
- District
- Okaloosa
- NCES district ID
- 1201380
- Math proficiency
- 60% ▼ -12.00%
- Reading proficiency
- 60% ▼ -4.00%
- Median HH income
- $55,601
- Composite
- 51.62/100
- National rank
- #1705
- State rank
- #12 of 73 in FL
Livability — Destin
- Score
- 79/100
- State rank
- #158
- US rank
- #2247
Category grades
Schools grade is shown separately in the Schools card above.
Census & demographics
- Census place
- Destin, FL
- County
- Okaloosa County · 194,352 people
- City population
- 18,855
- Metro
- Crestview-Fort Walton Beach-Destin, FL
- Population (ZIP)
- 18,855
- Household income
- $95,124
- Rent vs Own
- Severe rent burden
- 554.0
Population outlook (Okaloosa County) Hauer SSP2
- Today (2025)
- 235,133 people
- By 2030
- 253,483 · +7.8%
- By 2040
- 289,537 · +23.1%
- By 2050
- 322,954 · +37.3%
- By 2075
- 399,624 · +70.0%
- By 2100
- 425,311 · +80.9%
Race, ethnicity, and origin ACS 2023
- Neighborhood character
- Predominantly White (81%)
- Race & ethnicity
- White 81% Two or more races 10% Hispanic / Latino 7% Black 3% Asian 2%
- Hispanic origin (detail)
- Mexican 3%
- Common ancestry
- Italian 4% Lithuanian 3% Slovak 2%
- Foreign-born
- 14% · Canada
- Languages at home
- 83% English-only · Spanish 7% Other Indo-European 6% Russian/Polish/Slavic 2%
Political lean MEDSL · Okaloosa
- 2024 margin
- Solid R (+42.4) · D 28.2% · R 70.7% · Other 1.1%
- 2008→2024 swing
- +2.5pp toward D · 2008: -44.9pp · 2024: -42.4pp
- All cycles
- 2024: R+42.4 2020: R+39.1 2016: R+47.8 2012: R+49.4 2008: R+44.9
Not yet ingested
- Civics
- —
Market trends
- HPI YoY
- ▼ -147.89%
- Current HPI
- 252.6715
- Rent YoY
- ▲ 3.68%
- Metro
- Crestview-Fort Walton Beach-Destin, FL
- State GDP YoY
- ▲ 3.28%
- F500 in state
- 36
Industry mix (Fortune 500 HQ in FL)
| Industry | F500 HQs | Revenue |
|---|---|---|
| Industrial Technology | 2 | $29B |
|
||
| Insurance | 2 | $17B |
|
||
| Retail | 1 | $60B |
|
||
| Technology Distribution | 1 | $58B |
|
||
| Homebuilding | 1 | $35B |
|
||
| Technology Manufacturing | 1 | $35B |
|
||
Price history
-1.4% since first listed2 events — show timeline
- 2026-06-10 Price Changed $276,000 ECAR
- 2026-05-21 Listed $279,900 ECAR
Property tax history
+9.7%/yrLatest (2025): $2,135 · +6.5% YoY. Source: county tax records.
Cash-flow waterfall
monthlySold comps — $/sqft
last 12 mo · ≤1 miLoading sold comps…