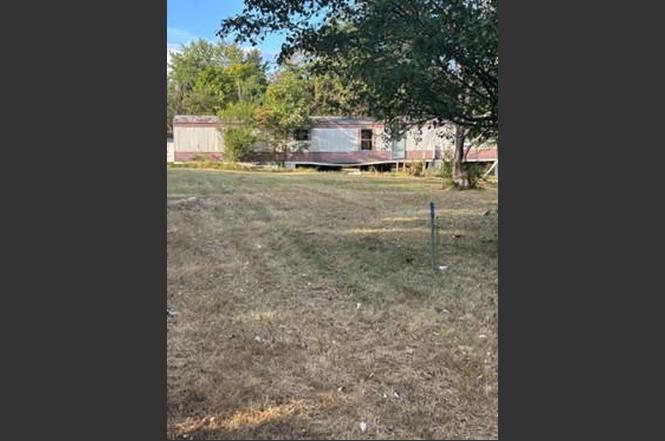
8840 N 8840 Princeton Rd · Gracey, KY
Flood risk 1/10 · Minimal
- FEMA flood zone
- X (unshaded)
- Chance of flooding over 30 yrs
- 0.0%
- Est. flood insurance / yr
- $507 – $1,088
Fire risk 4/10 · Minor
- Est. fire insurance / yr
- $839 – $1,559
Heat risk 5/10 · Moderate
- Hot days now (above 109°F)
- 7 days/yr
- Hot days in 30 yrs
- 20 days/yr
Wind risk 3/10 · Minor
- Chance of severe wind over 30 yrs
- 8.0%
Air-quality risk 2/10 · Minimal
- Unhealthy air days now
- 0 days/yr
- Unhealthy air days in 30 yrs
- 1 days/yr
Risk factors via First Street. Map © Google.
Why this score? — see what drove the B+ grade
The composite is a weighted blend of 9 inputs, each scored 0–100. Each bar is that input's sub-score; the figure is the points it added to the 100-point composite (weight × sub-score).
- Cash flow +30.0/30.0
- 1% rule +10.0/10.0
- DSCR +10.0/10.0
- Appreciation +8.2/10.0
- ARV discount +7.5/15.0
- Schools +2.7/10.0
- Rent growth +2.5/5.0
- Condition / age +2.5/5.0
- Livability +1.9/5.0
$37,500
🖨 Deal sheet 📄 Offer letter ✓ Due diligence
Listing remarks
Selling As-Is, this fixer-upper 1988 (980 sq ft) single-wide home sits beautifully on 2.7 acres outside of the city limits with a country feel. Located Less Than 5 miles From Hopkinsville And very close To Pennyrile State Resort Park, LBL, Kentucky Lake, and Lake Barkley. Great to keep as a lake getaway/fishing spot or even rent out. There Is Meat on the bones - Home needs a few repairs, updates, and improvements. Has a 2-car garage. Power has been off for over 5 years; it will need a Safety Inspection. Sweat Equity Opportunity - Priced Right for Someone to Flip It or for Someone Who wants to put in a little elbow grease to have for their next home.
Key facts
- Lake getaway
- Safety inspection
- Fixer-upper
Tags
Neighborhood map
What this means for you Summary
Snapshot
- This is a 3-bed/2.0-bath manufactured listed at $38k.
Deal economics
- At list price, monthly cash flow is $631 ($8k/yr) — positive.
- The deal already cash-flows at list — no discount required.
- Meets the 1% rule at list price ($1k rent vs $38k).
- Recommended offer: $36k (3.0% below list) — sets the bar for market timing.
Location & tenants
- Location reads 37/100 on livability (#538 in KY) — a limited-amenity area; tenant pool skews transient or value-seeking. Strengths: cost of living A+, crime A; Watch: schools F, amenities F, commute F.
- Christian County (town): math 30% / reading 34% proficiency, ranked #93 of 165 in KY (top 56%) — families likely to look elsewhere, expect single-tenant / working-renter base with shorter leases; 61% free/reduced lunch — lower-income household profile, screen leases tightly.
- Market conditions: 5 active listings in the ZIP; 193 units permitted in Christian County in 2024 (66 in 5+ unit buildings).
Forward outlook
- In year one you build about $3k of equity ($259 loan paydown + $2k appreciation (6.3% local appreciation)).
- Christian County population projected at -20% by 2050 — secular population decline; favor cash flow + early exit over multi-decade hold.
- At projected returns (6.3% appreciation + 3.0% rent growth), your $10k cash investment doubles in ~2 years — after that, you're playing with house money.
Negotiation context
- It's been on market 55 days — a 3% lower offer ($36k) is reasonable based on typical stale-listing flexibility.
Risks & watch-outs
- Climate carrying-cost: extreme-heat days projected 7→20/yr by 2055 (HVAC capex compounding) — expect insurance premiums to compound above CPI over the hold.
Questions for the listing agent
- It's been on market 55 days. Have you received any prior offers? Is the seller open to a 3% concession, seller financing, or rate buy-down credit?
- Is there a deadline driving the sale (1031 exchange, divorce, estate, relocation)? That informs how much negotiation room exists.
- Schools are F-rated, which usually means shorter tenancies and higher turnover. Who's the typical renter profile here, and what's been the actual vacancy rate?
- What's the average days-on-market for RENTAL listings here right now (not sales)? A rising rental-DOM trend means longer vacancies and softer asking-rent achievability than the comps imply.
- What's the recent tenant-quality profile in this submarket — average credit score on applications, eviction rate, late-payment / NSF rate, and stable-employment percentage? A property-management company in the area should have these aggregated.
- How much new for-sale + rental construction is in the pipeline within 1–3 miles? Heavy new supply typically softens prices + rents 12–24 months out; constrained supply supports both.
Investment metrics
- 1% rule
- 2.90% ✓
- Cap rate
- 26.49%
- Cash-on-cash
- 72.12%
- DSCR
- 4.21
- GRM
- 2.9
CMA / ARV
No comps found within radius.
Projected returns pro-forma
6.32% appreciation · 3.0% rent growth · sell at horizon
- IRR
- 79.6%
- Equity multiple
- 5.93×
- Total profit
- $51,738
- Equity at exit
- $24,343
- IRR
- 76.6%
- Equity multiple
- 12.48×
- Total profit
- $120,533
- Equity at exit
- $44,823
Cash invested: $10,500 (down + closing). Projections, not guarantees.
Landlord ↔ Tenant lean methodology
- Overall (STATE)
- 83 Strongly Landlord-Friendly
- State Kentucky
- 83 Strongly Landlord-Friendly · R+16
- County
- — inherits STATE
- City
- — inherits STATE
ZIP-level market 42215
- Home prices YoY
- 1.9%
- Active inventory
- 5
- Price-to-rent
- 2.9×
Monthly cashflow live
- Estimated rent
- $1,089 medium interval (Pro) →
- Mortgage (P&I)
- −$197
- Tax from tax record
- −$17 /mo · $202/yr
- Insurance
- −$16
- HOA
- −$0
- Vacancy / Maint / Mgmt
- −$229
- Net cashflow
- $631
Break-even live
UW: 25.0% down · 7.5% · 30yr · 1.5% tax · 5.0% vac · 8.0% maint · 8.0% mgmt
Financing live
Cash to close
- Down payment
- $9,375
- Closing costs
- $1,125
- Reserves months
- —
- Total cash needed
- —
Loan-product check · same deal, 3 products live
Conventional
25% down · 7.5% · 30yr
- Down + closing
- —
- Monthly P&I
- —
- Monthly cashflow
- —
- DSCR
- —
- Eligible?
- —
Personal DTI + credit; lowest rate.
DSCR
20% down · 8.5% · 30yr
- Down + closing
- —
- Monthly P&I
- —
- Monthly cashflow
- —
- DSCR
- —
- Eligible?
- —
No personal income docs; deal must DSCR.
Hard money
10% down · 12.0% · 12mo
- Down + closing
- —
- Monthly P&I
- —
- Monthly cashflow
- —
- DSCR
- —
- Eligible?
- —
Short-term bridge; refi at stabilization.
Listing history 4 events
-
2026-01-31status Pending
-
2025-10-19status Pending
-
2025-10-19soldstatus Closed
-
2025-08-25$37,500 Active
ⓘ Source: listings_history table (triggers on properties + properties_extension) + one-shot
backfill from property_details.listing_events for pre-trigger history.
Tax reassessment forecast KY · Resets to sale price
- Current annual tax
- $202 · $17/mo
- Projected year-2 tax
- $322 · $27/mo
- Expected delta
- +$121/yr (+$10/mo · 60.0%)
ⓘ Screening estimate from a state-policy table — verify with the county assessor before closing.
Climate risk First Street
- Flood 1/10 Low FEMA zone X (unshaded) · 0% chance over 30 yrs
- Wildfire 4/10 Moderate
- Heat 5/10 Major 7 d/yr ≥109°F today · 20 d/yr by 30 yrs out
- Wind 3/10 Moderate 8% chance of damaging wind over 30 yrs
- Air quality 2/10 Low 0 unhealthy d/yr today · 1 by 30 yrs out
Nearby sold comps map
Loading sold comps map…
Walkable amenities ~0.75 mi
Loading nearby amenities…
Taxation est. · year 1
- Rental income
- $13,065
- − Mortgage interest
- −$2,101
- − Property taxes
- −$202
- − Insurance
- −$188
- − Repairs & maintenance
- −$1,045
- − Management
- −$1,045
- − Depreciation
- −$1,091
- Taxable income
- $7,394
- Est. tax owed @ 24.0%
- −$1,775
- After-tax cash flow
- $5,798/yr
For passive investors: Depreciation is non-cash, so a rental often shows a tax loss while cash-flowing — sheltering income. Rental losses are passive: they offset passive income freely, and up to $25,000/yr can offset ordinary (W-2) income if you actively participate and your MAGI is under $100k (phasing out to $0 by $150k); unused losses carry forward. On sale, claimed depreciation is recaptured at up to 25%, and gains may owe capital-gains tax (a 1031 exchange can defer both). Figures are a year-1 estimate at your 24.0% rate — not tax advice; consult a CPA.
Schools (NCES district)
- District
- Christian County
- NCES district ID
- 2101150
- Math proficiency
- 30% ▼ -9.00%
- Reading proficiency
- 34% ▼ -10.00%
- Median HH income
- $38,961
- Composite
- 26.8/100
- National rank
- #7118
- State rank
- #93 of 165 in KY
Livability — Gracey
- Score
- 37/100
- State rank
- #538
- US rank
- #27613
Category grades
Schools grade is shown separately in the Schools card above.
Census & demographics
- Population (ZIP)
- 1,692
Population outlook (Christian County) Hauer SSP2
- Today (2025)
- 67,861 people
- By 2030
- 65,808 · -3.0%
- By 2040
- 60,090 · -11.5%
- By 2050
- 54,561 · -19.6%
- By 2075
- 45,859 · -32.4%
- By 2100
- 38,310 · -43.5%
Race, ethnicity, and origin ACS 2023
- Neighborhood character
- Predominantly White (72%)
- Race & ethnicity
- White 72% Black 21% Asian 5% Two or more races 2%
- Common ancestry
- Scotch-Irish 1% Serbian 1% Italian 1%
- Foreign-born
- 1%
- Languages at home
- 93% English-only · German/W. Germanic 3% Vietnamese 3%
Political lean MEDSL · Christian
- 2024 margin
- Solid R (+33.6) · D 32.6% · R 66.1% · Other 1.3%
- 2008→2024 swing
- -12.4pp toward R · 2008: -21.2pp · 2024: -33.6pp
- All cycles
- 2024: R+33.6 2020: R+28.4 2016: R+31.4 2012: R+23.8 2008: R+21.2
Not yet ingested
- Civics
- —
Market trends
- HPI YoY
- ▲ 6.32%
- Current HPI
- 342.5955
- Rent YoY
- —
- Metro
- —
- State GDP YoY
- ▲ 1.81%
- F500 in state
- 4
Industry mix (Fortune 500 HQ in KY)
| Industry | F500 HQs | Revenue |
|---|---|---|
| Healthcare | 1 | $118B |
|
||
| Food / Beverage | 1 | $7B |
|
||
Price history
4 events — show timeline
- 2026-01-31 Pending — HCTCBOR
- 2025-10-19 Pending — HCTCBOR
- 2025-10-19 Sold (MLS) — HCTCBOR
- 2025-08-25 Listed $37,500 HCTCBOR
Property tax history
+1.0%/yrLatest (2025): $202 · -3.3% YoY. Source: county tax records.
Cash-flow waterfall
monthlySold comps — $/sqft
last 12 mo · ≤1 miLoading sold comps…