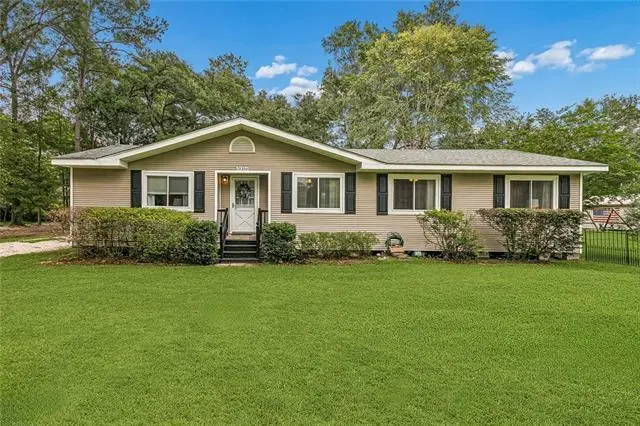
72350 Forest Dr · Covington, LA
Flood risk 4/10 · Minor
- FEMA flood zone
- X (shaded)
- Chance of flooding over 30 yrs
- 0.22%
- Est. flood insurance / yr
- $507 – $1,088
Fire risk 4/10 · Minor
- Est. fire insurance / yr
- $1,269 – $2,357
Heat risk 9/10 · Severe
- Hot days now (above 109°F)
- 7 days/yr
- Hot days in 30 yrs
- 21 days/yr
Wind risk 9/10 · Severe
- Chance of severe wind over 30 yrs
- 99.0%
Air-quality risk 2/10 · Minimal
- Unhealthy air days now
- 0 days/yr
- Unhealthy air days in 30 yrs
- 1 days/yr
Risk factors via First Street. Map © Google.
Why this score? — see what drove the C grade
The composite is a weighted blend of 9 inputs, each scored 0–100. Each bar is that input's sub-score; the figure is the points it added to the 100-point composite (weight × sub-score).
- Cash flow +21.0/30.0
- ARV discount +12.1/15.0
- DSCR +6.7/10.0
- 1% rule +4.3/10.0
- Schools +4.3/10.0
- Livability +3.8/5.0
- Rent growth +3.6/5.0
- Condition / age +2.5/5.0
- Appreciation +0.0/10.0
$225,000
🖨 Deal sheet (PDF) 📄 Offer letter ✓ Due diligence
Listing remarks MLS
Welcome home to this charming 4-bedroom, 2-bath property situated on nearly half an acre! Enjoy the perfect blend of country living and convenience, just minutes from shopping, I-12, and local hospitals. This well-maintained home features a carpet-free interior, stainless steel kitchen appliances, and includes the washer and dryer. Outside, you'll find a beautiful mature oak tree, plenty of parking, and a spacious patio perfect for entertaining family and friends. Three storage sheds provide plenty of room for tools, equipment, and hobbies. No HOA and located in a preferred flood zone. Don't miss this opportunity to own a property with space, storage, and convenience all in one!
Key facts
- Three storage sheds
- Preferred flood zone
- Mature oak tree
Tags
Property features AI
Exterior
- Parking: Driveway
- Security: Smoke detector(s)
- Utilities: Well water; Septic tank
- Home design: Single-story home; Resale with cosmetic and kitchen updates
- Construction: Vinyl siding; Shingle roof; Raised foundation; Built/updated as resale property (cosmetic, paint, kitchen updates)
- Exterior features: Porch; Wood porch; Shed(s); Outside city limits; Oversized lot; Lot dimensions approximately 95 x 205 x 100 x 205
Interior
- Kitchen: Dishwasher; Microwave; Oven; Range; Refrigerator; Stainless steel appliances
- Bedrooms: Total rooms 8
- Bathrooms: 2 full bathrooms
- Heating & cooling: Central heating; Central air conditioning
- Interior features: Attic; Ceiling fan(s); Pantry; Pull-down attic stairs; Stainless steel appliances; Cable TV; Screens on windows
- Laundry & utility: Washer hookup; Dryer hookup; Washer; Dryer
Neighborhood map
What this means for you Summary
Snapshot
- This is a 4-bed/2.0-bath single-family listed at $225k.
Deal economics
- At list price, monthly cash flow is $316 ($4k/yr) — positive.
- The deal already cash-flows at list — no discount required.
- To meet the 1% rule (rent ≥ 1% of price), the offer needs to be $210k (6.5% below list).
- Recommended offer: $210k (6.5% below list) — sets the bar for 1% rule.
- Cap rate 8.0% vs local median 3.9% in Covington — top-decile yield for the area; either an underpriced asset or a hidden risk that comps aren't pricing in. Stress-test before assuming the spread holds.
Location & tenants
- Location reads 75/100 on livability (#17 in LA, #3,876 nationally) — a middle-class / working-renter tenant base. Strengths: employment A+, housing A+, health & safety A+; Watch: amenities F, commute F.
- St. Tammany Parish (suburban): math 43% / reading 55% proficiency, ranked #11 of 98 in LA (top 11%) — families likely to look elsewhere, expect single-tenant / working-renter base with shorter leases.
- Market conditions: Rents rising fast (+4.3%/yr); 524 active listings in the ZIP; 3 comparable units currently listed for rent nearby; rentals at typical pace (median 25d on market — plan ~3-4 weeks tenant-placement turnaround); solid renter incomes; 1,064 units permitted in St. Tammany Parish in 2024 (0 in 5+ unit buildings).
- This rent runs 31% of the median local income ($81k/yr) — at the standard rent-burdened threshold; future hikes will face affordability resistance.
Forward outlook
- Local home prices are declining (-3.0%/yr); year-one equity from $2k of loan paydown is wiped out by about $7k of value loss. Plan a longer hold.
- St. Tammany County population projected at +27% by 2050 — long-run rental-demand tailwind backs the buy-and-hold thesis.
Negotiation context
- It's been on market 17 days — a 2% lower offer ($222k) is reasonable based on typical stale-listing flexibility.
- 4 sale attempts since 13y ago with the ask held roughly flat each time — persistent listings suggest the price (not the market) is what's stuck; bring a comps-based counter.
- Current owner paid $142k; list at $225k implies a 58% gain — meaningful room to come down on a strong offer.
Risks & watch-outs
- Climate carrying-cost: severe wind risk, 99% chance of damaging wind over 30y; extreme-heat days projected 7→21/yr by 2055 (HVAC capex compounding) — expect insurance premiums to compound above CPI over the hold.
Questions for the listing agent
- Built in 1979 — when were the roof, HVAC, electrical panel, plumbing, and water heater last replaced?
- Is there a deadline driving the sale (1031 exchange, divorce, estate, relocation)? That informs how much negotiation room exists.
- Schools are B-rated — typically a magnet for longer-tenancy family renters. What's the average tenant stay here, and is there a school-zone premium baked into asking?
- What's the average days-on-market for RENTAL listings here right now (not sales)? A rising rental-DOM trend means longer vacancies and softer asking-rent achievability than the comps imply.
- What's the recent tenant-quality profile in this submarket — average credit score on applications, eviction rate, late-payment / NSF rate, and stable-employment percentage? A property-management company in the area should have these aggregated.
- How much new for-sale + rental construction is in the pipeline within 1–3 miles? Heavy new supply typically softens prices + rents 12–24 months out; constrained supply supports both.
Investment metrics
- 1% rule
- 0.93% ✗
- Cap rate
- 7.98%
- Cash-on-cash
- 6.02%
- DSCR
- 1.27
- GRM
- 8.9
CMA / ARV
- ARV (on-the-fly)
- $250,500
- Comps found
- 3
Show comp detail 3 sales within ~0.75 mi
| Address | Dist | Beds/Ba | Sqft | Sold | Price | $/sf | Match |
|---|---|---|---|---|---|---|---|
| 52 Hickory Dr | 0.61mi | 3/2.0 (-1) | 1,453 (-3%) | 10mo | $250,000 | $172 | 54 |
| 72323 Sunset Dr | 0.25mi | 3/2.0 (-1) | 1,710 (+14%) | 24mo | $285,000 | $167 | 40 |
| 8 Spruce Dr | 0.62mi | 3/2.0 (-1) | 1,663 (+11%) | 14mo | $250,000 | $150 | 36 |
Match score weights: distance 35% · size 25% · config 20% · recency 20%. Top-matched comps best support the ARV.
Projected returns pro-forma
-3.0% appreciation · 4.31% rent growth · sell at horizon
- IRR
- -5.8%
- Equity multiple
- 0.78×
- Total profit
- $-13,634
- Equity at exit
- $33,548
- IRR
- 5.2%
- Equity multiple
- 1.40×
- Total profit
- $25,470
- Equity at exit
- $19,454
Cash invested: $63,000 (down + closing). Projections, not guarantees.
Landlord ↔ Tenant lean methodology
- Overall (STATE)
- 90 Strongly Landlord-Friendly
- State Louisiana
- 90 Strongly Landlord-Friendly · R+12
- County
- — inherits STATE
- City
- — inherits STATE
ZIP-level market 70433
- Rents YoY
- 4.3%
- Active inventory
- 524
- Price-to-rent
- 8.9×
Monthly cashflow live
- Estimated rent
- $2,103 medium interval (Pro) →
- Mortgage (P&I)
- −$1,180
- Tax from tax record
- −$72 /mo · $862/yr
- Insurance
- −$94
- HOA
- −$0
- Vacancy / Maint / Mgmt
- −$442
- Net cashflow
- $316
Break-even live
Sensitivity live
| Price | -10% $443 | -5% $380 | +0% $316 | +5% $252 | +10% $188 |
|---|---|---|---|---|---|
| Rent | -10% $150 | -5% $233 | +0% $316 | +5% $399 | +10% $482 |
| Rate | -1.0pp $429 | -0.5pp $373 | base $316 | +0.5pp $258 | +1.0pp $198 |
UW: 25.0% down · 7.5% · 30yr · 1.5% tax · 5.0% vac · 8.0% maint · 8.0% mgmt
Financing live
Cash to close
- Down payment
- $56,250
- Closing costs
- $6,750
- Reserves months
- —
- Total cash needed
- —
Loan-product check · same deal, 3 products live
Conventional
25% down · 7.5% · 30yr
- Down + closing
- —
- Monthly P&I
- —
- Monthly cashflow
- —
- DSCR
- —
- Eligible?
- —
Personal DTI + credit; lowest rate.
DSCR
20% down · 8.5% · 30yr
- Down + closing
- —
- Monthly P&I
- —
- Monthly cashflow
- —
- DSCR
- —
- Eligible?
- —
No personal income docs; deal must DSCR.
Hard money
10% down · 12.0% · 12mo
- Down + closing
- —
- Monthly P&I
- —
- Monthly cashflow
- —
- DSCR
- —
- Eligible?
- —
Short-term bridge; refi at stabilization.
Rent comps 3 comps
| Address | Beds | Baths | Sqft | Rent | $/sqft | DOM | Units | Dist |
|---|---|---|---|---|---|---|---|---|
| 72291 Forest Dr Covington, LA | 3.0 | 2.0 | 1680 | $2,000 | $1.19 | 44d | 1 | 0.07mi |
| 538 Moore Blvd Covington, LA | 4.0 | 2.0 | 1948 | $2,150 | $1.10 | 24d | 1 | 0.80mi |
| 15568 Madris Ln Covington, LA | 3.0 | 2.0 | 1600 | $1,825 | $1.14 | 20d | 1 | 1.16mi |
Listing history 12 events
-
2026-06-18days on market $225,000 Active 17 DOM
-
2026-06-17days on market $225,000 Active 16 DOM
-
2026-06-16days on market $225,000 Active 15 DOM
-
2026-06-15days on market $225,000 Active 14 DOM
-
2026-06-13days on market $225,000 Active 12 DOM
-
2026-06-10days on market $225,000 Active 9 DOM
-
2026-06-09days on market $225,000 Active 8 DOM
-
2026-06-08days on market $225,000 Active 7 DOM
-
2026-06-07days on market $225,000 Active 6 DOM
-
2026-06-03days on market $225,000 Active 2 DOM
-
2026-06-02remarks 688-char remark
-
2026-06-02$225,000 Active 1 DOM
ⓘ Source: listings_history table (triggers on properties + properties_extension) + one-shot
backfill from property_details.listing_events for pre-trigger history.
Tax reassessment forecast LA · Resets to sale price
- Current annual tax
- $862 · $72/mo
- Projected year-2 tax
- $1,238 · $103/mo
- Expected delta
- +$375/yr (+$31/mo · 43.5%)
ⓘ Screening estimate from a state-policy table — verify with the county assessor before closing.
Climate risk First Street
- Flood 4/10 Moderate FEMA zone X (shaded) · 22% chance over 30 yrs
- Wildfire 4/10 Moderate
- Heat 9/10 Extreme 7 d/yr ≥109°F today · 21 d/yr by 30 yrs out
- Wind 9/10 Extreme 99% chance of damaging wind over 30 yrs
- Air quality 2/10 Low 0 unhealthy d/yr today · 1 by 30 yrs out
Nearby sold comps map
Loading sold comps map…
Walkable amenities ~0.75 mi
Loading nearby amenities…
Taxation est. · year 1
- Rental income
- $25,236
- − Mortgage interest
- −$12,603
- − Property taxes
- −$862
- − Insurance
- −$1,125
- − Repairs & maintenance
- −$2,019
- − Management
- −$2,019
- − Depreciation
- −$6,545
- Taxable income
- $62
- Est. tax owed @ 24.0%
- −$15
- After-tax cash flow
- $3,775/yr
For passive investors: Depreciation is non-cash, so a rental often shows a tax loss while cash-flowing — sheltering income. Rental losses are passive: they offset passive income freely, and up to $25,000/yr can offset ordinary (W-2) income if you actively participate and your MAGI is under $100k (phasing out to $0 by $150k); unused losses carry forward. On sale, claimed depreciation is recaptured at up to 25%, and gains may owe capital-gains tax (a 1031 exchange can defer both). Figures are a year-1 estimate at your 24.0% rate — not tax advice; consult a CPA.
Schools (NCES district)
- District
- St. Tammany Parish
- NCES district ID
- 2201650
- Math proficiency
- 43% ▼ -32.00%
- Reading proficiency
- 55% ▼ -26.00%
- Median HH income
- $61,752
- Composite
- 43.04/100
- National rank
- #3098
- State rank
- #11 of 98 in LA
Livability — Covington
- Score
- 75/100
- State rank
- #17
- US rank
- #3876
Category grades
Schools grade is shown separately in the Schools card above.
Census & demographics
- County
- Saint Tammany Parish · 228,296 people
- City population
- 64,351
- Metro
- New Orleans-Metairie, LA
- Population (ZIP)
- 41,876
- Household income
- $81,241
- Rent vs Own
- Severe rent burden
- 1287.0
Population outlook (St. Tammany County) Hauer SSP2
- Today (2025)
- 286,725 people
- By 2030
- 304,175 · +6.1%
- By 2040
- 336,203 · +17.3%
- By 2050
- 364,590 · +27.2%
- By 2075
- 433,362 · +51.1%
- By 2100
- 470,333 · +64.0%
Race, ethnicity, and origin ACS 2023
- Neighborhood character
- Predominantly White (78%)
- Race & ethnicity
- White 78% Black 9% Hispanic / Latino 7% Two or more races 7% Native American 1% Asian 1%
- Hispanic origin (detail)
- Mexican 2%
- Common ancestry
- Lithuanian 17% Italian 2% Slovak 2%
- Foreign-born
- 5% · Canada, Vietnam
- Languages at home
- 92% English-only · Spanish 5% French/Haitian/Cajun 1% Vietnamese 1%
Political lean MEDSL · St. Tammany
- 2024 margin
- Solid R (+43.8) · D 27.3% · R 71.1% · Other 1.6%
- 2008→2024 swing
- +9.6pp toward D · 2008: -53.4pp · 2024: -43.8pp
- All cycles
- 2024: R+43.8 2020: R+44.2 2016: R+50.8 2012: R+52.2 2008: R+53.4
Not yet ingested
- Civics
- —
Market trends
- HPI YoY
- ▼ -112.14%
- Current HPI
- 181.8348
- Rent YoY
- ▲ 4.31%
- Metro
- New Orleans-Metairie, LA
- State GDP YoY
- ▲ 3.29%
- F500 in state
- 10
Industry mix (Fortune 500 HQ in LA)
| Industry | F500 HQs | Revenue |
|---|---|---|
| Telecommunications | 2 | $23B |
|
||
| Utilities | 1 | $12B |
|
||
| Wholesale / Distribution | 1 | $5B |
|
||
| Advertising | 1 | $2B |
|
||
Price history
+45.6% since first listed5 events — show timeline
- 2026-06-01 Listed $225,000 AcadianaMLS
- 2026-06-01 Listed $225,000 GSREIN
- 2014-01-10 Sold (MLS) $142,000 GSREIN
- 2013-11-20 Listed $154,500 AcadianaMLS
- 2013-11-20 Listed $154,500 GSREIN
Property tax history
-6.9%/yrLatest (2025): $862 · -3.4% YoY. Source: county tax records.
Cash-flow waterfall
monthlySold comps — $/sqft
last 12 mo · ≤1 miLoading sold comps…