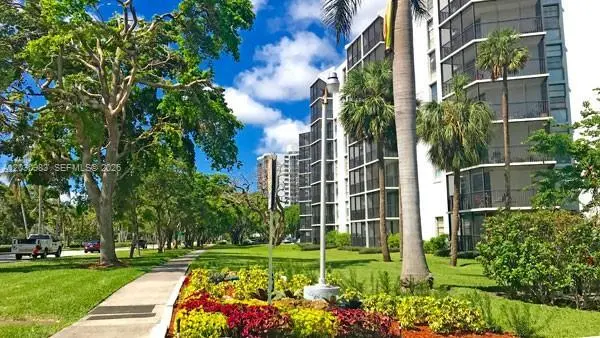
3475 N Country Club Dr #608 · Aventura, FL
Flood risk 8/10 · Major
- FEMA flood zone
- AE
- Chance of flooding over 30 yrs
- 0.97%
- Est. flood insurance / yr
- $1,737 – $8,500
Fire risk 1/10 · Minimal
- Est. fire insurance / yr
- $947 – $1,759
Heat risk 10/10 · Severe
- Hot days now (above 103°F)
- 6 days/yr
- Hot days in 30 yrs
- 22 days/yr
Wind risk 10/10 · Severe
- Chance of severe wind over 30 yrs
- 99.0%
Air-quality risk 2/10 · Minimal
- Unhealthy air days now
- 1 days/yr
- Unhealthy air days in 30 yrs
- 2 days/yr
Risk factors via First Street. Map © Google.
Why this score? — see what drove the C+ grade
The composite is a weighted blend of 9 inputs, each scored 0–100. Each bar is that input's sub-score; the figure is the points it added to the 100-point composite (weight × sub-score).
- Cash flow +22.9/30.0
- 1% rule +10.0/10.0
- ARV discount +7.5/15.0
- DSCR +7.3/10.0
- Schools +5.0/10.0
- Livability +4.0/5.0
- Condition / age +2.5/5.0
- Rent growth +2.1/5.0
- Appreciation +0.0/10.0
$269,000
🖨 Deal sheet 📄 Offer letter ✓ Due diligence
Listing remarks
Discover this spacious and well-maintained 2-bedroom, 2-bathroom residence located on the 6th floor of Ensenada Condominium. Enjoy beautiful open views and an unbeatable location just steps from the renowned Turnberry Isle Golf Course. Features Include: Private balcony with relaxing views Generous closet space, including a walk-in closet Bright and spacious living areas HOA includes Wi-Fi, cable, internet, and hot water Community Amenities, Swimming pool, Fitness center, BBQ area, Guest parking, All ages welcome
Key facts
- Fitness center
- Private balcony
- Walk-in closet
Tags
Property features AI
Finance
- Financial info: Pets not allowed
- HOA & community: Monthly association fee of $929; Association covers common areas, cable TV, pools, security, trash and water; Community amenities include clubhouse, elevators, pool and trash service
Exterior
- Parking: Detached garage with one covered space
- Security: Secured elevator; Key card entry; Security guard; Smoke detectors
- Utilities: Electric service with fuses
- Home design: Attached property; 8 total stories; Entry located on level 6
- Construction: Block construction; Resale property
- Exterior features: Balcony; Screened balcony; Canal-front and lake-front waterfront; Association pool
Interior
- Kitchen: Microwave; Refrigerator
- Flooring: Ceramic tile; Laminate
- Bathrooms: 2 full bathrooms
- Heating & cooling: Central heating (electric); Central air (electric)
- Interior features: Split bedroom floor plan; Bedroom on main level
Neighborhood map
What this means for you Summary
Snapshot
- This is a 2-bed/2.0-bath condo listed at $269k.
Deal economics
- At list price, monthly cash flow is $44 ($534/yr) — positive.
- The deal already cash-flows at list — no discount required.
- Meets the 1% rule at list price ($4k rent vs $269k).
- Cap rate 8.4% vs local median 2.6% in Aventura — top-decile yield for the area; either an underpriced asset or a hidden risk that comps aren't pricing in. Stress-test before assuming the spread holds.
Location & tenants
- Location reads 80/100 on livability (#127 in FL, #1,834 nationally) — a professional / high-income tenant draw. Strengths: schools A+, health & safety A+, amenities A; Watch: crime D+, cost of living F.
- Market conditions: Rents soft (-1.5%/yr); 985 active listings in the ZIP; 40 comparable units currently listed for rent nearby; rentals at typical pace (median 17d on market — plan ~3-4 weeks tenant-placement turnaround); solid renter incomes; 10,051 units permitted in Miami-Dade County in 2024 (7,758 in 5+ unit buildings).
- At $4,043/mo this rent would consume 53% of the median local household income ($91k/yr) (locally 1838% of renters already pay >50% of income on rent) — very limited rent-growth headroom before tenants either downsize or default.
Forward outlook
- Local home prices are declining (-3.0%/yr); year-one equity from $2k of loan paydown is wiped out by about $8k of value loss. Plan a longer hold.
- Miami-Dade County population projected at +28% by 2050 — long-run rental-demand tailwind backs the buy-and-hold thesis.
Negotiation context
- Only 13 days on market — expect competitive offers; lowballing is unlikely to land.
- 3 sale attempts since 12y ago with the ask held roughly flat each time — persistent listings suggest the price (not the market) is what's stuck; bring a comps-based counter.
- Current owner paid $135k; list at $269k implies a 99% gain — meaningful room to come down on a strong offer.
Risks & watch-outs
- Watch-outs: flood insurance adds $427/mo; HOA is 23% of rent.
- Climate carrying-cost: in FEMA flood zone AE (mandatory federal flood insurance); severe wind risk, 99% chance of damaging wind over 30y; extreme-heat days projected 6→22/yr by 2055 (HVAC capex compounding) — expect insurance premiums to compound above CPI over the hold.
Questions for the listing agent
- Built in 1971 — when were the roof, HVAC, electrical panel, plumbing, and water heater last replaced?
- What's the actual annual flood-insurance premium (NFIP or private), and is the property in a SFHA with mandatory coverage?
- What does the HOA fee cover, when was the last increase, and are there any pending special assessments or reserve-fund shortfalls?
- Any open or pending special assessments — roof, HVAC, plumbing, elevator, façade? What's the per-unit balance and payoff schedule, and is the seller paying it off at close or rolling it to the buyer?
- Is there a deadline driving the sale (1031 exchange, divorce, estate, relocation)? That informs how much negotiation room exists.
- Schools are A-rated — typically a magnet for longer-tenancy family renters. What's the average tenant stay here, and is there a school-zone premium baked into asking?
- Crime grade is D in this area — have there been break-ins, vandalism, or insurance claims at this property in the last 3 years? What carrier currently insures it and at what premium?
- What's the average days-on-market for RENTAL listings here right now (not sales)? A rising rental-DOM trend means longer vacancies and softer asking-rent achievability than the comps imply.
- What's the recent tenant-quality profile in this submarket — average credit score on applications, eviction rate, late-payment / NSF rate, and stable-employment percentage? A property-management company in the area should have these aggregated.
- How much new apartment / multifamily construction is in the pipeline within 1–3 miles? Heavy new supply (>2% of stock underway) typically softens rents 12–24 months out; light construction supports rent growth.
Investment metrics
- 1% rule
- 1.50% ✓
- Cap rate
- 8.39%
- Cash-on-cash
- 7.50%
- DSCR
- 1.33
- GRM
- 5.5
CMA / ARV
No comps found within radius.
Projected returns pro-forma
-3.0% appreciation · 0.0% rent growth · sell at horizon
- IRR
- -20.7%
- Equity multiple
- 0.31×
- Total profit
- $-51,751
- Equity at exit
- $40,109
- IRR
- -34.4%
- Equity multiple
- -0.11×
- Total profit
- $-83,737
- Equity at exit
- $23,258
Cash invested: $75,320 (down + closing). Projections, not guarantees.
Landlord ↔ Tenant lean methodology
- Overall (STATE)
- 87 Strongly Landlord-Friendly
- State Florida
- 87 Strongly Landlord-Friendly · R+3
- County
- — inherits STATE
- City
- — inherits STATE
ZIP-level market 33180
- Rents YoY
- -1.5%
- Active inventory
- 985
- Price-to-rent
- 5.5×
Monthly cashflow live
- Estimated rent
- $4,043 high interval (Pro) →
- Mortgage (P&I)
- −$1,411
- Tax from tax record
- −$271 /mo · $3,257/yr
- Insurance
- −$112
- Flood insurance flood zone
- −$427 /mo · $5,118/yr
- HOA
- −$929
- Vacancy / Maint / Mgmt
- −$849
- Net cashflow
- $44
Break-even live
UW: 25.0% down · 7.5% · 30yr · 1.5% tax · 5.0% vac · 8.0% maint · 8.0% mgmt
Financing live
Cash to close
- Down payment
- $67,250
- Closing costs
- $8,070
- Reserves months
- —
- Total cash needed
- —
Loan-product check · same deal, 3 products live
Conventional
25% down · 7.5% · 30yr
- Down + closing
- —
- Monthly P&I
- —
- Monthly cashflow
- —
- DSCR
- —
- Eligible?
- —
Personal DTI + credit; lowest rate.
DSCR
20% down · 8.5% · 30yr
- Down + closing
- —
- Monthly P&I
- —
- Monthly cashflow
- —
- DSCR
- —
- Eligible?
- —
No personal income docs; deal must DSCR.
Hard money
10% down · 12.0% · 12mo
- Down + closing
- —
- Monthly P&I
- —
- Monthly cashflow
- —
- DSCR
- —
- Eligible?
- —
Short-term bridge; refi at stabilization.
Rent comps 40 comps
| Address | Beds | Baths | Sqft | Rent | $/sqft | DOM | Units | Dist |
|---|---|---|---|---|---|---|---|---|
| 3180 S Ocean Dr #1709 Hallandale Beach, FL | 2.0 | 2.0 | 1105 | $4,000 | $3.62 | 7d | 1 | 0.95mi |
| 3180 S Ocean Dr Hallandale Beach, FL | 2.0–3.0 | 2.0 | 1263 | $3,750 | $2.97 | 20d | 2 | 0.95mi |
| 3180 S Ocean Dr Hallandale Beach, FL | 2.0–3.0 | 2.0 | 1285 | $3,650 | $2.84 | 24d | 3 | 0.95mi |
| 2069 S Ocean Dr Unit TH12 Hallandale Beach, FL | 3.0 | 3.0 | 1500 | $4,800 | $3.20 | 10d | 1 | 0.97mi |
| 2069 S Ocean Dr Unit TH12 Hallandale Beach, FL | 3.0 | 3.0 | 1500 | $4,800 | $3.20 | 24d | 1 | 0.97mi |
| 2017 S Ocean Dr #1107 Hallandale Beach, FL | 2.0 | 2.0 | 1270 | $3,900 | $3.07 | 13d | 1 | 0.98mi |
| 3140 S Ocean Dr Hallandale Beach, FL | 2.0 | 2.0 | 1100 | $4,250 | $3.86 | 1d | 2 | 0.99mi |
| 2065 S Ocean Dr Unit 1049793P Hallandale Beach, FL | 2.0 | 2.0 | 871 | $4,971 | $5.71 | 7d | 1 | 1.00mi |
| 2080 S Ocean Dr Hallandale Beach, FL | 2.0–3.0 | 2.0–2.5 | 1270 | $3,900 | $3.07 | 24d | 7 | 1.02mi |
| 2080 S Ocean Dr Hallandale Beach, FL | 2.0–3.0 | 2.0–2.5 | 1270 | $3,800 | $2.99 | 3d | 11 | 1.02mi |
| 2080 S Ocean Dr #6 Hallandale Beach, FL | 2.0 | 2.0 | 1165 | $4,500 | $3.86 | 24d | 1 | 1.03mi |
| 2080 S Ocean Dr #3 Hallandale Beach, FL | 2.0 | 2.0 | 1260 | $5,000 | $3.97 | 24d | 1 | 1.03mi |
| 2080 S Ocean Dr #8 Hallandale Beach, FL | 2.0 | 2.0 | 1100 | $4,000 | $3.64 | 24d | 1 | 1.03mi |
| 201 Golden Isles Dr #302 Hallandale Beach, FL | 2.0 | 2.0 | 1150 | $3,975 | $3.46 | 24d | 1 | 1.06mi |
| 2030 S Ocean Dr Hallandale Beach, FL | 2.0 | 2.0 | 1280 | $4,850 | $3.79 | 4d | 7 | 1.06mi |
| 2030 S Ocean Dr Hallandale Beach, FL | 2.0 | 2.0 | 1280 | $4,750 | $3.71 | 2d | 9 | 1.06mi |
| 2030 S Ocean Dr Hallandale Beach, FL | 2.0 | 2.0 | 1280 | $4,825 | $3.77 | 24d | 9 | 1.06mi |
| 2030 S Ocean Dr Hallandale Beach, FL | 2.0 | 2.0 | 1280 | $4,800 | $3.75 | 2d | 7 | 1.06mi |
| 2030 S Ocean Dr Hallandale Beach, FL | 2.0 | 2.0 | 1280 | $4,775 | $3.73 | 2d | 8 | 1.06mi |
| 1985 S Ocean Dr Unit 21P Hallandale Beach, FL | 2.0 | 2.0 | 1380 | $3,800 | $2.75 | 7d | 1 | 1.07mi |
| 1985 S Ocean Dr Unit 22P Hallandale Beach, FL | 2.0 | 2.0 | 1380 | $4,000 | $2.90 | 24d | 1 | 1.07mi |
| 1985 S Ocean Dr Unit 9G Hallandale Beach, FL | 2.0 | 2.0 | 1240 | $3,700 | $2.98 | 24d | 1 | 1.07mi |
| 121 Golden Isles Dr #1 Hallandale Beach, FL | 2.0 | 2.0 | 1379 | $4,000 | $2.90 | 24d | 1 | 1.16mi |
| 1945 S Ocean Dr Hallandale Beach, FL | 2.0–3.0 | 2.0–3.0 | 1542 | $4,500 | $2.92 | 7d | 2 | 1.18mi |
| 1945 S Ocean Dr Hallandale Beach, FL | 2.0–3.0 | 2.0–3.0 | 1542 | $4,500 | $2.92 | 12d | 2 | 1.18mi |
| 1945 S Ocean Dr Hallandale Beach, FL | 2.0–3.0 | 2.0–2.5 | 1522 | $3,650 | $2.40 | 18d | 3 | 1.18mi |
| 1945 S Ocean Dr Hallandale Beach, FL | 2.0–3.0 | 2.0–3.0 | 1542 | $4,000 | $2.59 | 14d | 3 | 1.18mi |
| 1950 S Ocean Dr Unit 3D Hallandale Beach, FL | 1.0 | 1.5 | 870 | $3,950 | $4.54 | 5d | 1 | 1.19mi |
| 1950 S Ocean Dr Unit 12M Hallandale Beach, FL | 1.0 | 1.5 | 870 | $3,800 | $4.37 | 1d | 1 | 1.19mi |
| 1950 S Ocean Dr Unit 12M Hallandale Beach, FL | 1.0 | 1.5 | 870 | $3,800 | $4.37 | 17d | 1 | 1.19mi |
| 1950 S Ocean Dr Unit 3D Hallandale Beach, FL | 1.0 | 1.5 | 870 | $3,950 | $4.54 | 12d | 1 | 1.19mi |
| 1180 E Hallandale Beach Blvd Unit 1241877P Hallandale Beach, FL | 1.0–2.0 | 1.0–2.0 | 844 | $5,453 | $6.46 | 3d | 2 | 1.23mi |
| 1904 S Ocean Dr #1707 Hallandale Beach, FL | 2.0 | 2.0 | 1350 | $5,000 | $3.70 | 24d | 1 | 1.29mi |
| 215 SE 5th St Hallandale Beach, FL | 2.0–3.0 | 2.0 | 1133 | $2,700 | $2.38 | 24d | 5 | 1.29mi |
| 1880 N Ocean Dr Unit TS705 Hallandale Beach, FL | 2.0 | 2.0 | 1350 | $5,000 | $3.70 | 24d | 1 | 1.31mi |
| 1880 N Ocean Dr Unit TS705 Hallandale Beach, FL | 2.0 | 2.0 | 1350 | $4,900 | $3.63 | 14d | 1 | 1.31mi |
| 1880 N Ocean Dr Unit TS705 Hallandale Beach, FL | 2.0 | 2.0 | 1350 | $5,000 | $3.70 | 16d | 1 | 1.31mi |
| 211 SE 4th St #3 Hallandale Beach, FL | 3.0 | 2.5 | 1290 | $3,950 | $3.06 | 24d | 1 | 1.35mi |
| 223 SW 10th St Hallandale Beach, FL | 3.0 | 3.0 | 1289 | $3,900 | $3.03 | 24d | 1 | 1.37mi |
| 2602 E Hallandale Beach Blvd Hallandale Beach, FL | 3.0 | 1.0–3.0 | 1011 | $5,495 | $5.44 | 1d | 5 | 1.40mi |
HOA detail condo
- Monthly dues
- $929 · $11,148/yr
- Likely covers
- waterinternetcablepoolgym
- Assessments
- None detected in remarks — confirm with the listing agent.
Listing history 9 events
-
2026-06-18days on market $269,000 Active 13 DOM
-
2026-06-17days on market $269,000 Active 12 DOM
-
2026-06-16days on market $269,000 Active 11 DOM
-
2026-06-15days on market $269,000 Active 10 DOM
-
2026-06-13days on market $269,000 Active 8 DOM
-
2026-06-09days on market $269,000 Active 4 DOM
-
2026-06-08days on market $269,000 Active 3 DOM
-
2026-06-07remarks 523-char remark
-
2026-06-07$269,000 Active 2 DOM
ⓘ Source: listings_history table (triggers on properties + properties_extension) + one-shot
backfill from property_details.listing_events for pre-trigger history.
Tax reassessment forecast FL · Resets to sale price
- Current annual tax
- $3,257 · $271/mo
- Projected year-2 tax
- $3,257 · $271/mo
- Expected delta
- $0/yr ($0/mo · 0.0%)
ⓘ Screening estimate from a state-policy table — verify with the county assessor before closing.
Climate risk First Street
- Flood 8/10 Severe FEMA zone AE · 97% chance over 30 yrs
- Wildfire 1/10 Low
- Heat 10/10 Extreme 6 d/yr ≥103°F today · 22 d/yr by 30 yrs out
- Wind 10/10 Extreme 99% chance of damaging wind over 30 yrs
- Air quality 2/10 Low 1 unhealthy d/yr today · 2 by 30 yrs out
Nearby sold comps map
Loading sold comps map…
Walkable amenities ~0.75 mi
Loading nearby amenities…
Taxation est. · year 1
- Rental income
- $48,519
- − Mortgage interest
- −$15,068
- − Property taxes
- −$3,257
- − Insurance
- −$6,464
- − Repairs & maintenance
- −$3,882
- − Management
- −$3,882
- − HOA
- −$11,148
- − Depreciation
- −$7,825
- Taxable loss
- −$3,006
- Est. tax savings @ 24.0%
- +$721
- After-tax cash flow
- $1,255/yr
For passive investors: Depreciation is non-cash, so a rental often shows a tax loss while cash-flowing — sheltering income. Rental losses are passive: they offset passive income freely, and up to $25,000/yr can offset ordinary (W-2) income if you actively participate and your MAGI is under $100k (phasing out to $0 by $150k); unused losses carry forward. On sale, claimed depreciation is recaptured at up to 25%, and gains may owe capital-gains tax (a 1031 exchange can defer both). Figures are a year-1 estimate at your 24.0% rate — not tax advice; consult a CPA.
Schools (NCES district)
No district data.
Livability — Aventura
- Score
- 80/100
- State rank
- #127
- US rank
- #1834
Category grades
Schools grade is shown separately in the Schools card above.
Census & demographics
- Census place
- Aventura, FL
- County
- Miami-Dade County · 2,697,751 people
- City population
- 34,147
- Metro
- Miami-Fort Lauderdale-Pompano Beach, FL
- Population (ZIP)
- 34,147
- Household income
- $91,055
- Rent vs Own
- Severe rent burden
- 1838.0
Population outlook (Miami-Dade County) Hauer SSP2
- Today (2025)
- 3,126,439 people
- By 2030
- 3,325,765 · +6.4%
- By 2040
- 3,697,561 · +18.3%
- By 2050
- 4,012,134 · +28.3%
- By 2075
- 4,605,612 · +47.3%
- By 2100
- 4,866,598 · +55.7%
Race, ethnicity, and origin ACS 2023
- Neighborhood character
- Diverse neighborhood (Simpson 0.59)
- Race & ethnicity
- White 46% Hispanic / Latino 45% Two or more races 28% Black 2% Asian 2%
- Hispanic origin (detail)
- Mexican 2% Puerto Rican 2% Cuban 7% Dominican 1% Salvadoran 6%
- Common ancestry
- Scotch-Irish 5% Romanian 5% Italian 3%
- Foreign-born
- 52% · Canada, Jamaica, Dominican Republic
- Languages at home
- 30% English-only · Spanish 49% Other Indo-European 6% Russian/Polish/Slavic 4%
Political lean MEDSL · Miami-Dade
- 2024 margin
- R (+11.4) · D 43.9% · R 55.4%
- 2008→2024 swing
- -27.6pp toward R · 2008: 16.1pp · 2024: -11.4pp
- All cycles
- 2024: R+11.4 2020: D+7.3 2016: D+29.6 2012: D+23.7 2008: D+16.1
Not yet ingested
- Civics
- —
Market trends
- HPI YoY
- ▼ -343.81%
- Current HPI
- 234.7715
- Rent YoY
- ▼ -1.51%
- Metro
- Miami-Fort Lauderdale-Pompano Beach, FL
- State GDP YoY
- ▲ 3.28%
- F500 in state
- 36
Industry mix (Fortune 500 HQ in FL)
| Industry | F500 HQs | Revenue |
|---|---|---|
| Industrial Technology | 2 | $29B |
|
||
| Insurance | 2 | $17B |
|
||
| Retail | 1 | $60B |
|
||
| Technology Distribution | 1 | $58B |
|
||
| Homebuilding | 1 | $35B |
|
||
| Technology Manufacturing | 1 | $35B |
|
||
Price history
+99.3% since first listed9 events — show timeline
- 2026-06-04 Listed $269,000 MARMLS
- 2023-07-08 Rental Removed — MARMLS
- 2015-01-05 Listing Removed — MARMLS
- 2015-01-05 Pending — MARMLS
- 2014-12-16 Price Changed $188,500 MARMLS
- 2014-12-15 Listed $150,000 MARMLS
- 2014-07-29 Listing Removed — MARMLS
- 2014-04-02 Listed $239,000 MARMLS
- 2002-12-19 Sold (Public Records) $135,000 Public Records
Property tax history
+9.7%/yrLatest (2025): $3,257 · -12.8% YoY. Source: county tax records.
Cash-flow waterfall
monthlySold comps — $/sqft
last 12 mo · ≤1 miLoading sold comps…