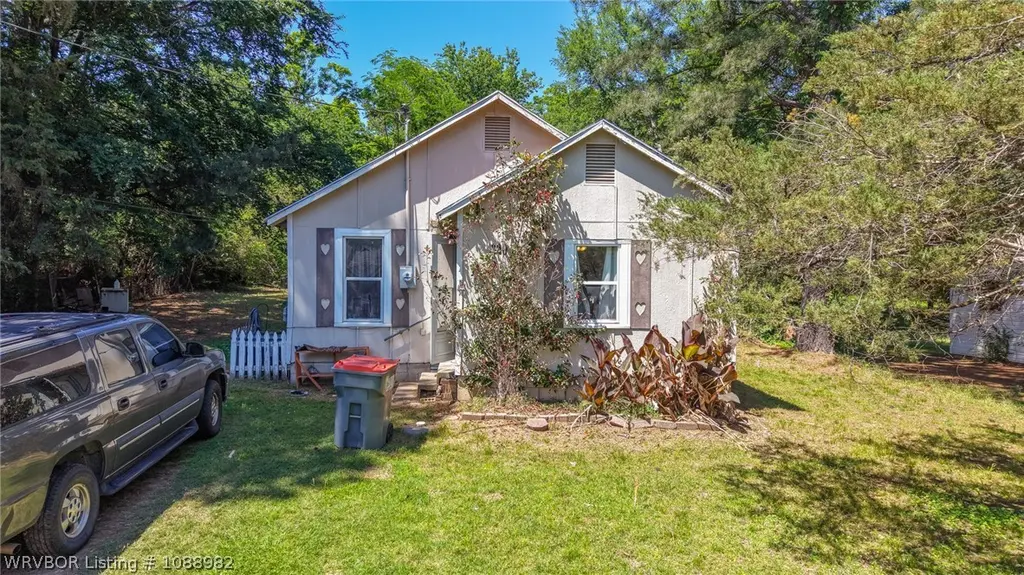
320 W Gary St · Greenwood, AR
Flood risk 1/10 · Minimal
- FEMA flood zone
- X (unshaded)
- Chance of flooding over 30 yrs
- 0.0%
- Est. flood insurance / yr
- $507 – $1,088
Fire risk 6/10 · Moderate
- Est. fire insurance / yr
- $1,499 – $2,785
Heat risk 6/10 · Moderate
- Hot days now (above 112°F)
- 7 days/yr
- Hot days in 30 yrs
- 20 days/yr
Wind risk 2/10 · Minimal
- Chance of severe wind over 30 yrs
- 2.0%
Air-quality risk 2/10 · Minimal
- Unhealthy air days now
- 0 days/yr
- Unhealthy air days in 30 yrs
- 1 days/yr
Risk factors via First Street. Map © Google.
Why this score? — see what drove the C grade
The composite is a weighted blend of 9 inputs, each scored 0–100. Each bar is that input's sub-score; the figure is the points it added to the 100-point composite (weight × sub-score).
- Cash flow +18.3/30.0
- ARV discount +14.3/15.0
- DSCR +5.8/10.0
- Schools +5.0/10.0
- 1% rule +4.0/10.0
- Livability +3.6/5.0
- Rent growth +2.5/5.0
- Condition / age +2.5/5.0
- Appreciation +0.0/10.0
$85,000
🖨 Deal sheet (PDF) 📄 Offer letter ✓ Due diligence
Listing remarks
Welcome to 320 West Gary Street! Just up the street from the 4-Way Stop by the Junior High! It's the one with the sweet heart shaped shutters. Located on an established street in the heart of Greenwood, this 2 bedroom, 1 bath home offers a great opportunity for an investor or someone ready to step into homeownership. Inside, you’ll find light wood-look laminate flooring, neutral gray tones, an eat-in kitchen with generous cabinet space. It is always so nice to see a window above the sink that brings in natural light. The bathroom features a tub/shower combination, and the layout offers comfortable everyday living. Situated on a lot surrounded by mature trees, the real standout of this
Key facts
- Eat-in kitchen
- Mature trees
- 0.26 acre lot
Tags
Property features AI
Exterior
- Parking: Gravel parking
- Security: Smoke detector(s)
- Utilities: Public water; Sewer available; Electricity available; Natural gas available
- Home design: Single-family house; One story
- Construction: Masonite exterior; Asphalt shingle roof
- Exterior features: Partial fencing; City lot; Paved road frontage; Lot dimensions approximately 65' x 169' x 70' x 170'
Interior
- Kitchen: Range
- Flooring: Vinyl
- Bathrooms: 1 full bathroom
- Heating & cooling: Central heating (natural gas, electric); Central air conditioning (electric)
- Interior features: Eat-in kitchen; Smoke detector(s)
- Laundry & utility: Washer hookup; Electric dryer hookup; Electric water heater
Neighborhood map
What this means for you Summary
Snapshot
- This is a 2-bed/1.0-bath single-family listed at $85k.
Deal economics
- At list price, monthly cash flow is $78 ($940/yr) — positive.
- The deal already cash-flows at list — no discount required.
- To meet the 1% rule (rent ≥ 1% of price), the offer needs to be $76k (10.4% below list).
- Recommended offer: $76k (10.4% below list) — sets the bar for 1% rule.
- Cap rate 7.4% vs local median 3.6% in Greenwood — top-decile yield for the area; either an underpriced asset or a hidden risk that comps aren't pricing in. Stress-test before assuming the spread holds.
Location & tenants
- Location reads 72/100 on livability (#35 in AR) — a middle-class / working-renter tenant base. Strengths: cost of living A+, housing A+, crime A; Watch: amenities F, commute F, health & safety D-.
- Greenwood School District (town): math 59% / reading 58% proficiency, ranked #5 of 238 in AR (top 2%) — acceptable for families but not a draw, mixed tenant base, ~2y average lease.
- Zoned schools: Westwood Elementary School (math 77% / reading 58%, grade B+, #17 of 454 statewide, top 4%, 823 students, 38% FRL); Greenwood Junior High School (math 60% / reading 62%, grade B+, #10 of 201 statewide, top 4%, 632 students, 30% FRL); Greenwood High School (math 38% / reading 52%, grade D-, #27 of 292 statewide, top 10%, 879 students, 20% FRL) — zoned schools at 29% FRL track the district average.
- Market conditions: 147 active listings in the ZIP; 7 comparable units currently listed for rent nearby; rentals at typical pace (median 15d on market — plan ~3-4 weeks tenant-placement turnaround); 388 units permitted in Sebastian County in 2024 (16 in 5+ unit buildings).
Forward outlook
- Local home prices are declining (-3.0%/yr); year-one equity from $588 of loan paydown is wiped out by about $3k of value loss. Plan a longer hold.
- Sebastian County population projected at +7% by 2050 — modest demand growth; plan on rents tracking national, not racing it.
Negotiation context
- It's been on market 39 days — a 3% lower offer ($82k) is reasonable based on typical stale-listing flexibility.
- Current owner paid $35k; list at $85k implies a 143% gain — meaningful room to come down on a strong offer.
Risks & watch-outs
- Climate carrying-cost: major wildfire risk; extreme-heat days projected 7→20/yr by 2055 (HVAC capex compounding) — expect insurance premiums to compound above CPI over the hold.
Questions for the listing agent
- It's been on market 39 days. Have you received any prior offers? Is the seller open to a 10% concession, seller financing, or rate buy-down credit?
- Is there a deadline driving the sale (1031 exchange, divorce, estate, relocation)? That informs how much negotiation room exists.
- Schools are B-rated — typically a magnet for longer-tenancy family renters. What's the average tenant stay here, and is there a school-zone premium baked into asking?
- What's the average days-on-market for RENTAL listings here right now (not sales)? A rising rental-DOM trend means longer vacancies and softer asking-rent achievability than the comps imply.
- What's the recent tenant-quality profile in this submarket — average credit score on applications, eviction rate, late-payment / NSF rate, and stable-employment percentage? A property-management company in the area should have these aggregated.
- How much new for-sale + rental construction is in the pipeline within 1–3 miles? Heavy new supply typically softens prices + rents 12–24 months out; constrained supply supports both.
Investment metrics
- 1% rule
- 0.90% ✗
- Cap rate
- 7.40%
- Cash-on-cash
- 3.95%
- DSCR
- 1.18
- GRM
- 9.3
CMA / ARV
- ARV (median comp)
- $100,201
- List price
- $85,000
- Delta
- -15.17%
- Verdict
- UNDERPRICED
- Comps
- 16 within 1.0 mi
Show comp detail 2 sales within ~0.75 mi
| Address | Dist | Beds/Ba | Sqft | Sold | Price | $/sf | Match |
|---|---|---|---|---|---|---|---|
| 531 E Denver St | 0.60mi | 2/1.0 | 848 (+8%) | 16mo | $80,000 | $94 | 46 |
| 108 N Coker St | 0.36mi | 2/2.0 | 900 (+14%) | 15mo | $93,500 | $104 | 43 |
Match score weights: distance 35% · size 25% · config 20% · recency 20%. Top-matched comps best support the ARV.
Projected returns pro-forma
-3.0% appreciation · 3.0% rent growth · sell at horizon
- IRR
- -10.2%
- Equity multiple
- 0.63×
- Total profit
- $-8,812
- Equity at exit
- $12,674
- IRR
- -0.8%
- Equity multiple
- 0.94×
- Total profit
- $-1,362
- Equity at exit
- $7,349
Cash invested: $23,800 (down + closing). Projections, not guarantees.
Landlord ↔ Tenant lean methodology
- Overall (STATE)
- 92 Strongly Landlord-Friendly
- State Arkansas
- 92 Strongly Landlord-Friendly · R+14
- County
- — inherits STATE
- City
- — inherits STATE
ZIP-level market 72936
- Home prices YoY
- -21.4%
- Active inventory
- 147
- Price-to-rent
- 9.3×
Monthly cashflow live
- Estimated rent
- $762 high interval (Pro) →
- Mortgage (P&I)
- −$446
- Tax from tax record
- −$42 /mo · $508/yr
- Insurance
- −$35
- HOA
- −$0
- Vacancy / Maint / Mgmt
- −$160
- Net cashflow
- $78
Break-even live
Sensitivity live
| Price | -10% $126 | -5% $102 | +0% $78 | +5% $54 | +10% $30 |
|---|---|---|---|---|---|
| Rent | -10% $18 | -5% $48 | +0% $78 | +5% $108 | +10% $139 |
| Rate | -1.0pp $121 | -0.5pp $100 | base $78 | +0.5pp $56 | +1.0pp $34 |
UW: 25.0% down · 7.5% · 30yr · 1.5% tax · 5.0% vac · 8.0% maint · 8.0% mgmt
Financing live
Cash to close
- Down payment
- $21,250
- Closing costs
- $2,550
- Reserves months
- —
- Total cash needed
- —
Loan-product check · same deal, 3 products live
Conventional
25% down · 7.5% · 30yr
- Down + closing
- —
- Monthly P&I
- —
- Monthly cashflow
- —
- DSCR
- —
- Eligible?
- —
Personal DTI + credit; lowest rate.
DSCR
20% down · 8.5% · 30yr
- Down + closing
- —
- Monthly P&I
- —
- Monthly cashflow
- —
- DSCR
- —
- Eligible?
- —
No personal income docs; deal must DSCR.
Hard money
10% down · 12.0% · 12mo
- Down + closing
- —
- Monthly P&I
- —
- Monthly cashflow
- —
- DSCR
- —
- Eligible?
- —
Short-term bridge; refi at stabilization.
Rent comps 7 comps
| Address | Beds | Baths | Sqft | Rent | $/sqft | DOM | Units | Dist |
|---|---|---|---|---|---|---|---|---|
| 300 E Knoxville St Unit 08 Greenwood, AR | 2.0 | 1.0 | 800 | $695 | $0.87 | 45d | 1 | 0.44mi |
| 300 E Knoxville St Unit 06 Greenwood, AR | 2.0 | 1.0 | 800 | $695 | $0.87 | 22d | 1 | 0.45mi |
| 830 W Denver St Unit 801 Greenwood, AR | 2.0 | 1.0 | 788 | $725 | $0.92 | 45d | 1 | 0.59mi |
| 336 W Dogwood St Unit 3 Greenwood, AR | 3.0 | 1.0 | 850 | $695 | $0.82 | 14d | 1 | 0.75mi |
| 340 W Dogwood St Unit 3 Greenwood, AR | 1.0 | 1.0 | 1000 | $600 | $0.60 | 14d | 1 | 0.77mi |
| 1139 W Denver St Greenwood, AR | 3.0 | 1.0 | 1006 | $1,250 | $1.24 | 14d | 1 | 0.92mi |
| 40 Grand Maple Dr Greenwood, AR | 3.0 | 1.0 | 1090 | $1,100 | $1.01 | 14d | 1 | 1.27mi |
Listing history 22 events
-
2026-06-21days on market $85,000 Active 39 DOM
-
2026-06-19days on market $85,000 Active 37 DOM
-
2026-06-18days on market $85,000 Active 36 DOM
-
2026-06-17days on market $85,000 Active 35 DOM
-
2026-06-16days on market $85,000 Active 34 DOM
-
2026-06-15days on market $85,000 Active 33 DOM
-
2026-06-14days on market $85,000 Active 31 DOM
-
2026-06-13days on market $85,000 Active 30 DOM
-
2026-06-10days on market $85,000 Active 28 DOM
-
2026-06-09days on market $85,000 Active 27 DOM
-
2026-06-08days on market $85,000 Active 26 DOM
-
2026-06-07days on market $85,000 Active 25 DOM
-
2026-06-05days on market $85,000 Active 22 DOM
-
2026-06-03days on market $85,000 Active 21 DOM
-
2026-06-02days on market $85,000 Active 20 DOM
-
2026-06-01days on market $85,000 Active 19 DOM
-
2026-05-31days on market $85,000 Active 18 DOM
-
2026-05-30days on market $85,000 Active 17 DOM
-
2026-05-11$85,000 Active 1166-char remark
-
2005-12-01soldstatus $35,000
-
1997-08-12soldstatus $34,000
-
1993-12-28soldstatus $10,000
ⓘ Source: listings_history table (triggers on properties + properties_extension) + one-shot
backfill from property_details.listing_events for pre-trigger history.
Tax reassessment forecast AR · Resets to sale price
- Current annual tax
- $508 · $42/mo
- Projected year-2 tax
- $544 · $45/mo
- Expected delta
- +$36/yr (+$3/mo · 7.1%)
ⓘ Screening estimate from a state-policy table — verify with the county assessor before closing.
Climate risk First Street
- Flood 1/10 Low FEMA zone X (unshaded) · 0% chance over 30 yrs
- Wildfire 6/10 Major
- Heat 6/10 Major 7 d/yr ≥112°F today · 20 d/yr by 30 yrs out
- Wind 2/10 Low 2% chance of damaging wind over 30 yrs
- Air quality 2/10 Low 0 unhealthy d/yr today · 1 by 30 yrs out
Nearby sold comps map
Loading sold comps map…
Walkable amenities ~0.75 mi
Loading nearby amenities…
Taxation est. · year 1
- Rental income
- $9,141
- − Mortgage interest
- −$4,761
- − Property taxes
- −$508
- − Insurance
- −$425
- − Repairs & maintenance
- −$731
- − Management
- −$731
- − Depreciation
- −$2,473
- Taxable loss
- −$488
- Est. tax savings @ 24.0%
- +$117
- After-tax cash flow
- $1,057/yr
For passive investors: Depreciation is non-cash, so a rental often shows a tax loss while cash-flowing — sheltering income. Rental losses are passive: they offset passive income freely, and up to $25,000/yr can offset ordinary (W-2) income if you actively participate and your MAGI is under $100k (phasing out to $0 by $150k); unused losses carry forward. On sale, claimed depreciation is recaptured at up to 25%, and gains may owe capital-gains tax (a 1031 exchange can defer both). Figures are a year-1 estimate at your 24.0% rate — not tax advice; consult a CPA.
Schools (NCES district)
- District
- Greenwood School District
- NCES district ID
- 0506990
- Math proficiency
- 59% ▼ -9.00%
- Reading proficiency
- 58% ▼ -4.00%
- Median HH income
- $55,015
- Composite
- 50.33/100
- National rank
- #1879
- State rank
- #5 of 238 in AR
Livability — Greenwood
- Score
- 72/100
- State rank
- #35
- US rank
- #6396
Category grades
Schools grade is shown separately in the Schools card above.
Census & demographics
- Census place
- Greenwood, AR
- Population (ZIP)
- 14,182
Population outlook (Sebastian County) Hauer SSP2
- Today (2025)
- 133,992 people
- By 2030
- 136,620 · +2.0%
- By 2040
- 140,832 · +5.1%
- By 2050
- 143,301 · +6.9%
- By 2075
- 147,964 · +10.4%
- By 2100
- 145,848 · +8.8%
Race, ethnicity, and origin ACS 2023
- Neighborhood character
- Predominantly White (85%)
- Race & ethnicity
- White 85% Two or more races 9% Hispanic / Latino 7%
- Hispanic origin (detail)
- Mexican 5%
- Common ancestry
- Slovak 3% Serbian 2% Italian 2%
- Foreign-born
- 2% · Canada, Jamaica
- Languages at home
- 96% English-only · Spanish 3%
Political lean MEDSL · Sebastian
- 2024 margin
- Solid R (+37.5) · D 30.0% · R 67.6% · Other 2.4%
- 2008→2024 swing
- -2.9pp toward R · 2008: -34.6pp · 2024: -37.5pp
- All cycles
- 2024: R+37.5 2020: R+35.5 2016: R+38.1 2012: R+37.1 2008: R+34.6
Not yet ingested
- Civics
- —
Market trends
- HPI YoY
- ▼ -60.40%
- Current HPI
- 222.3233
- Rent YoY
- —
- Metro
- —
- State GDP YoY
- ▲ 3.80%
- F500 in state
- 10
Industry mix (Fortune 500 HQ in AR)
| Industry | F500 HQs | Revenue |
|---|---|---|
| Retail | 1 | $681B |
|
||
| Food / Agriculture | 1 | $53B |
|
||
| Retail / Energy | 1 | $22B |
|
||
| Transportation / Logistics | 1 | $12B |
|
||
| Energy | 1 | $4B |
|
||
Price history
+750.0% since first listed4 events — show timeline
- 2026-05-11 Listed $85,000 WRVBOR
- 2005-12-01 Sold (Public Records) $35,000 Public Records
- 1997-08-12 Sold (Public Records) $34,000 Public Records
- 1993-12-28 Sold (Public Records) $10,000 Public Records
Property tax history
+3.0%/yrLatest (2025): $508 · +8.7% YoY. Source: county tax records.
Cash-flow waterfall
monthlySold comps — $/sqft
last 12 mo · ≤1 miLoading sold comps…