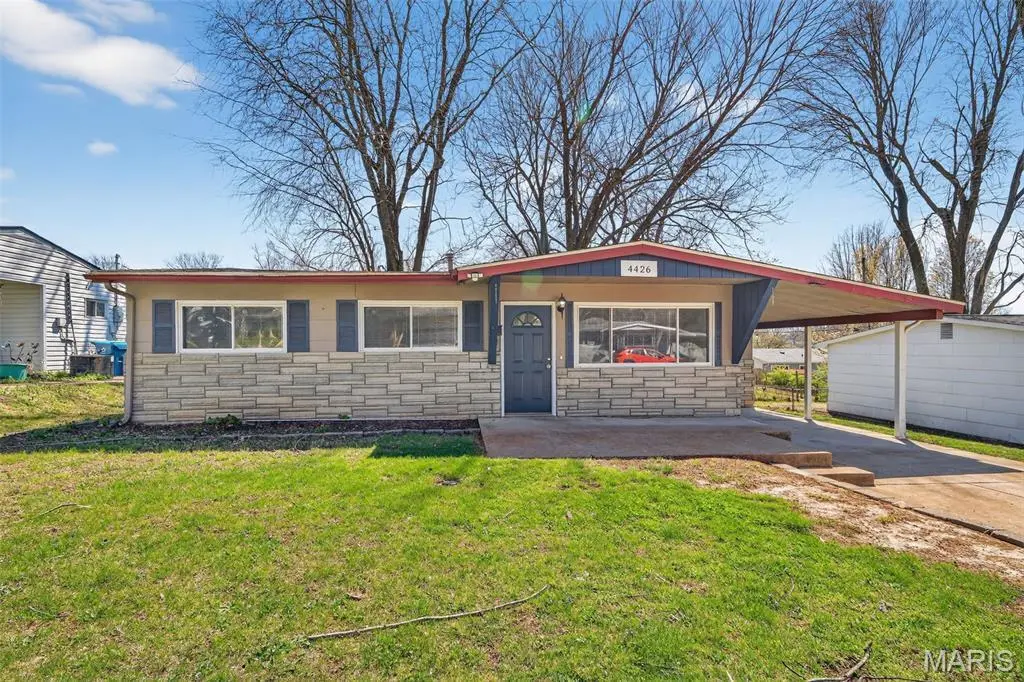
4426 Treadway Ln · Edmundson, MO
Flood risk 1/10 · Minimal
- FEMA flood zone
- X (unshaded)
- Chance of flooding over 30 yrs
- 0.0%
- Est. flood insurance / yr
- $507 – $1,088
Fire risk 1/10 · Minimal
- Est. fire insurance / yr
- $1,054 – $1,958
Heat risk 4/10 · Minor
- Hot days now (above 105°F)
- 7 days/yr
- Hot days in 30 yrs
- 21 days/yr
Wind risk 2/10 · Minimal
- Chance of severe wind over 30 yrs
- 1.0%
Air-quality risk 2/10 · Minimal
- Unhealthy air days now
- 1 days/yr
- Unhealthy air days in 30 yrs
- 3 days/yr
Risk factors via First Street. Map © Google.
Why this score? — see what drove the B- grade
The composite is a weighted blend of 9 inputs, each scored 0–100. Each bar is that input's sub-score; the figure is the points it added to the 100-point composite (weight × sub-score).
- Cash flow +27.2/30.0
- ARV discount +15.0/15.0
- DSCR +9.4/10.0
- 1% rule +7.0/10.0
- Livability +3.2/5.0
- Rent growth +2.9/5.0
- Condition / age +2.5/5.0
- Schools +1.7/10.0
- Appreciation +0.0/10.0
$114,900
🖨 Deal sheet 📄 Offer letter ✓ Due diligence
Listing remarks MLS
Check out this well maintained 3 bed 1 bath house currently occupied with tenants paying $850 a month! This home has a lot of space both indoor and out. Can be purchased in a package deal with four other rented properties, two of which are on the same street! Package deal MLS #'s 20065878, 20064615, 20065874, 20064599, 20064581.
Key facts
- Near dining
- Near shopping
- Near major highways
Tags
Neighborhood map
What this means for you Summary
Snapshot
- This is a 3-bed/1.0-bath single-family listed at $115k.
Deal economics
- At list price, monthly cash flow is $327 ($4k/yr) — positive.
- The deal already cash-flows at list — no discount required.
- Meets the 1% rule at list price ($1k rent vs $115k).
Location & tenants
- Location reads 63/100 on livability (#353 in MO) — a middle-class / working-renter tenant base. Strengths: cost of living A+, commute A-, housing B+; Watch: employment C-, crime F, amenities F.
- Ritenour (suburban): math 13% / reading 27% proficiency, ranked #304 of 324 in MO (top 94%) — low school quality limits family demand, transient renter base, plan for 1-2y turnover; 66% free/reduced lunch — lower-income household profile, screen leases tightly.
- Zoned schools: Kratz Elem. (math 9% / reading 25%, grade F, #967 of 1,115 statewide, top 88%, 538 students, 99% FRL); Ritenour Sr. High (math 9% / reading 36%, grade F, #455 of 521 statewide, top 88%, 1,873 students, 100% FRL) — zoned schools average 100% FRL vs 66% district-wide (34 pts higher); higher-poverty schools than district average — tighter screening recommended.
- Market conditions: Rents rising (+1.6%/yr); 70 active listings in the ZIP; 29 comparable units currently listed for rent nearby; rentals at typical pace (median 24d on market — plan ~3-4 weeks tenant-placement turnaround); 48% of comp listings sitting > 30 days — soft ceiling on asking rent; lower-income renter base — watch delinquency; 920 units permitted in St. Louis County in 2024 (250 in 5+ unit buildings).
- This rent runs 37% of the median local income ($45k/yr) — at the standard rent-burdened threshold; future hikes will face affordability resistance.
Forward outlook
- Local home prices are declining (-3.0%/yr); year-one equity from $794 of loan paydown is wiped out by about $3k of value loss. Plan a longer hold.
Negotiation context
- Only 12 days on market — expect competitive offers; lowballing is unlikely to land.
- 2 sale attempts since 6y ago with the ask held roughly flat each time — persistent listings suggest the price (not the market) is what's stuck; bring a comps-based counter.
- Current owner paid $70k; list at $115k implies a 63% gain — meaningful room to come down on a strong offer.
Questions for the listing agent
- Built in 1960 — when were the roof, HVAC, electrical panel, plumbing, and water heater last replaced?
- Is there a deadline driving the sale (1031 exchange, divorce, estate, relocation)? That informs how much negotiation room exists.
- Schools are F-rated, which usually means shorter tenancies and higher turnover. Who's the typical renter profile here, and what's been the actual vacancy rate?
- Crime grade is F in this area — have there been break-ins, vandalism, or insurance claims at this property in the last 3 years? What carrier currently insures it and at what premium?
- What's the average days-on-market for RENTAL listings here right now (not sales)? A rising rental-DOM trend means longer vacancies and softer asking-rent achievability than the comps imply.
- What's the recent tenant-quality profile in this submarket — average credit score on applications, eviction rate, late-payment / NSF rate, and stable-employment percentage? A property-management company in the area should have these aggregated.
- How much new for-sale + rental construction is in the pipeline within 1–3 miles? Heavy new supply typically softens prices + rents 12–24 months out; constrained supply supports both.
Investment metrics
- 1% rule
- 1.20% ✓
- Cap rate
- 9.71%
- Cash-on-cash
- 12.20%
- DSCR
- 1.54
- GRM
- 6.9
CMA / ARV
- ARV (on-the-fly)
- $146,160
- Comps found
- 12
Show comp detail 12 sales within ~0.75 mi
| Address | Dist | Beds/Ba | Sqft | Sold | Price | $/sf | Match |
|---|---|---|---|---|---|---|---|
| 4426 Treadway Ln | 0.00mi | 3/1.0 | 1,008 (0%) | 1mo | $114,900 | $114 | 99 |
| 4411 Edmundson Rd | 0.24mi | 3/1.0 | 1,104 (+10%) | 1mo | $130,000 | $118 | 72 |
| 9513 Margo Ann Ln | 0.51mi | 3/1.0 | 1,008 (0%) | 7mo | $165,000 | $164 | 71 |
| 9716 Margo Ann Ln | 0.24mi | 3/1.5 | 1,111 (+10%) | 1mo | $135,000 | $122 | 69 |
| 4423 Dabney Dr | 0.15mi | 3/1.0 | 1,152 (+14%) | 4mo | $109,900 | $95 | 66 |
| 9832 Guthrie Ave | 0.40mi | 3/2.0 | 1,050 (+4%) | 7mo | $119,900 | $114 | 64 |
| 4332 Saint Leo Ln | 0.53mi | 3/1.0 | 1,068 (+6%) | 2mo | $170,000 | $159 | 63 |
| 3937 Wright Ave | 0.43mi | 3/1.0 | 1,082 (+7%) | 6mo | $195,000 | $180 | 63 |
| 9406 Bataan Dr | 0.75mi | 3/1.0 | 1,037 (+3%) | 3mo | $175,000 | $169 | 58 |
| 4224 Ashby Rd | 0.68mi | 2/1.5 (-1) | 900 (-11%) | 1mo | $172,500 | $192 | 43 |
| 9448 Harold Dr | 0.72mi | 2/1.0 (-1) | 864 (-14%) | 2mo | $120,000 | $139 | 36 |
| 3585 Westridge Ln | 0.75mi | 3/1.0 | 864 (-14%) | 9mo | $125,000 | $145 | 34 |
Match score weights: distance 35% · size 25% · config 20% · recency 20%. Top-matched comps best support the ARV.
Projected returns pro-forma
-3.0% appreciation · 1.61% rent growth · sell at horizon
- IRR
- 0.3%
- Equity multiple
- 1.01×
- Total profit
- $311
- Equity at exit
- $17,132
- IRR
- 8.5%
- Equity multiple
- 1.61×
- Total profit
- $19,503
- Equity at exit
- $9,934
Cash invested: $32,172 (down + closing). Projections, not guarantees.
Landlord ↔ Tenant lean methodology
- Overall (STATE)
- 81 Strongly Landlord-Friendly
- State Missouri
- 81 Strongly Landlord-Friendly · R+10
- County
- — inherits STATE
- City
- — inherits STATE
ZIP-level market 63134
- Rents YoY
- 1.6%
- Active inventory
- 70
- Price-to-rent
- 6.9×
Monthly cashflow live
- Estimated rent
- $1,381 high interval (Pro) →
- Mortgage (P&I)
- −$603
- Tax from tax record
- −$114 /mo · $1,366/yr
- Insurance
- −$48
- HOA
- −$0
- Vacancy / Maint / Mgmt
- −$290
- Net cashflow
- $327
Break-even live
UW: 25.0% down · 7.5% · 30yr · 1.5% tax · 5.0% vac · 8.0% maint · 8.0% mgmt
Financing live
Cash to close
- Down payment
- $28,725
- Closing costs
- $3,447
- Reserves months
- —
- Total cash needed
- —
Loan-product check · same deal, 3 products live
Conventional
25% down · 7.5% · 30yr
- Down + closing
- —
- Monthly P&I
- —
- Monthly cashflow
- —
- DSCR
- —
- Eligible?
- —
Personal DTI + credit; lowest rate.
DSCR
20% down · 8.5% · 30yr
- Down + closing
- —
- Monthly P&I
- —
- Monthly cashflow
- —
- DSCR
- —
- Eligible?
- —
No personal income docs; deal must DSCR.
Hard money
10% down · 12.0% · 12mo
- Down + closing
- —
- Monthly P&I
- —
- Monthly cashflow
- —
- DSCR
- —
- Eligible?
- —
Short-term bridge; refi at stabilization.
Rent comps 29 comps
| Address | Beds | Baths | Sqft | Rent | $/sqft | DOM | Units | Dist |
|---|---|---|---|---|---|---|---|---|
| 4120 Geraldine Ave St Ann, MO | 2.0 | 1.5 | 922 | $1,200 | $1.30 | 17d | 1 | 0.12mi |
| 3961 Jane Ave Unit 3963 St Ann, MO | 2.0 | 1.0 | 750 | $1,195 | $1.59 | 14d | 1 | 0.31mi |
| 10145 Cabana Club Dr St Ann, MO | 1.0–2.0 | 1.0–2.0 | 776 | $1,060 | $1.37 | 43d | 8 | 0.39mi |
| 9807 Guthrie Ave Saint Louis, MO | 3.0 | 2.0 | 1068 | $1,700 | $1.59 | 23d | 1 | 0.40mi |
| 10069 Livingston Ave St Ann, MO | 2.0 | 1.0 | 875 | $1,100 | $1.26 | 23d | 1 | 0.46mi |
| 4204 Beauty Ln Saint Louis, MO | 4.0 | 1.5 | 1299 | $1,690 | $1.30 | 43d | 1 | 0.47mi |
| 4616 Country Ln St Ann, MO | 2.0 | 1.0–2.0 | 758 | $1,505 | $1.99 | 2d | 9 | 0.48mi |
| 9675 Muriel Ave Unit 9733 Overland, MO | 2.0 | 1.5 | 830 | $1,200 | $1.45 | 2d | 1 | 0.69mi |
| 9675 Muriel Ave Unit 9627 Overland, MO | 2.0 | 1.5 | 830 | $1,200 | $1.45 | 43d | 1 | 0.69mi |
| 9457 Harold Dr Saint Louis, MO | 3.0 | 1.0 | 1472 | $1,530 | $1.04 | 21d | 1 | 0.70mi |
| 9448 Harold Dr Saint Louis, MO | 2.0 | 1.0 | 864 | $1,495 | $1.73 | 43d | 1 | 0.74mi |
| 4400 Gordon Ave Saint Louis, MO | 3.0 | 2.0 | 1500 | $1,800 | $1.20 | 3d | 1 | 0.81mi |
| 10742 Tropic Dr Unit VACANT St Ann, MO | 2.0 | 1.0 | 800 | $1,200 | $1.50 | 43d | 1 | 0.88mi |
| 3648 Edmundson Rd Unit 1 St. Louis, MO | 2.0 | 1.0 | 900 | $995 | $1.11 | 43d | 1 | 0.89mi |
| 3529 Saint Joachim Ln Unit NA St Ann, MO | 2.0 | 1.0 | 900 | $1,450 | $1.61 | 20d | 1 | 0.96mi |
| 3529 Saint Joachim Ln Saint Ann, MO | 2.0 | 1.0 | 900 | $1,450 | $1.61 | 23d | 1 | 0.96mi |
| 11276 Liana Ln Saint Ann, MO | 2.0 | 1.0 | 780 | $1,189 | $1.52 | 4d | 1 | 0.96mi |
| 10788 Tropic Dr Saint Ann, MO | 2.0 | 1.0 | 828 | $1,260 | $1.52 | 43d | 1 | 0.99mi |
| 9969 Sloane Sq Unit 9969C St. Louis, MO | 2.0 | 1.0 | 761 | $895 | $1.18 | 4d | 1 | 1.02mi |
| 3434 Sims Ave Saint Ann, MO | 3.0 | 1.5 | 988 | $1,545 | $1.56 | 43d | 1 | 1.05mi |
| 9183 Harold Dr Saint Louis, MO | 3.0 | 1.0 | 912 | $1,200 | $1.32 | 43d | 1 | 1.06mi |
| 10214 Saint Anthony Ln Saint Ann, MO | 2.0 | 1.0 | 734 | $1,200 | $1.63 | 43d | 1 | 1.15mi |
| 10116 Saint Katherine Ln Saint Ann, MO | 3.0 | 1.0 | 984 | $1,865 | $1.90 | 17d | 1 | 1.16mi |
| 9310 Shirley Gardens Dr Apt C St. Louis, MO | 2.0 | 1.0 | 800 | $1,200 | $1.50 | 43d | 1 | 1.24mi |
| 9310 Shirley Gardens Dr Apt B St. Louis, MO | 2.0 | 1.0 | 800 | $1,100 | $1.38 | 43d | 1 | 1.24mi |
| 3219 Royalton Ave Saint Louis, MO | 2.0 | 1.0 | 792 | $1,095 | $1.38 | 21d | 1 | 1.33mi |
| 3209 Royalton Ave Saint Louis, MO | 2.0 | 1.0 | 805 | $1,150 | $1.43 | 43d | 1 | 1.37mi |
| 3213 Airway Ave Saint Louis, MO | 3.0 | 1.0 | 1215 | $1,550 | $1.28 | 43d | 1 | 1.37mi |
| 3209 Dix Ave Saint Louis, MO | 3.0 | 1.0 | 1122 | $1,550 | $1.38 | 23d | 1 | 1.45mi |
Listing history 10 events
-
2026-04-12status Pending
-
2026-03-31$114,900 Active
-
2020-11-17soldstatus $70,500
-
2020-10-29soldstatus Closed 330-char remark
Show marketing remark (330 chars)
Check out this well maintained 3 bed 1 bath house currently occupied with tenants paying $850 a month! This home has a lot of space both indoor and out. Can be purchased in a package deal with four other rented properties, two of which are on the same street! Package deal MLS #'s 20065878, 20064615, 20065874, 20064599, 20064581.
-
2020-10-23status Pending 330-char remark
Show marketing remark (330 chars)
Check out this well maintained 3 bed 1 bath house currently occupied with tenants paying $850 a month! This home has a lot of space both indoor and out. Can be purchased in a package deal with four other rented properties, two of which are on the same street! Package deal MLS #'s 20065878, 20064615, 20065874, 20064599, 20064581.
-
2020-09-28price $88,500 330-char remark
Show marketing remark (330 chars)
Check out this well maintained 3 bed 1 bath house currently occupied with tenants paying $850 a month! This home has a lot of space both indoor and out. Can be purchased in a package deal with four other rented properties, two of which are on the same street! Package deal MLS #'s 20065878, 20064615, 20065874, 20064599, 20064581.
-
2020-09-09$90,000 Active 330-char remark
Show marketing remark (330 chars)
Check out this well maintained 3 bed 1 bath house currently occupied with tenants paying $850 a month! This home has a lot of space both indoor and out. Can be purchased in a package deal with four other rented properties, two of which are on the same street! Package deal MLS #'s 20065878, 20064615, 20065874, 20064599, 20064581.
-
2011-09-08soldstatus $25,984
-
1993-08-26soldstatus $44,000
-
1965-12-10soldstatus
ⓘ Source: listings_history table (triggers on properties + properties_extension) + one-shot
backfill from property_details.listing_events for pre-trigger history.
Tax reassessment forecast MO · Resets to sale price
- Current annual tax
- $1,366 · $114/mo
- Projected year-2 tax
- $1,366 · $114/mo
- Expected delta
- $0/yr ($0/mo · 0.0%)
ⓘ Screening estimate from a state-policy table — verify with the county assessor before closing.
Climate risk First Street
- Flood 1/10 Low FEMA zone X (unshaded) · 0% chance over 30 yrs
- Wildfire 1/10 Low
- Heat 4/10 Moderate 7 d/yr ≥105°F today · 21 d/yr by 30 yrs out
- Wind 2/10 Low 100% chance of damaging wind over 30 yrs
- Air quality 2/10 Low 1 unhealthy d/yr today · 3 by 30 yrs out
Nearby sold comps map
Loading sold comps map…
Walkable amenities ~0.75 mi
Loading nearby amenities…
Taxation est. · year 1
- Rental income
- $16,578
- − Mortgage interest
- −$6,436
- − Property taxes
- −$1,366
- − Insurance
- −$574
- − Repairs & maintenance
- −$1,326
- − Management
- −$1,326
- − Depreciation
- −$3,343
- Taxable income
- $2,206
- Est. tax owed @ 24.0%
- −$529
- After-tax cash flow
- $3,396/yr
For passive investors: Depreciation is non-cash, so a rental often shows a tax loss while cash-flowing — sheltering income. Rental losses are passive: they offset passive income freely, and up to $25,000/yr can offset ordinary (W-2) income if you actively participate and your MAGI is under $100k (phasing out to $0 by $150k); unused losses carry forward. On sale, claimed depreciation is recaptured at up to 25%, and gains may owe capital-gains tax (a 1031 exchange can defer both). Figures are a year-1 estimate at your 24.0% rate — not tax advice; consult a CPA.
Schools (NCES district)
- District
- Ritenour
- NCES district ID
- 2926640
- Math proficiency
- 13% ▼ -14.00%
- Reading proficiency
- 27% ▼ -7.00%
- Median HH income
- $41,410
- Composite
- 17.04/100
- National rank
- #9125
- State rank
- #304 of 324 in MO
Livability — Edmundson
- Score
- 63/100
- State rank
- #353
- US rank
- #15711
Category grades
Schools grade is shown separately in the Schools card above.
Census & demographics
- Census place
- Edmundson, MO
- County
- Saint Louis County · 888,823 people
- Metro
- St. Louis, MO-IL
- Population (ZIP)
- 13,059
- Household income
- $44,680
- Rent vs Own
- Severe rent burden
- 655.0
Population outlook (St. Louis County) Hauer SSP2
- Today (2025)
- 1,025,227 people
- By 2030
- 1,028,023 · +0.3%
- By 2040
- 1,020,940 · -0.4%
- By 2050
- 1,007,280 · -1.8%
- By 2075
- 987,277 · -3.7%
- By 2100
- 921,984 · -10.1%
Race, ethnicity, and origin ACS 2023
- Neighborhood character
- Predominantly Black (66%)
- Race & ethnicity
- Black 66% White 17% Hispanic / Latino 13% Two or more races 7%
- Hispanic origin (detail)
- Mexican 8%
- Common ancestry
- Lithuanian 1%
- Foreign-born
- 6% · Canada
- Languages at home
- 86% English-only · Spanish 11%
Political lean MEDSL · St. Louis
- 2024 margin
- Strong D (+23.4) · D 60.8% · R 37.4% · Other 1.7%
- 2008→2024 swing
- +3.5pp toward D · 2008: 19.9pp · 2024: 23.4pp
- All cycles
- 2024: D+23.4 2020: D+24.0 2016: D+16.2 2012: D+13.7 2008: D+19.9
Not yet ingested
- Civics
- —
Market trends
- HPI YoY
- ▼ -164.02%
- Current HPI
- 226.9524
- Rent YoY
- ▲ 1.61%
- Metro
- St. Louis, MO-IL
- State GDP YoY
- ▲ 1.84%
- F500 in state
- 20
Industry mix (Fortune 500 HQ in MO)
| Industry | F500 HQs | Revenue |
|---|---|---|
| Healthcare | 1 | $163B |
|
||
| Insurance | 1 | $21B |
|
||
| Industrial Technology | 1 | $17B |
|
||
| Retail | 1 | $16B |
|
||
| Industrial Distribution | 1 | $10B |
|
||
| Utilities | 1 | $9B |
|
||
Price history
+161.1% since first listed10 events — show timeline
- 2026-04-12 Pending — MARIS as Distributed by MLS Grid
- 2026-03-31 Listed $114,900 MARIS as Distributed by MLS Grid
- 2020-11-17 Sold (Public Records) $70,500 Public Records
- 2020-10-29 Sold (MLS) — MARIS as Distributed by MLS Grid
- 2020-10-23 Pending — MARIS as Distributed by MLS Grid
- 2020-09-28 Price Changed $88,500 MARIS as Distributed by MLS Grid
- 2020-09-09 Listed $90,000 MARIS as Distributed by MLS Grid
- 2011-09-08 Sold (Public Records) $25,984 Public Records
- 1993-08-26 Sold (Public Records) $44,000 Public Records
- 1965-12-10 Sold (Public Records) — Public Records
Property tax history
+0.0%/yrLatest (2022): $1,366 · +0.1% YoY. Source: county tax records.
Cash-flow waterfall
monthlySold comps — $/sqft
last 12 mo · ≤1 miLoading sold comps…