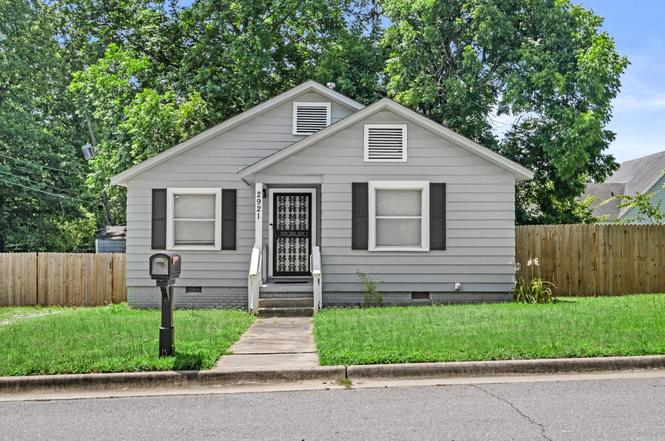
2921 W 17th St · Little Rock, AR
Flood risk 1/10 · Minimal
- FEMA flood zone
- X (unshaded)
- Chance of flooding over 30 yrs
- 0.0%
- Est. flood insurance / yr
- $507 – $1,088
Fire risk 3/10 · Minor
- Est. fire insurance / yr
- $1,499 – $2,785
Heat risk 7/10 · Major
- Hot days now (above 110°F)
- 7 days/yr
- Hot days in 30 yrs
- 19 days/yr
Wind risk 4/10 · Minor
- Chance of severe wind over 30 yrs
- 10.0%
Air-quality risk 2/10 · Minimal
- Unhealthy air days now
- 1 days/yr
- Unhealthy air days in 30 yrs
- 1 days/yr
Risk factors via First Street. Map © Google.
Why this score? — see what drove the D grade
The composite is a weighted blend of 9 inputs, each scored 0–100. Each bar is that input's sub-score; the figure is the points it added to the 100-point composite (weight × sub-score).
- Cash flow +15.4/30.0
- ARV discount +7.5/15.0
- DSCR +4.7/10.0
- Rent growth +3.7/5.0
- Livability +3.7/5.0
- 1% rule +3.3/10.0
- Condition / age +2.5/5.0
- Schools +2.1/10.0
- Appreciation +0.0/10.0
$130,000
🖨 Deal sheet (PDF) 📄 Offer letter ✓ Due diligence
Listing remarks MLS
Adorable totally updated and move in ready with the ultimate comfort. One level 2 bedroom 1 bath home on level lot. Spacious living room with lots of natural light. Formal dining and kitchen has all new stainless steel appliances. Outside storage building. Short distance to Central High School. Roof replaced 2022.
Key facts
- Stainless appliances
- Level lot
- Move in ready
Tags
Property features AI
Exterior
- Parking: Parking pads
- Utilities: Public sewer; Public water; Municipal electric (Entergy); Natural gas; Cable TV available
- Home design: Metal/vinyl siding
- Construction: Composition roof; Crawl space foundation
- Exterior features: Level lot; Paved road access; Approximately 98' x 70' lot (about 0.16 acres); Inside city limits
Interior
- Kitchen: Free-standing stove; Electric range; Microwave; Dishwasher; Garbage disposal
- Flooring: Carpet; Tile; Luxury vinyl
- Bathrooms: 1 full bathroom
- Heating & cooling: Central heating (gas); Central cooling (electric)
- Interior features: Carpet, tile, and luxury vinyl flooring; Great room
Neighborhood map
What this means for you Summary
Snapshot
- This is a 2-bed/1.0-bath single-family listed at $130k.
Deal economics
- At list price, monthly cash flow is $49 ($592/yr) — positive.
- The deal already cash-flows at list — no discount required.
- To meet the 1% rule (rent ≥ 1% of price), the offer needs to be $108k (17.0% below list).
- Recommended offer: $108k (17.0% below list) — sets the bar for 1% rule.
- Cap rate 6.7% vs local median 4.1% in Little Rock — top-decile yield for the area; either an underpriced asset or a hidden risk that comps aren't pricing in. Stress-test before assuming the spread holds.
Location & tenants
- Location reads 73/100 on livability (#22 in AR) — a middle-class / working-renter tenant base. Strengths: commute A+, cost of living A+, housing A+; Watch: crime F.
- Little Rock School District (urban): math 23% / reading 26% proficiency, ranked #183 of 238 in AR (top 77%) — low school quality limits family demand, transient renter base, plan for 1-2y turnover; 69% free/reduced lunch — lower-income household profile, screen leases tightly.
- Zoned schools: Forest Heights Stem Academy (math 45% / reading 57%, grade C-, #88 of 454 statewide, top 19%, 739 students, 50% FRL); Central High School (math 32% / reading 42%, grade F, #64 of 292 statewide, top 26%, 2,338 students, 53% FRL) — zoned schools average 52% FRL vs 69% district-wide (17 pts lower); this property's tenant base skews higher-income than the district average.
- Zoned-school proficiency averages 44% at this address vs 24% district-wide (+20 pts) — the actual schools serving this property are materially stronger than the Little Rock School District average implies; a family-tenant draw the district grade alone would hide.
- Market conditions: Rents rising fast (+4.9%/yr); 187 active listings in the ZIP; 40 comparable units currently listed for rent nearby; rentals lingering (median 46d on market — plan ~5-8 weeks vacancy on turnover, expect pricing pressure); 50% of comp listings sitting > 30 days — soft ceiling on asking rent; lower-income renter base — watch delinquency; 1,006 units permitted in Pulaski County in 2024 (0 in 5+ unit buildings).
- This rent runs 32% of the median local income ($41k/yr) — at the standard rent-burdened threshold; future hikes will face affordability resistance.
Forward outlook
- Local home prices are declining (-3.0%/yr); year-one equity from $899 of loan paydown is wiped out by about $4k of value loss. Plan a longer hold.
- Pulaski County population projected at +6% by 2050 — modest demand growth; plan on rents tracking national, not racing it.
Negotiation context
- Only 7 days on market — expect competitive offers; lowballing is unlikely to land.
- 3 sale attempts since 5y ago with the ask held roughly flat each time — persistent listings suggest the price (not the market) is what's stuck; bring a comps-based counter.
Risks & watch-outs
- Watch-outs: built in 1930 — expect roof / HVAC / electrical / plumbing capex.
- Climate carrying-cost: extreme-heat days projected 7→19/yr by 2055 (HVAC capex compounding) — expect insurance premiums to compound above CPI over the hold.
Questions for the listing agent
- Built in 1930 — when were the roof, HVAC, electrical panel, plumbing, and water heater last replaced?
- Is there a deadline driving the sale (1031 exchange, divorce, estate, relocation)? That informs how much negotiation room exists.
- Crime grade is F in this area — have there been break-ins, vandalism, or insurance claims at this property in the last 3 years? What carrier currently insures it and at what premium?
- The area grade is low — what's the realistic commute time and amenity access for the typical tenant pool here? Any planned neighborhood developments (good or bad) we should know about?
- What's the average days-on-market for RENTAL listings here right now (not sales)? A rising rental-DOM trend means longer vacancies and softer asking-rent achievability than the comps imply.
- What's the recent tenant-quality profile in this submarket — average credit score on applications, eviction rate, late-payment / NSF rate, and stable-employment percentage? A property-management company in the area should have these aggregated.
- How much new for-sale + rental construction is in the pipeline within 1–3 miles? Heavy new supply typically softens prices + rents 12–24 months out; constrained supply supports both.
Investment metrics
- 1% rule
- 0.83% ✗
- Cap rate
- 6.75%
- Cash-on-cash
- 1.63%
- DSCR
- 1.07
- GRM
- 10.0
CMA / ARV
- ARV (on-the-fly)
- $51,744
- Comps found
- 10
Show comp detail 10 sales within ~0.75 mi
| Address | Dist | Beds/Ba | Sqft | Sold | Price | $/sf | Match |
|---|---|---|---|---|---|---|---|
| 3407 W 12 St | 0.45mi | 2/1.0 | 922 (-0%) | 6mo | $30,000 | $33 | 74 |
| 1613 Johnson St | 0.09mi | 3/1.0 (+1) | 902 (-2%) | 19mo | $103,000 | $114 | 71 |
| 2013 S Maple St | 0.50mi | 2/1.0 | 936 (+1%) | 12mo | $8,000 | $9 | 65 |
| 3015 W 24th | 0.42mi | 2/1.0 | 896 (-3%) | 16mo | $50,000 | $56 | 62 |
| 1912 Booker St | 0.14mi | 2/1.0 | 816 (-12%) | 16mo | $111,000 | $136 | 61 |
| 3224 W 13th St | 0.35mi | 2/1.0 | 870 (-6%) | 18mo | $100,000 | $115 | 59 |
| 2401 S Pine St | 0.72mi | 2/1.0 | 896 (-3%) | 4mo | $15,000 | $17 | 58 |
| 2100 Brown St | 0.33mi | 3/1.5 (+1) | 942 (+2%) | 23mo | $70,000 | $74 | 55 |
| 3015 W 15th St | 0.15mi | 3/1.0 (+1) | 1,016 (+10%) | 22mo | $55,000 | $54 | 53 |
| 2101 21st | 0.65mi | 2/1.0 | 967 (+5%) | 21mo | $35,000 | $36 | 44 |
Match score weights: distance 35% · size 25% · config 20% · recency 20%. Top-matched comps best support the ARV.
Projected returns pro-forma
-3.0% appreciation · 4.91% rent growth · sell at horizon
- IRR
- -11.8%
- Equity multiple
- 0.56×
- Total profit
- $-15,853
- Equity at exit
- $19,383
- IRR
- -0.3%
- Equity multiple
- 0.97×
- Total profit
- $-919
- Equity at exit
- $11,240
Cash invested: $36,400 (down + closing). Projections, not guarantees.
Landlord ↔ Tenant lean methodology
- Overall (STATE)
- 92 Strongly Landlord-Friendly
- State Arkansas
- 92 Strongly Landlord-Friendly · R+14
- County
- — inherits STATE
- City
- — inherits STATE
ZIP-level market 72204
- Home prices YoY
- -21.5%
- Rents YoY
- 4.9%
- Active inventory
- 187
- Price-to-rent
- 10.0×
Monthly cashflow live
- Estimated rent
- $1,079 high interval (Pro) →
- Mortgage (P&I)
- −$682
- Tax from tax record
- −$67 /mo · $801/yr
- Insurance
- −$54
- HOA
- −$0
- Vacancy / Maint / Mgmt
- −$226
- Net cashflow
- $49
Break-even live
Sensitivity live
| Price | -10% $123 | -5% $86 | +0% $49 | +5% $13 | +10% $-24 |
|---|---|---|---|---|---|
| Rent | -10% $-36 | -5% $7 | +0% $49 | +5% $92 | +10% $135 |
| Rate | -1.0pp $115 | -0.5pp $82 | base $49 | +0.5pp $16 | +1.0pp $-19 |
UW: 25.0% down · 7.5% · 30yr · 1.5% tax · 5.0% vac · 8.0% maint · 8.0% mgmt
Financing live
Cash to close
- Down payment
- $32,500
- Closing costs
- $3,900
- Reserves months
- —
- Total cash needed
- —
Loan-product check · same deal, 3 products live
Conventional
25% down · 7.5% · 30yr
- Down + closing
- —
- Monthly P&I
- —
- Monthly cashflow
- —
- DSCR
- —
- Eligible?
- —
Personal DTI + credit; lowest rate.
DSCR
20% down · 8.5% · 30yr
- Down + closing
- —
- Monthly P&I
- —
- Monthly cashflow
- —
- DSCR
- —
- Eligible?
- —
No personal income docs; deal must DSCR.
Hard money
10% down · 12.0% · 12mo
- Down + closing
- —
- Monthly P&I
- —
- Monthly cashflow
- —
- DSCR
- —
- Eligible?
- —
Short-term bridge; refi at stabilization.
Rent comps 40 comps
| Address | Beds | Baths | Sqft | Rent | $/sqft | DOM | Units | Dist |
|---|---|---|---|---|---|---|---|---|
| 1822 Booker St Little Rock, AR | 3.0 | 2.0 | 1076 | $1,195 | $1.11 | 25d | 1 | 0.09mi |
| 1918 Allis St Little Rock, AR | 2.0 | 1.0 | 868 | $895 | $1.03 | 16d | 1 | 0.20mi |
| 3109 W 11th St Little Rock, AR | 3.0 | 2.0 | 1055 | $1,295 | $1.23 | 45d | 1 | 0.41mi |
| 2300 S Martin St Little Rock, AR | 2.0 | 1.0 | 840 | $795 | $0.95 | 25d | 1 | 0.44mi |
| 2324 W Daisy L Gatson Bates Dr Unit 1 Little Rock, AR | 2.0 | 1.0 | 881 | $1,095 | $1.24 | 45d | 1 | 0.45mi |
| 2324 W Daisy L Gatson Bates Dr Unit 2 Little Rock, AR | 2.0 | 1.0 | 881 | $1,050 | $1.19 | 25d | 1 | 0.45mi |
| 1205 Valmar St Little Rock, AR | 2.0 | 1.0 | 1100 | $1,199 | $1.09 | 45d | 1 | 0.46mi |
| 901 Johnson St Unit B Little Rock, AR | 1.0 | 1.0 | 800 | $695 | $0.87 | 45d | 1 | 0.52mi |
| 3204 Maryland Ave Little Rock, AR | 3.0 | 1.0 | 921 | $1,095 | $1.19 | 45d | 1 | 0.57mi |
| 3705 W 12th St Unit B Little Rock, AR | 1.0 | 1.0 | 598 | $650 | $1.09 | 45d | 1 | 0.58mi |
| 2200 Dennison St Little Rock, AR | 3.0 | 1.5 | 1080 | $1,000 | $0.93 | 45d | 1 | 0.59mi |
| 2421 S Oak St Little Rock, AR | 3.0 | 1.0 | 1092 | $950 | $0.87 | 23d | 1 | 0.67mi |
| 1318 S Summit St Little Rock, AR | 2.0 | 1.0 | 864 | $1,050 | $1.22 | 23d | 1 | 0.68mi |
| 1320 S Summit St Little Rock, AR | 2.0 | 1.0 | 864 | $1,050 | $1.22 | 23d | 1 | 0.68mi |
| 907 S Park St Little Rock, AR | 2.0 | 2.0 | 950 | $2,100 | $2.21 | 25d | 1 | 0.75mi |
| 1724 W 19th St Unit 2 Little Rock, AR | 2.0 | 1.0 | 843 | $1,150 | $1.36 | 45d | 1 | 0.85mi |
| 1724 W 19th St Apt 3 Little Rock, AR | 1.0 | 1.0 | 828 | $950 | $1.15 | 45d | 1 | 0.85mi |
| 1724 W 19th St Unit 2 Little Rock, AR | 2.0 | 1.0 | 843 | $1,150 | $1.36 | 25d | 1 | 0.85mi |
| 4319 W 17th St Little Rock, AR | 2.0 | 1.0 | 957 | $950 | $0.99 | 45d | 1 | 0.87mi |
| 1921 Wolfe St Unit A Little Rock, AR | 2.0 | 2.0 | 875 | $875 | $1.00 | 25d | 1 | 0.87mi |
| 610 S Maple St Unit A Little Rock, AR | 2.0 | 1.0 | 850 | $825 | $0.97 | 25d | 1 | 0.87mi |
| 408 S Booker St Unit B Little Rock, AR | 1.0 | 1.0 | 675 | $850 | $1.26 | 45d | 1 | 0.88mi |
| 408 Booker St Little Rock, AR | 2.0 | 2.0 | 936 | $1,350 | $1.44 | 45d | 1 | 0.88mi |
| 4304 W 22nd St Little Rock, AR | 2.0 | 1.0 | 896 | $895 | $1.00 | 45d | 1 | 0.88mi |
| 422 S Brown St Little Rock, AR | 1.0 | 1.0 | 550 | $725 | $1.32 | 25d | 1 | 0.89mi |
| 502 Rice St Little Rock, AR | 2.0 | 1.0 | 648 | $925 | $1.43 | 25d | 1 | 0.89mi |
| 128 S Woodrow St Unit N Little Rock, AR | 1.0 | 1.0 | 765 | $895 | $1.17 | 45d | 1 | 1.00mi |
| 2701 Abigail St Little Rock, AR | 3.0 | 1.0 | 1098 | $1,195 | $1.09 | 25d | 1 | 1.01mi |
| 217 Thayer St Apt B Little Rock, AR | 1.0 | 1.0 | 750 | $1,500 | $2.00 | 25d | 1 | 1.02mi |
| 306 S Valentine St Little Rock, AR | 1.0 | 1.0 | 650 | $825 | $1.27 | 45d | 1 | 1.07mi |
| 1320 Adams St Little Rock, AR | 3.0 | 1.0 | 1026 | $1,025 | $1.00 | 45d | 1 | 1.08mi |
| 300 S Valentine St Ste 3 Little Rock, AR | 1.0 | 1.0 | 605 | $1,095 | $1.81 | 45d | 1 | 1.08mi |
| 4613 W 23rd St Unit B Little Rock, AR | 2.0 | 1.0 | 650 | $1,200 | $1.85 | 25d | 1 | 1.10mi |
| 306 S Schiller St Little Rock, AR | 3.0 | 2.0 | 1037 | $1,795 | $1.73 | 45d | 1 | 1.11mi |
| 1008 Kavanaugh Blvd Unit 3 Little Rock, AR | 1.0 | 1.0 | 738 | $795 | $1.08 | 45d | 1 | 1.12mi |
| 1008 Kavanaugh Blvd Little Rock, AR | 1.0 | 1.0 | 738 | $795 | $1.08 | 23d | 1 | 1.12mi |
| 3409 W Markham St Little Rock, AR | 1.0 | 1.0 | 950 | $995 | $1.05 | 25d | 1 | 1.13mi |
| 223 S Park St Apt A Little Rock, AR | 1.0 | 1.0 | 600 | $1,095 | $1.82 | 21d | 1 | 1.13mi |
| 109 Barton St Little Rock, AR | 2.0 | 1.0 | 880 | $750 | $0.85 | 25d | 1 | 1.16mi |
| 3825 W Markham St Little Rock, AR | 2.0 | 1.0 | 950 | $1,095 | $1.15 | 45d | 1 | 1.23mi |
Listing history 6 events
-
2026-06-21statusdays on market $130,000 Active 7 DOM
-
2026-06-18days on market $130,000 New Listing 4 DOM
-
2026-06-17days on market $130,000 New Listing 3 DOM
-
2026-06-16days on market $130,000 New Listing 2 DOM
-
2026-06-15remarks 347-char remark
-
2026-06-15$130,000 New Listing 1 DOM
ⓘ Source: listings_history table (triggers on properties + properties_extension) + one-shot
backfill from property_details.listing_events for pre-trigger history.
Tax reassessment forecast AR · Resets to sale price
- Current annual tax
- $801 · $67/mo
- Projected year-2 tax
- $832 · $69/mo
- Expected delta
- +$31/yr (+$3/mo · 3.8%)
ⓘ Screening estimate from a state-policy table — verify with the county assessor before closing.
Climate risk First Street
- Flood 1/10 Low FEMA zone X (unshaded) · 0% chance over 30 yrs
- Wildfire 3/10 Moderate
- Heat 7/10 Severe 7 d/yr ≥110°F today · 19 d/yr by 30 yrs out
- Wind 4/10 Moderate 10% chance of damaging wind over 30 yrs
- Air quality 2/10 Low 1 unhealthy d/yr today · 1 by 30 yrs out
Nearby sold comps map
Loading sold comps map…
Walkable amenities ~0.75 mi
Loading nearby amenities…
Taxation est. · year 1
- Rental income
- $12,942
- − Mortgage interest
- −$7,282
- − Property taxes
- −$801
- − Insurance
- −$650
- − Repairs & maintenance
- −$1,035
- − Management
- −$1,035
- − Depreciation
- −$3,782
- Taxable loss
- −$1,644
- Est. tax savings @ 24.0%
- +$395
- After-tax cash flow
- $987/yr
For passive investors: Depreciation is non-cash, so a rental often shows a tax loss while cash-flowing — sheltering income. Rental losses are passive: they offset passive income freely, and up to $25,000/yr can offset ordinary (W-2) income if you actively participate and your MAGI is under $100k (phasing out to $0 by $150k); unused losses carry forward. On sale, claimed depreciation is recaptured at up to 25%, and gains may owe capital-gains tax (a 1031 exchange can defer both). Figures are a year-1 estimate at your 24.0% rate — not tax advice; consult a CPA.
Schools (NCES district)
- District
- Little Rock School District
- NCES district ID
- 0509000
- Math proficiency
- 23% ▼ -12.00%
- Reading proficiency
- 26% ▼ -8.00%
- Median HH income
- $43,346
- Composite
- 21.0/100
- National rank
- #8457
- State rank
- #183 of 238 in AR
Livability — Little Rock
- Score
- 73/100
- State rank
- #22
- US rank
- #5295
Category grades
Schools grade is shown separately in the Schools card above.
Census & demographics
- Census place
- Little Rock, AR
- County
- Pulaski County · 372,764 people
- City population
- 218,896
- Metro
- Little Rock-North Little Rock-Conway, AR
- Population (ZIP)
- 30,525
- Household income
- $40,882
- Rent vs Own
- Severe rent burden
- 1553.0
Population outlook (Pulaski County) Hauer SSP2
- Today (2025)
- 415,378 people
- By 2030
- 423,720 · +2.0%
- By 2040
- 435,182 · +4.8%
- By 2050
- 440,904 · +6.1%
- By 2075
- 445,521 · +7.3%
- By 2100
- 419,173 · +0.9%
Race, ethnicity, and origin ACS 2023
- Neighborhood character
- Predominantly Black (66%)
- Race & ethnicity
- Black 66% White 18% Hispanic / Latino 12% Two or more races 6%
- Hispanic origin (detail)
- Mexican 9%
- Common ancestry
- Slovak 1%
- Foreign-born
- 7% · Canada, Vietnam
- Languages at home
- 89% English-only · Spanish 9% Vietnamese 1%
Political lean MEDSL · Pulaski
- 2024 margin
- Strong D (+22.1) · D 59.8% · R 37.7% · Other 2.5%
- 2008→2024 swing
- +10.6pp toward D · 2008: 11.6pp · 2024: 22.1pp
- All cycles
- 2024: D+22.1 2020: D+22.5 2016: D+17.9 2012: D+11.4 2008: D+11.6
Not yet ingested
- Civics
- —
Market trends
- HPI YoY
- ▼ -47.17%
- Current HPI
- 172.3977
- Rent YoY
- ▲ 4.91%
- Metro
- Little Rock-North Little Rock-Conway, AR
- State GDP YoY
- ▲ 3.80%
- F500 in state
- 10
Industry mix (Fortune 500 HQ in AR)
| Industry | F500 HQs | Revenue |
|---|---|---|
| Retail | 1 | $681B |
|
||
| Food / Agriculture | 1 | $53B |
|
||
| Retail / Energy | 1 | $22B |
|
||
| Transportation / Logistics | 1 | $12B |
|
||
| Energy | 1 | $4B |
|
||
Price history
+170.8% since first listed9 events — show timeline
- 2026-06-14 Listed $130,000 CARMLS
- 2022-05-16 Sold (Public Records) $130,000 Public Records
- 2022-05-14 Pending — CARMLS
- 2022-05-13 Sold (MLS) $130,000 CARMLS
- 2022-04-08 Contingent — CARMLS
- 2022-04-05 Listed $114,900 CARMLS
- 2021-12-02 Sold (MLS) $40,000 CARMLS
- 2021-11-20 Contingent — CARMLS
- 2021-11-16 Listed $48,000 CARMLS
Property tax history
+8.7%/yrLatest (2025): $801 · +0.0% YoY. Source: county tax records.
Cash-flow waterfall
monthlySold comps — $/sqft
last 12 mo · ≤1 miLoading sold comps…