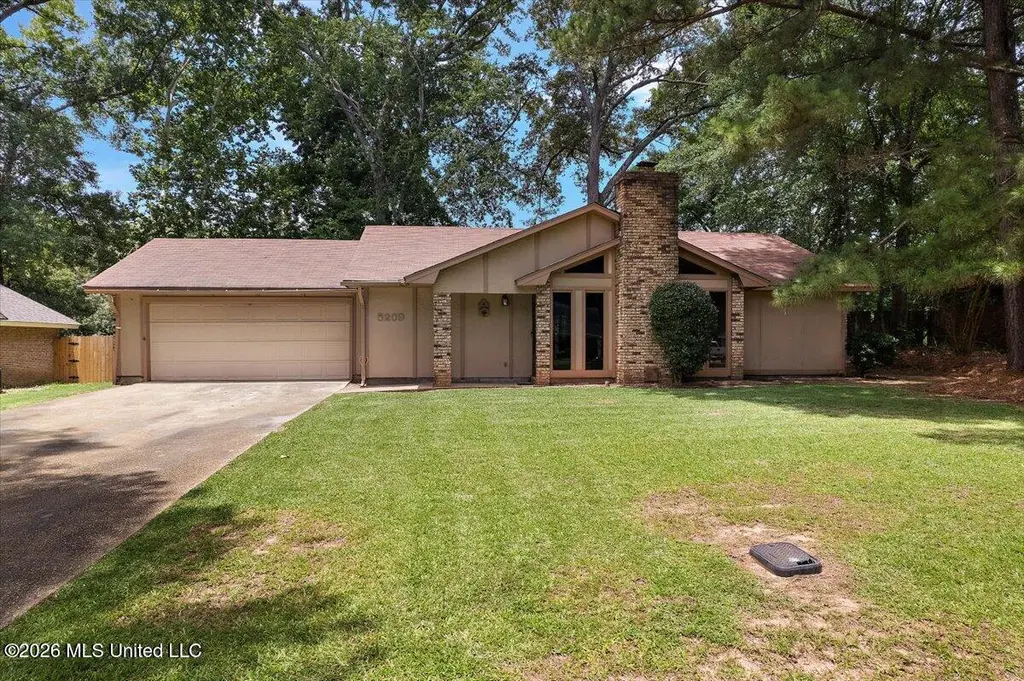
5209 Sycamore Dr · Jackson, MS
Flood risk 1/10 · Minimal
- FEMA flood zone
- X (unshaded)
- Chance of flooding over 30 yrs
- 0.0%
- Est. flood insurance / yr
- $507 – $1,088
Fire risk 3/10 · Minor
- Est. fire insurance / yr
- $1,241 – $2,305
Heat risk 7/10 · Major
- Hot days now (above 108°F)
- 7 days/yr
- Hot days in 30 yrs
- 20 days/yr
Wind risk 8/10 · Major
- Chance of severe wind over 30 yrs
- 80.0%
Air-quality risk 1/10 · Minimal
- Unhealthy air days now
- 0 days/yr
- Unhealthy air days in 30 yrs
- 0 days/yr
Risk factors via First Street. Map © Google.
Why this score? — see what drove the C grade
The composite is a weighted blend of 9 inputs, each scored 0–100. Each bar is that input's sub-score; the figure is the points it added to the 100-point composite (weight × sub-score).
- Cash flow +21.9/30.0
- ARV discount +11.5/15.0
- DSCR +7.0/10.0
- 1% rule +5.2/10.0
- Rent growth +3.6/5.0
- Livability +3.4/5.0
- Condition / age +2.5/5.0
- Schools +1.1/10.0
- Appreciation +0.0/10.0
$155,000
🖨 Deal sheet 📄 Offer letter ✓ Due diligence
Listing remarks
Welcome to this 3-bedroom, 2-bathroom home with a cozy fireplace in the living room and a kitchen with plenty of space for cooking and gathering with family and friends. The backyard offers room to enjoy outdoor activities, family get-togethers, cookouts, or simply relax. A storage shed in the backyard provides additional space for tools, lawn equipment, or extra storage. Whether you're looking for your next home or an investment property, this home has plenty to offer. Don't miss your chance to see it for yourself.
Key facts
- Backyard room
- Kitchen space
- Storage shed
Tags
Property features AI
Exterior
- Parking: Assigned parking; 2 parking spaces (garage)
- Utilities: Public water; Public sewer; Electricity available and connected
- Home design: Single-family house; One level
- Construction: Brick construction; Slab foundation
- Exterior features: Asphalt shingle roof; Lot approximately 0.3 acres
Interior
- Kitchen: Dishwasher; Free-standing electric oven and range; Microwave; Refrigerator
- Bathrooms: 2 full bathrooms
- Heating & cooling: Central heating; Fireplace heating; Central air conditioning; Ceiling fans
- Interior features: Wood-burning fireplace; Dishwasher; Free-standing electric oven and range; Microwave; Refrigerator
Neighborhood map
What this means for you Summary
Snapshot
- This is a 3-bed/2.0-bath single-family listed at $155k.
Deal economics
- At list price, monthly cash flow is $243 ($3k/yr) — positive.
- The deal already cash-flows at list — no discount required.
- Meets the 1% rule at list price ($2k rent vs $155k).
Location & tenants
- Location reads 68/100 on livability (#66 in MS) — a middle-class / working-renter tenant base. Strengths: commute A+, cost of living A+, housing A+; Watch: schools F, amenities F, employment F.
- Jackson Public School District (urban): math 9% / reading 18% proficiency, ranked #112 of 130 in MS (top 86%) — low school quality limits family demand, transient renter base, plan for 1-2y turnover; 88% free/reduced lunch — lower-income household profile, screen leases tightly.
- Market conditions: Rents rising fast (+4.2%/yr); 302 active listings in the ZIP; 4 comparable units currently listed for rent nearby; rentals at typical pace (median 21d on market — plan ~3-4 weeks tenant-placement turnaround); 167 units permitted in Hinds County in 2024 (0 in 5+ unit buildings).
- This rent runs 37% of the median local income ($51k/yr) — at the standard rent-burdened threshold; future hikes will face affordability resistance.
Forward outlook
- Local home prices are declining (-3.0%/yr); year-one equity from $1k of loan paydown is wiped out by about $5k of value loss. Plan a longer hold.
- Hinds County population projected to shrink 6% by 2050 — rents likely to lag national; underwrite the cash flow, not the appreciation.
Negotiation context
- Only 13 days on market — expect competitive offers; lowballing is unlikely to land.
- 7 sale attempts since 24y ago; this cycle's ask has dropped $15k (9%) from the opening price — seller is motivated, your offer sets the floor, not the list.
Risks & watch-outs
- Climate carrying-cost: severe wind risk, 80% chance of damaging wind over 30y; extreme-heat days projected 7→20/yr by 2055 (HVAC capex compounding) — expect insurance premiums to compound above CPI over the hold.
Questions for the listing agent
- Built in 1979 — when were the roof, HVAC, electrical panel, plumbing, and water heater last replaced?
- Is there a deadline driving the sale (1031 exchange, divorce, estate, relocation)? That informs how much negotiation room exists.
- Schools are F-rated, which usually means shorter tenancies and higher turnover. Who's the typical renter profile here, and what's been the actual vacancy rate?
- What's the average days-on-market for RENTAL listings here right now (not sales)? A rising rental-DOM trend means longer vacancies and softer asking-rent achievability than the comps imply.
- What's the recent tenant-quality profile in this submarket — average credit score on applications, eviction rate, late-payment / NSF rate, and stable-employment percentage? A property-management company in the area should have these aggregated.
- How much new for-sale + rental construction is in the pipeline within 1–3 miles? Heavy new supply typically softens prices + rents 12–24 months out; constrained supply supports both.
Investment metrics
- 1% rule
- 1.02% ✓
- Cap rate
- 8.18%
- Cash-on-cash
- 6.73%
- DSCR
- 1.30
- GRM
- 8.2
CMA / ARV
- ARV (on-the-fly)
- $170,200
- Comps found
- 12
Show comp detail 12 sales within ~0.75 mi
| Address | Dist | Beds/Ba | Sqft | Sold | Price | $/sf | Match |
|---|---|---|---|---|---|---|---|
| 548 Vineland Dr | 0.19mi | 3/2.0 | 1,444 (-2%) | 0mo | $179,900 | $125 | 87 |
| 344 Red Oak Dr | 0.18mi | 3/2.0 | 1,429 (-3%) | 2mo | $189,000 | $132 | 84 |
| 624 Cedar Springs Dr | 0.06mi | 3/2.0 | 1,324 (-10%) | 3mo | $148,900 | $112 | 77 |
| 209 Holly Hill Dr | 0.39mi | 3/2.0 | 1,483 (+0%) | 8mo | $130,000 | $88 | 75 |
| 5083 Terry Rd | 0.28mi | 4/3.0 (+1) | 1,467 (-1%) | 2mo | $189,900 | $129 | 74 |
| 430 Trent Dr | 0.35mi | 3/2.0 | 1,440 (-3%) | 9mo | $140,000 | $97 | 72 |
| 455 Eagle Ct | 0.44mi | 3/2.0 | 1,547 (+4%) | 9mo | $178,500 | $115 | 64 |
| 4790 Old Poplar Rd | 0.44mi | 3/2.0 | 1,600 (+8%) | 4mo | $160,000 | $100 | 63 |
| 4775 Old Lake Rd | 0.49mi | 3/2.0 | 1,373 (-7%) | 7mo | $95,000 | $69 | 60 |
| 169 Fox Meadows Rd | 0.69mi | 3/2.0 | 1,474 (-0%) | 11mo | $145,000 | $98 | 58 |
| 458 Lee St | 0.74mi | 3/2.0 | 1,539 (+4%) | 2mo | $199,000 | $129 | 57 |
| 466 Lee St | 0.75mi | 3/2.0 | 1,562 (+6%) | 0mo | $213,900 | $137 | 56 |
Match score weights: distance 35% · size 25% · config 20% · recency 20%. Top-matched comps best support the ARV.
Projected returns pro-forma
-3.0% appreciation · 4.23% rent growth · sell at horizon
- IRR
- -4.7%
- Equity multiple
- 0.82×
- Total profit
- $-7,645
- Equity at exit
- $23,111
- IRR
- 6.3%
- Equity multiple
- 1.50×
- Total profit
- $21,598
- Equity at exit
- $13,402
Cash invested: $43,400 (down + closing). Projections, not guarantees.
Landlord ↔ Tenant lean methodology
- Overall (STATE)
- 90 Strongly Landlord-Friendly
- State Mississippi
- 90 Strongly Landlord-Friendly · R+11
- County
- — inherits STATE
- City
- — inherits STATE
ZIP-level market 39212
- Home prices YoY
- -11.7%
- Rents YoY
- 4.2%
- Active inventory
- 302
- Price-to-rent
- 8.2×
Monthly cashflow live
- Estimated rent
- $1,585 medium interval (Pro) →
- Mortgage (P&I)
- −$813
- Tax from tax record
- −$131 /mo · $1,574/yr
- Insurance
- −$65
- HOA
- −$0
- Vacancy / Maint / Mgmt
- −$333
- Net cashflow
- $243
Break-even live
UW: 25.0% down · 7.5% · 30yr · 1.5% tax · 5.0% vac · 8.0% maint · 8.0% mgmt
Financing live
Cash to close
- Down payment
- $38,750
- Closing costs
- $4,650
- Reserves months
- —
- Total cash needed
- —
Loan-product check · same deal, 3 products live
Conventional
25% down · 7.5% · 30yr
- Down + closing
- —
- Monthly P&I
- —
- Monthly cashflow
- —
- DSCR
- —
- Eligible?
- —
Personal DTI + credit; lowest rate.
DSCR
20% down · 8.5% · 30yr
- Down + closing
- —
- Monthly P&I
- —
- Monthly cashflow
- —
- DSCR
- —
- Eligible?
- —
No personal income docs; deal must DSCR.
Hard money
10% down · 12.0% · 12mo
- Down + closing
- —
- Monthly P&I
- —
- Monthly cashflow
- —
- DSCR
- —
- Eligible?
- —
Short-term bridge; refi at stabilization.
Rent comps 4 comps
| Address | Beds | Baths | Sqft | Rent | $/sqft | DOM | Units | Dist |
|---|---|---|---|---|---|---|---|---|
| 306 Gary Daniels Dr Byram, MS | 3.0 | 2.0 | 1517 | $1,595 | $1.05 | 43d | 1 | 0.49mi |
| 257 Gaddy Dr Byram, MS | 3.0 | 2.0 | 1400 | $1,900 | $1.36 | 13d | 1 | 0.93mi |
| 301 Elton Park Dr Jackson, MS | 1.0–3.0 | 1.0–2.0 | 1085 | $1,399 | $1.29 | 13d | 9 | 1.24mi |
| 350 Byram Dr Byram, MS | 2.0 | 2.0 | 987 | $1,215 | $1.23 | 21d | 1 | 1.34mi |
Listing history 12 events
-
2026-06-18price $155,000 Active 13 DOM
-
2026-06-18days on market $170,000 Active 13 DOM
-
2026-06-17days on market $170,000 Active 12 DOM
-
2026-06-16days on market $170,000 Active 11 DOM
-
2026-06-15days on market $170,000 Active 10 DOM
-
2026-06-14days on market $170,000 Active 8 DOM
-
2026-06-13days on market $170,000 Active 7 DOM
-
2026-06-10days on market $170,000 Active 5 DOM
-
2026-06-09days on market $170,000 Active 4 DOM
-
2026-06-08days on market $170,000 Active 3 DOM
-
2026-06-07remarks 521-char remark
-
2026-06-07$170,000 Active 2 DOM
ⓘ Source: listings_history table (triggers on properties + properties_extension) + one-shot
backfill from property_details.listing_events for pre-trigger history.
Tax reassessment forecast MS · Resets to sale price
- Current annual tax
- $1,574 · $131/mo
- Projected year-2 tax
- $1,574 · $131/mo
- Expected delta
- $0/yr ($0/mo · 0.0%)
ⓘ Screening estimate from a state-policy table — verify with the county assessor before closing.
Climate risk First Street
- Flood 1/10 Low FEMA zone X (unshaded) · 0% chance over 30 yrs
- Wildfire 3/10 Moderate
- Heat 7/10 Severe 7 d/yr ≥108°F today · 20 d/yr by 30 yrs out
- Wind 8/10 Severe 80% chance of damaging wind over 30 yrs
- Air quality 1/10 Low 0 unhealthy d/yr today · 0 by 30 yrs out
Nearby sold comps map
Loading sold comps map…
Walkable amenities ~0.75 mi
Loading nearby amenities…
Taxation est. · year 1
- Rental income
- $19,018
- − Mortgage interest
- −$8,682
- − Property taxes
- −$1,574
- − Insurance
- −$775
- − Repairs & maintenance
- −$1,521
- − Management
- −$1,521
- − Depreciation
- −$4,509
- Taxable income
- $434
- Est. tax owed @ 24.0%
- −$104
- After-tax cash flow
- $2,816/yr
For passive investors: Depreciation is non-cash, so a rental often shows a tax loss while cash-flowing — sheltering income. Rental losses are passive: they offset passive income freely, and up to $25,000/yr can offset ordinary (W-2) income if you actively participate and your MAGI is under $100k (phasing out to $0 by $150k); unused losses carry forward. On sale, claimed depreciation is recaptured at up to 25%, and gains may owe capital-gains tax (a 1031 exchange can defer both). Figures are a year-1 estimate at your 24.0% rate — not tax advice; consult a CPA.
Schools (NCES district)
- District
- Jackson Public School District
- NCES district ID
- 2802190
- Math proficiency
- 9% ▼ -14.00%
- Reading proficiency
- 18% ▼ -7.00%
- Median HH income
- $33,234
- Composite
- 10.89/100
- National rank
- #9755
- State rank
- #112 of 130 in MS
Livability — Jackson
- Score
- 68/100
- State rank
- #66
- US rank
- #9695
Category grades
Schools grade is shown separately in the Schools card above.
Census & demographics
- Census place
- Jackson, MS
- County
- Hinds County · 167,040 people
- City population
- 140,204
- Metro
- Jackson, MS
- Population (ZIP)
- 25,659
- Household income
- $50,722
- Rent vs Own
- Severe rent burden
- 1314.0
Population outlook (Hinds County) Hauer SSP2
- Today (2025)
- 242,528 people
- By 2030
- 241,113 · -0.6%
- By 2040
- 235,557 · -2.9%
- By 2050
- 226,946 · -6.4%
- By 2075
- 199,995 · -17.5%
- By 2100
- 164,165 · -32.3%
Race, ethnicity, and origin ACS 2023
- Neighborhood character
- Predominantly Black (86%)
- Race & ethnicity
- Black 86% White 9% Hispanic / Latino 3% Two or more races 3%
- Common ancestry
- Serbian 1% Lithuanian 1%
- Foreign-born
- 1% · Canada
- Languages at home
- 97% English-only · Spanish 2%
Political lean MEDSL · Hinds
- 2024 margin
- Solid D (+46.1) · D 72.4% · R 26.3% · Other 1.4%
- 2008→2024 swing
- +7.1pp toward D · 2008: 39.0pp · 2024: 46.1pp
- All cycles
- 2024: D+46.1 2020: D+48.3 2016: D+43.7 2012: D+45.1 2008: D+39.0
Not yet ingested
- Civics
- —
Market trends
- HPI YoY
- ▼ -23.01%
- Current HPI
- 174.4025
- Rent YoY
- ▲ 4.23%
- Metro
- Jackson, MS
- State GDP YoY
- —
- F500 in state
- 0
Price history
+94.3% since first listed16 events — show timeline
- 2026-06-05 Listed $170,000 MLSU
- 2026-03-09 Listing Removed — MLSU
- 2025-11-08 Relisted — MLSU
- 2025-10-30 Listing Removed — MLSU
- 2025-07-30 Listed $179,900 MLSU
- 2025-06-08 Rental Removed $1,600 Avail
- 2025-05-08 Listed for Rent $1,600 Avail
- 2024-06-29 Rental Removed $1,500 TURBOTENANT
- 2024-06-26 Listed for Rent $1,500 TURBOTENANT
- 2020-10-13 Listing Removed — MLSU
- 2020-07-16 Listed $135,000 MLSU
- 2002-12-03 Sold (Public Records) — Public Records
- 2002-12-03 Sold (MLS) — MLSU
- 2002-10-03 Listed $87,500 MLSU
- 1997-01-30 Sold (Public Records) — Public Records
- 1986-11-26 Sold (Public Records) — Public Records
Property tax history
+1.5%/yrLatest (2025): $1,574 · +3.6% YoY. Source: county tax records.
Cash-flow waterfall
monthlySold comps — $/sqft
last 12 mo · ≤1 miLoading sold comps…