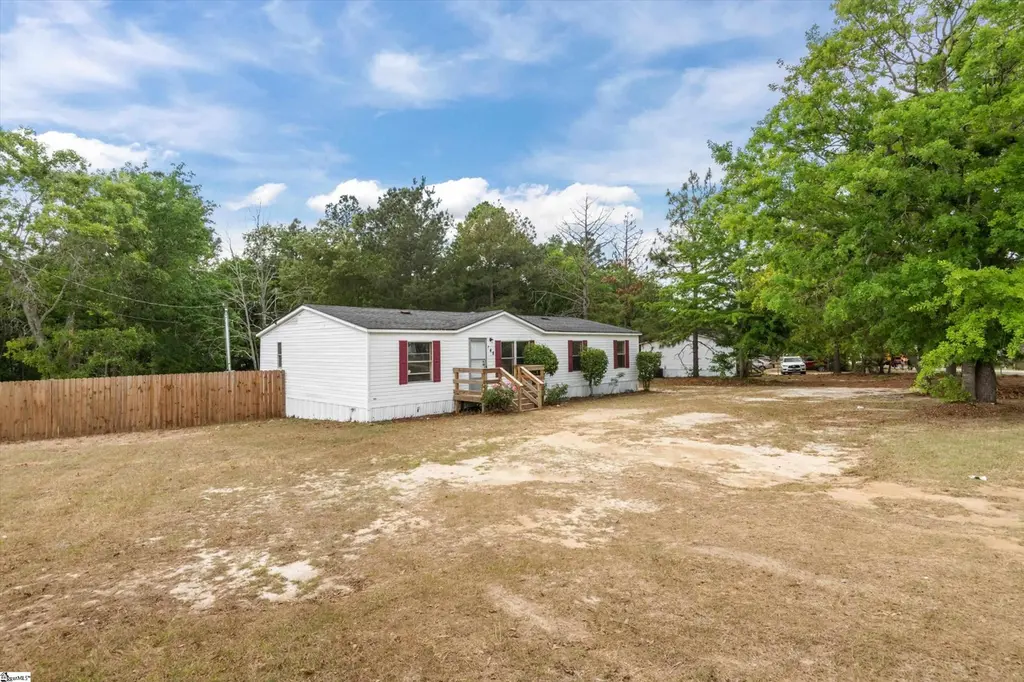
148 Glencrest Dr · Gaston, SC
Flood risk 1/10 · Minimal
- FEMA flood zone
- X (unshaded)
- Chance of flooding over 30 yrs
- 0.0%
- Est. flood insurance / yr
- $507 – $1,088
Fire risk 6/10 · Moderate
- Est. fire insurance / yr
- $783 – $1,453
Heat risk 6/10 · Moderate
- Hot days now (above 107°F)
- 7 days/yr
- Hot days in 30 yrs
- 16 days/yr
Wind risk 6/10 · Moderate
- Chance of severe wind over 30 yrs
- 73.0%
Air-quality risk 3/10 · Minor
- Unhealthy air days now
- 2 days/yr
- Unhealthy air days in 30 yrs
- 2 days/yr
Risk factors via First Street. Map © Google.
Why this score? — see what drove the C- grade
The composite is a weighted blend of 9 inputs, each scored 0–100. Each bar is that input's sub-score; the figure is the points it added to the 100-point composite (weight × sub-score).
- Cash flow +20.2/30.0
- ARV discount +7.5/15.0
- DSCR +6.4/10.0
- 1% rule +5.3/10.0
- Livability +3.2/5.0
- Rent growth +2.5/5.0
- Condition / age +2.5/5.0
- Schools +1.6/10.0
- Appreciation +0.9/10.0
$139,000
🖨 Deal sheet 📄 Offer letter ✓ Due diligence
Listing remarks
This is a well-maintained and refreshed 3-bedroom home offering excellent value. Recent updates include new flooring, fresh paint, and updated fixtures, creating a clean and modern feel throughout. The home features a functional layout with comfortable living spaces, making it a great fit for both owner-occupants and investors. At this price point, opportunities like this are hard to find. FHA financing welcome. Conveniently located with easy access to nearby amenities, this property is ready for its next owner.
Key facts
- Fresh paint
- New flooring
- Functional layout
Tags
Property features AI
Finance
- Other: Residential property — discovery required
- HOA & community: No HOA fees
Exterior
- Parking: No garage
- Utilities: Public water; Electric water heater; Public sewer; Public garbage pickup
- Home design: Single-story residence; Vinyl siding exterior; Property age approximately 21–30 years; Crawl space foundation
- Construction: Composition shingle roof
- Exterior features: Front porch; Fenced yard; Level lot
Interior
- Kitchen: Kitchen approximately 12 x 17; Dishwasher; Refrigerator; Electric range (stand-alone)
- Bedrooms: 3 bedrooms on the main level; Primary bedroom with full bath and tub/shower (13 x 15); Second bedroom 11 x 11; Third bedroom 10 x 11
- Flooring: Laminate flooring
- Bathrooms: 2 full bathrooms (both on the main level)
- Heating & cooling: Electric heating; Electric cooling (plus other/see remarks)
- Interior features: Ceiling fan; Open floor plan; Laminate countertops
- Laundry & utility: Laundry on first floor; Washer connection; Electric dryer hookup
Neighborhood map
What this means for you Summary
Snapshot
- This is a 3-bed/2.0-bath manufactured listed at $139k.
Deal economics
- At list price, monthly cash flow is $176 ($2k/yr) — positive.
- The deal already cash-flows at list — no discount required.
- Meets the 1% rule at list price ($1k rent vs $139k).
- Recommended offer: $135k (3.0% below list) — sets the bar for market timing.
Location & tenants
- Location reads 65/100 on livability (#142 in SC) — a middle-class / working-renter tenant base. Strengths: cost of living A+, housing A+, health & safety B; Watch: schools F, crime F, amenities F.
- Lexington 04 (rural): math 14% / reading 25% proficiency, ranked #70 of 80 in SC (top 88%) — low school quality limits family demand, transient renter base, plan for 1-2y turnover; 69% free/reduced lunch — lower-income household profile, screen leases tightly.
- Market conditions: 137 active listings in the ZIP; 1,712 units permitted in Lexington County in 2024 (0 in 5+ unit buildings).
Forward outlook
- Local home prices are declining (-3.0%/yr); year-one equity from $961 of loan paydown is wiped out by about $4k of value loss. Plan a longer hold.
- Lexington County population projected at +26% by 2050 — long-run rental-demand tailwind backs the buy-and-hold thesis.
Negotiation context
- It's been on market 55 days — a 3% lower offer ($135k) is reasonable based on typical stale-listing flexibility.
- 4 sale attempts with the ask held roughly flat each time — persistent listings suggest the price (not the market) is what's stuck; bring a comps-based counter.
- Current owner paid $65k; list at $139k implies a 114% gain — meaningful room to come down on a strong offer.
Risks & watch-outs
- Climate carrying-cost: major wind risk, 73% chance of damaging wind over 30y; major wildfire risk; extreme-heat days projected 7→16/yr by 2055 (HVAC capex compounding) — expect insurance premiums to compound above CPI over the hold.
Questions for the listing agent
- It's been on market 55 days. Have you received any prior offers? Is the seller open to a 3% concession, seller financing, or rate buy-down credit?
- Is there a deadline driving the sale (1031 exchange, divorce, estate, relocation)? That informs how much negotiation room exists.
- Schools are F-rated, which usually means shorter tenancies and higher turnover. Who's the typical renter profile here, and what's been the actual vacancy rate?
- Crime grade is F in this area — have there been break-ins, vandalism, or insurance claims at this property in the last 3 years? What carrier currently insures it and at what premium?
- What's the average days-on-market for RENTAL listings here right now (not sales)? A rising rental-DOM trend means longer vacancies and softer asking-rent achievability than the comps imply.
- What's the recent tenant-quality profile in this submarket — average credit score on applications, eviction rate, late-payment / NSF rate, and stable-employment percentage? A property-management company in the area should have these aggregated.
- How much new for-sale + rental construction is in the pipeline within 1–3 miles? Heavy new supply typically softens prices + rents 12–24 months out; constrained supply supports both.
Investment metrics
- 1% rule
- 1.03% ✓
- Cap rate
- 7.81%
- Cash-on-cash
- 5.41%
- DSCR
- 1.24
- GRM
- 8.1
CMA / ARV
No comps found within radius.
Projected returns pro-forma
-3.0% appreciation · 3.0% rent growth · sell at horizon
- IRR
- -7.9%
- Equity multiple
- 0.71×
- Total profit
- $-11,324
- Equity at exit
- $20,725
- IRR
- 1.7%
- Equity multiple
- 1.12×
- Total profit
- $4,621
- Equity at exit
- $12,018
Cash invested: $38,920 (down + closing). Projections, not guarantees.
Landlord ↔ Tenant lean methodology
- Overall (STATE)
- 90 Strongly Landlord-Friendly
- State South Carolina
- 90 Strongly Landlord-Friendly · R+6
- County
- — inherits STATE
- City
- — inherits STATE
ZIP-level market 29053
- Home prices YoY
- -2.9%
- Active inventory
- 137
- Price-to-rent
- 8.1×
Monthly cashflow live
- Estimated rent
- $1,438 medium interval (Pro) →
- Mortgage (P&I)
- −$729
- Tax est. 1.5%
- −$174 /mo · $2,085/yr
- Insurance
- −$58
- HOA
- −$0
- Vacancy / Maint / Mgmt
- −$302
- Net cashflow
- $176
Break-even live
UW: 25.0% down · 7.5% · 30yr · 1.5% tax · 5.0% vac · 8.0% maint · 8.0% mgmt
Financing live
Cash to close
- Down payment
- $34,750
- Closing costs
- $4,170
- Reserves months
- —
- Total cash needed
- —
Loan-product check · same deal, 3 products live
Conventional
25% down · 7.5% · 30yr
- Down + closing
- —
- Monthly P&I
- —
- Monthly cashflow
- —
- DSCR
- —
- Eligible?
- —
Personal DTI + credit; lowest rate.
DSCR
20% down · 8.5% · 30yr
- Down + closing
- —
- Monthly P&I
- —
- Monthly cashflow
- —
- DSCR
- —
- Eligible?
- —
No personal income docs; deal must DSCR.
Hard money
10% down · 12.0% · 12mo
- Down + closing
- —
- Monthly P&I
- —
- Monthly cashflow
- —
- DSCR
- —
- Eligible?
- —
Short-term bridge; refi at stabilization.
Listing history 28 events
-
2026-06-18days on market $139,000 Active 55 DOM
-
2026-06-17days on market $139,000 Active 54 DOM
-
2026-06-16days on market $139,000 Active 53 DOM
-
2026-06-15days on market $139,000 Active 52 DOM
-
2026-06-14days on market $139,000 Active 50 DOM
-
2026-06-13days on market $139,000 Active 49 DOM
-
2026-06-10days on market $139,000 Active 47 DOM
-
2026-06-09days on market $139,000 Active 46 DOM
-
2026-06-08days on market $139,000 Active 45 DOM
-
2026-06-07days on market $139,000 Active 44 DOM
-
2026-06-05days on market $139,000 Active 41 DOM
-
2026-06-03days on market $139,000 Active 40 DOM
-
2026-06-03days on market $139,000 Active 39 DOM
-
2026-06-01days on market $139,000 Active 38 DOM
-
2026-05-31days on market $139,000 Active 37 DOM
-
2026-05-10status Active
-
2026-04-28historical Contingency Contract
-
2026-04-24$139,000 Active
-
2026-01-13price $99,500
-
2025-12-20price $104,900
-
2025-12-04price $114,900
-
2025-11-14$124,900 Active
-
2025-11-04soldstatus $65,000
-
2025-07-01$129,900 Active
-
2020-04-01soldstatus $62,000
-
2016-02-02soldstatus $529,715
-
2001-03-21soldstatus $75,000
-
1997-12-17soldstatus $500,000
ⓘ Source: listings_history table (triggers on properties + properties_extension) + one-shot
backfill from property_details.listing_events for pre-trigger history.
Climate risk First Street
- Flood 1/10 Low FEMA zone X (unshaded) · 0% chance over 30 yrs
- Wildfire 6/10 Major
- Heat 6/10 Major 7 d/yr ≥107°F today · 16 d/yr by 30 yrs out
- Wind 6/10 Major 73% chance of damaging wind over 30 yrs
- Air quality 3/10 Moderate 2 unhealthy d/yr today · 2 by 30 yrs out
Nearby sold comps map
Loading sold comps map…
Walkable amenities ~0.75 mi
Loading nearby amenities…
Taxation est. · year 1
- Rental income
- $17,257
- − Mortgage interest
- −$7,786
- − Property taxes
- −$2,085
- − Insurance
- −$695
- − Repairs & maintenance
- −$1,381
- − Management
- −$1,381
- − Depreciation
- −$4,044
- Taxable loss
- −$114
- Est. tax savings @ 24.0%
- +$27
- After-tax cash flow
- $2,133/yr
For passive investors: Depreciation is non-cash, so a rental often shows a tax loss while cash-flowing — sheltering income. Rental losses are passive: they offset passive income freely, and up to $25,000/yr can offset ordinary (W-2) income if you actively participate and your MAGI is under $100k (phasing out to $0 by $150k); unused losses carry forward. On sale, claimed depreciation is recaptured at up to 25%, and gains may owe capital-gains tax (a 1031 exchange can defer both). Figures are a year-1 estimate at your 24.0% rate — not tax advice; consult a CPA.
Schools (NCES district)
- District
- Lexington 04
- NCES district ID
- 4502790
- Math proficiency
- 14% ▼ -2.00%
- Reading proficiency
- 25% ▼ -1.00%
- Median HH income
- $38,722
- Composite
- 16.38/100
- National rank
- #9198
- State rank
- #70 of 80 in SC
Livability — Gaston
- Score
- 65/100
- State rank
- #142
- US rank
- #13451
Category grades
Schools grade is shown separately in the Schools card above.
Census & demographics
- City population
- 20,818
- Population (ZIP)
- 20,818
Population outlook (Lexington County) Hauer SSP2
- Today (2025)
- 322,999 people
- By 2030
- 342,356 · +6.0%
- By 2040
- 377,715 · +16.9%
- By 2050
- 406,984 · +26.0%
- By 2075
- 465,447 · +44.1%
- By 2100
- 485,674 · +50.4%
Race, ethnicity, and origin ACS 2023
- Neighborhood character
- Diverse neighborhood (Simpson 0.63)
- Race & ethnicity
- White 53% Black 21% Hispanic / Latino 21% Two or more races 11%
- Hispanic origin (detail)
- Mexican 14% Puerto Rican 3%
- Common ancestry
- Slovak 2% Serbian 2% Lithuanian 1%
- Foreign-born
- 9% · Canada, Dominican Republic
- Languages at home
- 81% English-only · Spanish 18%
Political lean MEDSL · Lexington
- 2024 margin
- Solid R (+33.5) · D 32.5% · R 66.0% · Other 1.4%
- 2008→2024 swing
- +4.6pp toward D · 2008: -38.0pp · 2024: -33.5pp
- All cycles
- 2024: R+33.5 2020: R+30.1 2016: R+36.7 2012: R+37.8 2008: R+38.0
Not yet ingested
- Civics
- —
Market trends
- HPI YoY
- ▼ -8.19%
- Current HPI
- 272.1711
- Rent YoY
- —
- Metro
- —
- State GDP YoY
- ▲ 4.51%
- F500 in state
- 2
Industry mix (Fortune 500 HQ in SC)
| Industry | F500 HQs | Revenue |
|---|---|---|
| Packaging | 1 | $7B |
|
||
Price history
-72.2% since first listed13 events — show timeline
- 2026-05-10 Relisted — Greater Greenville MLS
- 2026-04-28 Contingent — Greater Greenville MLS
- 2026-04-24 Listed $139,000 Greater Greenville MLS
- 2026-01-13 Price Changed $99,500 Consolidated MLS
- 2025-12-20 Price Changed $104,900 Consolidated MLS
- 2025-12-04 Price Changed $114,900 Consolidated MLS
- 2025-11-14 Listed $124,900 Consolidated MLS
- 2025-11-04 Sold (Public Records) $65,000 Public Records
- 2025-07-01 Listed $129,900 Consolidated MLS
- 2020-04-01 Sold (Public Records) $62,000 Public Records
- 2016-02-02 Sold (Public Records) $529,715 Public Records
- 2001-03-21 Sold (Public Records) $75,000 Public Records
- 1997-12-17 Sold (Public Records) $500,000 Public Records
Property tax history
-3.0%/yrLatest (2024): $226 · -86.5% YoY. Source: county tax records.
Cash-flow waterfall
monthlySold comps — $/sqft
last 12 mo · ≤1 miLoading sold comps…