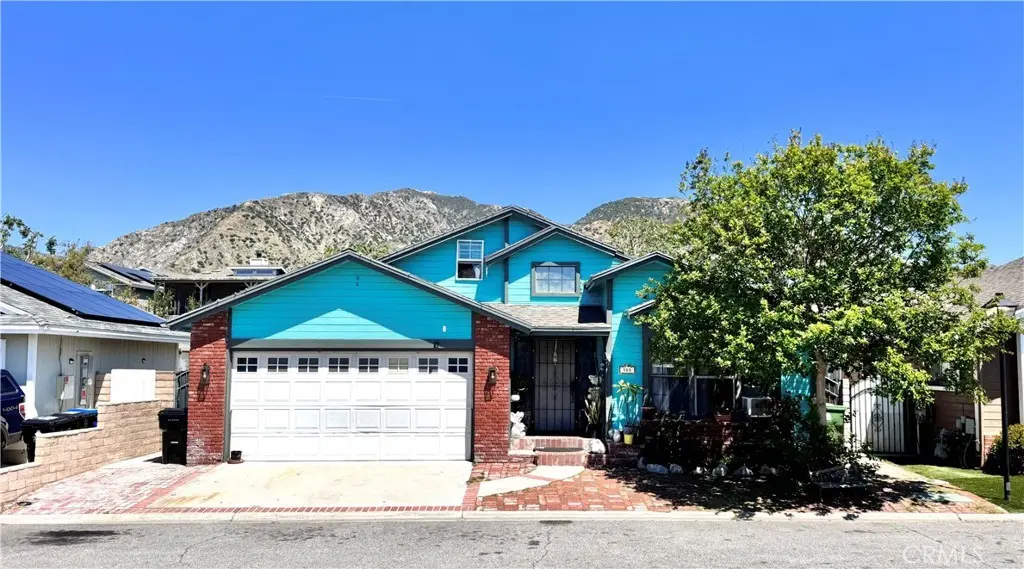
13691 Gavina Ave #355 · Los Angeles, CA
Flood risk 1/10 · Minimal
- FEMA flood zone
- X (unshaded)
- Chance of flooding over 30 yrs
- 0.0%
- Est. flood insurance / yr
- $507 – $1,088
Fire risk 8/10 · Major
- Est. fire insurance / yr
- $659 – $1,223
Heat risk 6/10 · Moderate
- Hot days now (above 97°F)
- 9 days/yr
- Hot days in 30 yrs
- 25 days/yr
Wind risk 1/10 · Minimal
- Chance of severe wind over 30 yrs
- —
Air-quality risk 7/10 · Major
- Unhealthy air days now
- 13 days/yr
- Unhealthy air days in 30 yrs
- 16 days/yr
Risk factors via First Street. Map © Google.
Why this score? — see what drove the C grade
The composite is a weighted blend of 9 inputs, each scored 0–100. Each bar is that input's sub-score; the figure is the points it added to the 100-point composite (weight × sub-score).
- Cash flow +26.9/30.0
- DSCR +9.3/10.0
- 1% rule +7.3/10.0
- Schools +3.6/10.0
- Livability +3.4/5.0
- Rent growth +2.5/5.0
- Condition / age +2.5/5.0
- ARV discount +0.0/15.0
- Appreciation +0.0/10.0
$315,000
🖨 Deal sheet (PDF) 📄 Offer letter ✓ Due diligence
Listing remarks MLS
Welcome to Santiago Estates, one of Sylmar’s most desirable all-age manufactured home communities, nestled near the foothills with a peaceful, more private setting away from heavy through traffic. This 3-bedroom, 2-bath home offers a comfortable and functional layout, along with additional flexible living space that can be adapted to fit a variety of needs—perfect for today’s lifestyle. Step outside and enjoy your own side/backyard area, providing a rare opportunity for outdoor space—ideal for relaxing, entertaining, or creating your own private retreat. The community itself is known for its quiet atmosphere while still being conveniently located near shopping, dining, and everyday essentials. Residents of Santiago Estates enjoy a well-maintained neighborhood with amenities such as a pool, clubhouse, and recreational areas, all contributing to a welcoming, community-oriented environment.
Key facts
- Clubhouse
- Pool
- Recreational areas
Tags
Neighborhood map
What this means for you Summary
Snapshot
- This is a 3-bed/2.0-bath manufactured listed at $315k.
Deal economics
- At list price, monthly cash flow is $876 ($11k/yr) — positive.
- The deal already cash-flows at list — no discount required.
- Meets the 1% rule at list price ($4k rent vs $315k).
- Recommended offer: $296k (6.0% below list) — sets the bar for market timing.
- Cap rate 9.6% vs local median 2.1% in Los Angeles — top-decile yield for the area; either an underpriced asset or a hidden risk that comps aren't pricing in. Stress-test before assuming the spread holds.
Location & tenants
- Location reads 68/100 on livability (#273 in CA) — a middle-class / working-renter tenant base. Strengths: amenities A+, commute A+, employment B; Watch: health & safety C-, crime F, cost of living F.
- Los Angeles Unified (urban): math 29% / reading 54% proficiency, ranked #223 of 517 in CA (top 43%) — families likely to look elsewhere, expect single-tenant / working-renter base with shorter leases; 67% free/reduced lunch — lower-income household profile, screen leases tightly.
- Zoned schools: Harding Street Elementary (371 students, 66% FRL); San Fernando Middle (524 students, 97% FRL); San Fernando Senior High (math 20% / reading 51%, grade F, #609 of 1,170 statewide, top 52%, 1,745 students, 94% FRL) — zoned schools average 85% FRL vs 67% district-wide (18 pts higher); higher-poverty schools than district average — tighter screening recommended.
- Market conditions: Rents flat; 183 active listings in the ZIP; 6 comparable units currently listed for rent nearby; rentals at typical pace (median 17d on market — plan ~3-4 weeks tenant-placement turnaround); solid renter incomes; 19,697 units permitted in Los Angeles County in 2024 (9,426 in 5+ unit buildings).
- At $3,865/mo this rent would consume 47% of the median local household income ($98k/yr) (locally 2559% of renters already pay >50% of income on rent) — very limited rent-growth headroom before tenants either downsize or default.
Forward outlook
- Local home prices are declining (-3.0%/yr); year-one equity from $2k of loan paydown is wiped out by about $9k of value loss. Plan a longer hold.
- Los Angeles County population projected at +9% by 2050 — modest demand growth; plan on rents tracking national, not racing it.
Negotiation context
- It's been on market 68 days — a 6% lower offer ($296k) is reasonable based on typical stale-listing flexibility.
- 10 sale attempts since 21y ago with the ask held roughly flat each time — persistent listings suggest the price (not the market) is what's stuck; bring a comps-based counter.
- Current owner paid $185k; list at $315k implies a 70% gain — meaningful room to come down on a strong offer.
Risks & watch-outs
- Climate carrying-cost: severe wildfire risk; extreme-heat days projected 9→25/yr by 2055 (HVAC capex compounding) — expect insurance premiums to compound above CPI over the hold.
Questions for the listing agent
- It's been on market 68 days. Have you received any prior offers? Is the seller open to a 6% concession, seller financing, or rate buy-down credit?
- Why hasn't it sold? Are there any deal-killer items the seller is aware of (foundation, flood, title, zoning, code violations)?
- Is there a deadline driving the sale (1031 exchange, divorce, estate, relocation)? That informs how much negotiation room exists.
- Schools are D-rated, which usually means shorter tenancies and higher turnover. Who's the typical renter profile here, and what's been the actual vacancy rate?
- Crime grade is F in this area — have there been break-ins, vandalism, or insurance claims at this property in the last 3 years? What carrier currently insures it and at what premium?
- What's the average days-on-market for RENTAL listings here right now (not sales)? A rising rental-DOM trend means longer vacancies and softer asking-rent achievability than the comps imply.
- What's the recent tenant-quality profile in this submarket — average credit score on applications, eviction rate, late-payment / NSF rate, and stable-employment percentage? A property-management company in the area should have these aggregated.
- How much new for-sale + rental construction is in the pipeline within 1–3 miles? Heavy new supply typically softens prices + rents 12–24 months out; constrained supply supports both.
Investment metrics
- 1% rule
- 1.23% ✓
- Cap rate
- 9.63%
- Cash-on-cash
- 11.92%
- DSCR
- 1.53
- GRM
- 6.8
CMA / ARV
- ARV (median comp)
- $213,012
- List price
- $315,000
- Delta
- 47.88%
- Verdict
- OVERPRICED
- Comps
- 2 within 1.0 mi
Show comp detail 6 sales within ~0.75 mi
| Address | Dist | Beds/Ba | Sqft | Sold | Price | $/sf | Match |
|---|---|---|---|---|---|---|---|
| 13691 Gavina #609 | 0.00mi | 3/2.0 | 1,624 (+6%) | 1mo | $170,000 | $105 | 89 |
| 13691 Gavina Ave #418 | 0.00mi | 3/2.0 | 1,540 (+1%) | 15mo | $316,000 | $205 | 86 |
| 13691 Gavina Ave #359 | 0.00mi | 3/2.0 | 1,512 (-1%) | 17mo | $320,000 | $212 | 85 |
| 13691 Gavina Ave #576 | 0.00mi | 3/2.0 | 1,624 (+6%) | 11mo | $260,000 | $160 | 80 |
| 13691 Gavina #477 | 0.00mi | 3/2.0 | 1,495 (-2%) | 22mo | $235,000 | $157 | 78 |
| 13691 Gavina #566 | 0.00mi | 3/2.0 | 1,624 (+6%) | 20mo | $305,000 | $188 | 72 |
Match score weights: distance 35% · size 25% · config 20% · recency 20%. Top-matched comps best support the ARV.
Projected returns pro-forma
-3.0% appreciation · 0.02% rent growth · sell at horizon
- IRR
- -2.0%
- Equity multiple
- 0.93×
- Total profit
- $-6,433
- Equity at exit
- $46,968
- IRR
- 4.1%
- Equity multiple
- 1.26×
- Total profit
- $22,989
- Equity at exit
- $27,235
Cash invested: $88,200 (down + closing). Projections, not guarantees.
Landlord ↔ Tenant lean methodology
- Overall (CITY)
- 0 Strongly Tenant-Friendly
- State California
- 18 Strongly Tenant-Friendly · D+13
- County
- — inherits STATE
- City Los Angeles
- 0 Strongly Tenant-Friendly · D+22
ZIP-level market 91342
- Rents YoY
- 0.0%
- Active inventory
- 183
- Price-to-rent
- 6.8×
Monthly cashflow live
- Estimated rent
- $3,865 high interval (Pro) →
- Mortgage (P&I)
- −$1,652
- Tax est. 1.5%
- −$394 /mo · $4,725/yr
- Insurance
- −$131
- HOA
- −$0
- Vacancy / Maint / Mgmt
- −$812
- Net cashflow
- $876
Break-even live
Sensitivity live
| Price | -10% $1,094 | -5% $985 | +0% $876 | +5% $767 | +10% $658 |
|---|---|---|---|---|---|
| Rent | -10% $571 | -5% $724 | +0% $876 | +5% $1,029 | +10% $1,181 |
| Rate | -1.0pp $1,035 | -0.5pp $956 | base $876 | +0.5pp $795 | +1.0pp $712 |
UW: 25.0% down · 7.5% · 30yr · 1.5% tax · 5.0% vac · 8.0% maint · 8.0% mgmt
Financing live
Cash to close
- Down payment
- $78,750
- Closing costs
- $9,450
- Reserves months
- —
- Total cash needed
- —
Loan-product check · same deal, 3 products live
Conventional
25% down · 7.5% · 30yr
- Down + closing
- —
- Monthly P&I
- —
- Monthly cashflow
- —
- DSCR
- —
- Eligible?
- —
Personal DTI + credit; lowest rate.
DSCR
20% down · 8.5% · 30yr
- Down + closing
- —
- Monthly P&I
- —
- Monthly cashflow
- —
- DSCR
- —
- Eligible?
- —
No personal income docs; deal must DSCR.
Hard money
10% down · 12.0% · 12mo
- Down + closing
- —
- Monthly P&I
- —
- Monthly cashflow
- —
- DSCR
- —
- Eligible?
- —
Short-term bridge; refi at stabilization.
Rent comps 6 comps
| Address | Beds | Baths | Sqft | Rent | $/sqft | DOM | Units | Dist |
|---|---|---|---|---|---|---|---|---|
| 12707 Lazard St Sylmar, CA | 3.0 | 2.0 | 1067 | $3,700 | $3.47 | 45d | 1 | 0.34mi |
| 12727 Shenley St Sylmar, CA | 4.0 | 2.0 | 1631 | $3,795 | $2.33 | 6d | 1 | 0.82mi |
| 13191 Cranston Ave Sylmar, CA | 3.0 | 2.0 | 1469 | $4,250 | $2.89 | 4d | 1 | 0.89mi |
| 13197 Tripoli Ave Sylmar, CA | 3.0 | 2.0 | 1350 | $3,500 | $2.59 | 16d | 1 | 1.01mi |
| 13874 Aults Ave Sylmar, CA | 4.0 | 2.5 | 1300 | $4,250 | $3.27 | 0d | 1 | 1.21mi |
| 13057 Gladstone Ave Sylmar, CA | 4.0 | 2.0 | 1379 | $6,500 | $4.71 | 26d | 1 | 1.42mi |
Listing history 46 events
-
2026-06-21days on market $315,000 Active 68 DOM
-
2026-06-18days on market $315,000 Active 65 DOM
-
2026-06-17days on market $315,000 Active 64 DOM
-
2026-06-16days on market $315,000 Active 63 DOM
-
2026-06-15days on market $315,000 Active 62 DOM
-
2026-06-13days on market $315,000 Active 60 DOM
-
2026-06-09days on market $315,000 Active 56 DOM
-
2026-06-08days on market $315,000 Active 55 DOM
-
2026-06-07days on market $315,000 Active 54 DOM
-
2026-06-04days on market $315,000 Active 51 DOM
-
2026-06-03days on market $315,000 Active 50 DOM
-
2026-06-02days on market $315,000 Active 49 DOM
-
2026-06-01days on market $315,000 Active 48 DOM
-
2026-05-31days on market $315,000 Active 47 DOM
-
2026-04-14$315,000 Active 924-char remark
Show marketing remark (924 chars)
Welcome to Santiago Estates, one of Sylmar’s most desirable all-age manufactured home communities, nestled near the foothills with a peaceful, more private setting away from heavy through traffic. This 3-bedroom, 2-bath home offers a comfortable and functional layout, along with additional flexible living space that can be adapted to fit a variety of needs—perfect for today’s lifestyle. Step outside and enjoy your own side/backyard area, providing a rare opportunity for outdoor space—ideal for relaxing, entertaining, or creating your own private retreat. The community itself is known for its quiet atmosphere while still being conveniently located near shopping, dining, and everyday essentials. Residents of Santiago Estates enjoy a well-maintained neighborhood with amenities such as a pool, clubhouse, and recreational areas, all contributing to a welcoming, community-oriented environment.
-
2014-11-19historical
-
2014-06-19price $89,000
-
2014-06-12historical
-
2014-06-11price $92,500 Cancelled
-
2014-06-11historical
-
2014-06-11status Active
-
2014-06-06$92,500 Active
-
2014-03-20price $95,000
-
2014-02-10price $98,888
-
2014-02-10$95,000 Active
-
2009-11-16historical
-
2009-11-13$105,000 Active
-
2009-10-03historical
-
2009-07-21price $114,999
-
2009-07-08price $112,999
-
2009-05-29price $118,999
-
2009-04-10$119,999
-
2009-02-25historical
-
2009-02-25historical
-
2008-06-25price $120,000
-
2008-04-24price $145,000
-
2008-02-23price $155,000
-
2007-10-26$165,000
-
2007-10-25$120,000
-
2007-08-25historical
-
2007-06-29price $177,999
-
2007-05-31price $179,999
-
2007-04-14price $189,000
-
2007-04-05$194,900
-
2005-09-02soldstatus $185,000
-
2005-06-30$189,000
ⓘ Source: listings_history table (triggers on properties + properties_extension) + one-shot
backfill from property_details.listing_events for pre-trigger history.
Climate risk First Street
- Flood 1/10 Low FEMA zone X (unshaded) · 0% chance over 30 yrs
- Wildfire 8/10 Severe
- Heat 6/10 Major 9 d/yr ≥97°F today · 25 d/yr by 30 yrs out
- Wind 1/10 Low
- Air quality 7/10 Severe 13 unhealthy d/yr today · 16 by 30 yrs out
Nearby sold comps map
Loading sold comps map…
Walkable amenities ~0.75 mi
Loading nearby amenities…
Taxation est. · year 1
- Rental income
- $46,376
- − Mortgage interest
- −$17,645
- − Property taxes
- −$4,725
- − Insurance
- −$1,575
- − Repairs & maintenance
- −$3,710
- − Management
- −$3,710
- − Depreciation
- −$9,164
- Taxable income
- $5,847
- Est. tax owed @ 24.0%
- −$1,403
- After-tax cash flow
- $9,111/yr
For passive investors: Depreciation is non-cash, so a rental often shows a tax loss while cash-flowing — sheltering income. Rental losses are passive: they offset passive income freely, and up to $25,000/yr can offset ordinary (W-2) income if you actively participate and your MAGI is under $100k (phasing out to $0 by $150k); unused losses carry forward. On sale, claimed depreciation is recaptured at up to 25%, and gains may owe capital-gains tax (a 1031 exchange can defer both). Figures are a year-1 estimate at your 24.0% rate — not tax advice; consult a CPA.
Schools (NCES district)
- District
- Los Angeles Unified
- NCES district ID
- 0622710
- Math proficiency
- 29% ▼ -4.00%
- Reading proficiency
- 54% ▲ 10.00%
- Median HH income
- $50,403
- Composite
- 35.67/100
- National rank
- #4875
- State rank
- #223 of 517 in CA
Livability — Los Angeles
- Score
- 68/100
- State rank
- #273
- US rank
- #9237
Category grades
Schools grade is shown separately in the Schools card above.
Census & demographics
- Census place
- Los Angeles, CA
- County
- Los Angeles County · 9,444,647 people
- City population
- 3,838,149
- Metro
- Los Angeles-Long Beach-Anaheim, CA
- Population (ZIP)
- 93,301
- Household income
- $98,118
- Rent vs Own
- Severe rent burden
- 2559.0
Population outlook (Los Angeles County) Hauer SSP2
- Today (2025)
- 10,940,515 people
- By 2030
- 11,256,481 · +2.9%
- By 2040
- 11,729,929 · +7.2%
- By 2050
- 11,948,407 · +9.2%
- By 2075
- 11,818,114 · +8.0%
- By 2100
- 10,842,928 · -0.9%
Race, ethnicity, and origin ACS 2023
- Neighborhood character
- Predominantly Hispanic (74%)
- Race & ethnicity
- Hispanic / Latino 74% Two or more races 23% White 12% Asian 7% Black 3% Native American 2%
- Hispanic origin (detail)
- Mexican 59%
- Common ancestry
- Italian 1%
- Foreign-born
- 36% · Canada, South Korea, Dominican Republic
- Languages at home
- 32% English-only · Spanish 59% Tagalog/Filipino 4% Other Indo-European 3%
Political lean MEDSL · Los Angeles
- 2024 margin
- Solid D (+32.9) · D 64.8% · R 31.9% · Other 3.3%
- 2008→2024 swing
- -7.4pp toward R · 2008: 40.4pp · 2024: 32.9pp
- All cycles
- 2024: D+32.9 2020: D+44.2 2016: D+48.0 2012: D+40.0 2008: D+40.4
Not yet ingested
- Civics
- —
Market trends
- HPI YoY
- ▼ -921.77%
- Current HPI
- 440.1462
- Rent YoY
- ▬ 0.02%
- Metro
- Los Angeles-Long Beach-Anaheim, CA
- State GDP YoY
- ▲ 3.21%
- F500 in state
- 116
Industry mix (Fortune 500 HQ in CA)
| Industry | F500 HQs | Revenue |
|---|---|---|
| Technology | 27 | $1,492B |
|
||
| Financial Services | 3 | $174B |
|
||
| Retail | 3 | $44B |
|
||
| Insurance | 3 | $26B |
|
||
| Media / Entertainment | 2 | $115B |
|
||
| Pharmaceuticals / Biotech | 2 | $62B |
|
||
Price history
+66.7% since first listed32 events — show timeline
- 2026-04-14 Listed $315,000 CRMLS
- 2014-11-19 Listing Removed — CRMLS
- 2014-06-19 Price Changed $89,000 CRMLS
- 2014-06-12 Listing Removed — CRMLS
- 2014-06-11 Relisted — CRMLS
- 2014-06-11 Listing Removed — CRMLS
- 2014-06-11 Price Changed $92,500 CRMLS
- 2014-06-06 Listed $92,500 CRMLS
- 2014-03-20 Price Changed $95,000 CRMLS
- 2014-02-10 Price Changed $98,888 CRMLS
- 2014-02-10 Listed $95,000 CRMLS
- 2009-11-16 Listing Removed — CRMLS
- 2009-11-13 Listed $105,000 CRMLS
- 2009-10-03 Listing Removed — CRMLS
- 2009-07-21 Price Changed $114,999 CRMLS
- 2009-07-08 Price Changed $112,999 CRMLS
- 2009-05-29 Price Changed $118,999 CRMLS
- 2009-04-10 Listed $119,999 CRMLS
- 2009-02-25 Listing Removed — CRMLS
- 2009-02-25 Listing Removed — CRMLS
- 2008-06-25 Price Changed $120,000 CRMLS
- 2008-04-24 Price Changed $145,000 CRMLS
- 2008-02-23 Price Changed $155,000 CRMLS
- 2007-10-26 Listed $165,000 CRMLS
- 2007-10-25 Listed $120,000 CRMLS
- 2007-08-25 Listing Removed — CRMLS
- 2007-06-29 Price Changed $177,999 CRMLS
- 2007-05-31 Price Changed $179,999 CRMLS
- 2007-04-14 Price Changed $189,000 CRMLS
- 2007-04-05 Listed $194,900 CRMLS
- 2005-09-02 Sold (MLS) $185,000 CRMLS
- 2005-06-30 Listed $189,000 CRMLS
Property tax history
+4.0%/yrLatest (2025): $583 · +4.0% YoY. Source: county tax records.
Cash-flow waterfall
monthlySold comps — $/sqft
last 12 mo · ≤1 miLoading sold comps…