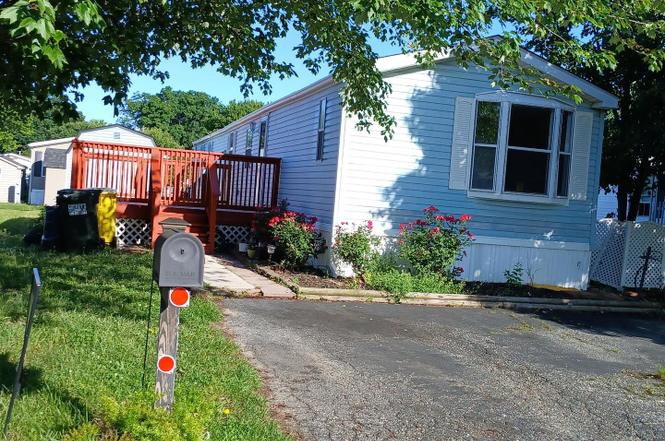
114 Roundup Rd · Middle River, MD
Flood risk No data
- FEMA flood zone
- —
- Chance of flooding over 30 yrs
- —
- Est. flood insurance / yr
- —
Fire risk No data
- Est. fire insurance / yr
- —
Heat risk No data
- Hot days now (above threshold)
- —
- Hot days in 30 yrs
- —
Wind risk No data
- Chance of severe wind over 30 yrs
- —
Air-quality risk No data
- Unhealthy air days now
- —
- Unhealthy air days in 30 yrs
- —
Risk factors via First Street. Map © Google.
Why this score? — see what drove the D grade
The composite is a weighted blend of 9 inputs, each scored 0–100. Each bar is that input's sub-score; the figure is the points it added to the 100-point composite (weight × sub-score).
- Cash flow +15.0/30.0
- ARV discount +7.5/15.0
- 1% rule +5.0/10.0
- DSCR +5.0/10.0
- Livability +3.9/5.0
- Rent growth +2.7/5.0
- Condition / age +2.5/5.0
- Schools +2.3/10.0
- Appreciation +0.0/10.0
$39,999
🖨 Deal sheet (PDF) 📄 Offer letter ✓ Due diligence
Listing remarks MLS
Attractive 3 bedroom 2 bath single mobile home in great condition with many upgrades that includes 50 gallon water heater, stainless steel appliances, front load washer & dryer, 16x20 deck with a 10x10 canopy, large shed. Owner has new HVAC installed 2022. Buyers must be park approved and park rent is $904 monthly.
Key facts
- Built 1988
- Listed 332 days
Property features AI
Finance
- Other: Ownership interest: Ground rent; Property condition: Excellent
- HOA & community: Ground rent of $1,114 paid monthly
Exterior
- Parking: Private paved parking; Paved driveway (asphalt); Parking lot / off-street parking
- Utilities: Public water; Public sewer
- Home design: Manufactured single wide; Vinyl siding; Asphalt roof; Estimated year built
- Construction: Vinyl siding construction; Asphalt roof; Double-pane windows; Manufactured structure
- Exterior features: No basement; Above grade living space
Interior
- Kitchen: Dishwasher; Disposal; Exhaust fan; Icemaker; Self-cleaning oven; Electric range; Range hood; Refrigerator; Stainless steel appliances; Electric water heater
- Bedrooms: Three bedrooms on the main level
- Flooring: Carpet; Engineered wood
- Bathrooms: Two full bathrooms (both on the main level)
- Heating & cooling: Forced air heating (electric); Central air conditioning; Ceiling fans
- Interior features: Ceiling fans; Kitchen with table space and eat-in area; Walk-in closets; Estimated living area
- Laundry & utility: Water heater (electric)
Neighborhood map
What this means for you Summary
Snapshot
- This is a 3-bed/2.0-bath manufactured listed at $40k.
Deal economics
- At list price, monthly cash flow is $1k ($18k/yr) — positive.
- The deal already cash-flows at list — no discount required.
- Meets the 1% rule at list price ($2k rent vs $40k).
- Recommended offer: $35k (12.0% below list) — sets the bar for market timing.
- Cap rate 50.7% vs local median 4.2% in Middle River — top-decile yield for the area; either an underpriced asset or a hidden risk that comps aren't pricing in. Stress-test before assuming the spread holds.
Location & tenants
- Location reads 78/100 on livability (#76 in MD, #2,777 nationally) — a middle-class / working-renter tenant base. Strengths: commute A+, housing A+, health & safety A+; Watch: crime F.
- Baltimore County Public Schools (suburban): math 15% / reading 34% proficiency, ranked #11 of 24 in MD (top 46%) — low school quality limits family demand, transient renter base, plan for 1-2y turnover.
- Zoned schools: Chase Elementary (math 12% / reading 17%, grade F, #477 of 860 statewide, top 59%, 358 students, 60% FRL); Middle River Middle (math 5% / reading 32%, grade F, #159 of 225 statewide, top 73%, 978 students, 62% FRL); Kenwood High (math 10% / reading 43%, grade F, #161 of 222 statewide, top 72%, 1,908 students, 63% FRL) — zoned schools average 62% FRL vs 39% district-wide (23 pts higher); higher-poverty schools than district average — tighter screening recommended.
- Market conditions: Rents flat; 252 active listings in the ZIP; 4 comparable units currently listed for rent nearby; rentals leasing fast (median 0d on market — plan ~1-2 weeks tenant-placement turnaround); solid renter incomes; 1,511 units permitted in Baltimore County in 2024 (643 in 5+ unit buildings).
- This rent runs 33% of the median local income ($82k/yr) — at the standard rent-burdened threshold; future hikes will face affordability resistance.
Forward outlook
- Local home prices are declining (-3.0%/yr); year-one equity from $276 of loan paydown is wiped out by about $1k of value loss. Plan a longer hold.
- Baltimore County population projected at +12% by 2050 — modest demand growth; plan on rents tracking national, not racing it.
- At projected returns (-3.0% appreciation + 0.8% rent growth), your $11k cash investment doubles in ~1 year — after that, you're playing with house money.
Negotiation context
- It's been on market 332 days — a 12% lower offer ($35k) is reasonable based on typical stale-listing flexibility.
- 5 sale attempts since 21y ago; this cycle's ask has dropped $10k (20%) from the opening price — seller is motivated, your offer sets the floor, not the list.
Questions for the listing agent
- It's been on market 332 days. Have you received any prior offers? Is the seller open to a 12% concession, seller financing, or rate buy-down credit?
- Why hasn't it sold? Are there any deal-killer items the seller is aware of (foundation, flood, title, zoning, code violations)?
- Is there a deadline driving the sale (1031 exchange, divorce, estate, relocation)? That informs how much negotiation room exists.
- Schools are F-rated, which usually means shorter tenancies and higher turnover. Who's the typical renter profile here, and what's been the actual vacancy rate?
- Crime grade is F in this area — have there been break-ins, vandalism, or insurance claims at this property in the last 3 years? What carrier currently insures it and at what premium?
- The area grade is low — what's the realistic commute time and amenity access for the typical tenant pool here? Any planned neighborhood developments (good or bad) we should know about?
- What's the average days-on-market for RENTAL listings here right now (not sales)? A rising rental-DOM trend means longer vacancies and softer asking-rent achievability than the comps imply.
- What's the recent tenant-quality profile in this submarket — average credit score on applications, eviction rate, late-payment / NSF rate, and stable-employment percentage? A property-management company in the area should have these aggregated.
- How much new for-sale + rental construction is in the pipeline within 1–3 miles? Heavy new supply typically softens prices + rents 12–24 months out; constrained supply supports both.
Investment metrics
- 1% rule
- 5.56% ✓
- Cap rate
- 50.66%
- Cash-on-cash
- 158.47%
- DSCR
- 8.05
- GRM
- 1.5
CMA / ARV
No comps found within radius.
Projected returns pro-forma
-3.0% appreciation · 0.83% rent growth · sell at horizon
- IRR
- —
- Equity multiple
- 8.41×
- Total profit
- $83,001
- Equity at exit
- $5,964
- IRR
- —
- Equity multiple
- 16.63×
- Total profit
- $175,050
- Equity at exit
- $3,458
Cash invested: $11,200 (down + closing). Projections, not guarantees.
Landlord ↔ Tenant lean methodology
- Overall (STATE)
- 27 Tenant-Leaning
- State Maryland
- 27 Tenant-Leaning · D+14
- County
- — inherits STATE
- City
- — inherits STATE
ZIP-level market 21220
- Rents YoY
- 0.8%
- Active inventory
- 252
- Price-to-rent
- 1.5×
Monthly cashflow live
- Estimated rent
- $2,222 medium interval (Pro) →
- Mortgage (P&I)
- −$210
- Tax est. 1.5%
- −$50 /mo · $600/yr
- Insurance
- −$17
- HOA
- −$0
- Vacancy / Maint / Mgmt
- −$467
- Net cashflow
- $1,479
Break-even live
Sensitivity live
| Price | -10% $1,507 | -5% $1,493 | +0% $1,479 | +5% $1,465 | +10% $1,451 |
|---|---|---|---|---|---|
| Rent | -10% $1,303 | -5% $1,391 | +0% $1,479 | +5% $1,567 | +10% $1,655 |
| Rate | -1.0pp $1,499 | -0.5pp $1,489 | base $1,479 | +0.5pp $1,469 | +1.0pp $1,458 |
UW: 25.0% down · 7.5% · 30yr · 1.5% tax · 5.0% vac · 8.0% maint · 8.0% mgmt
Financing live
Cash to close
- Down payment
- $10,000
- Closing costs
- $1,200
- Reserves months
- —
- Total cash needed
- —
Loan-product check · same deal, 3 products live
Conventional
25% down · 7.5% · 30yr
- Down + closing
- —
- Monthly P&I
- —
- Monthly cashflow
- —
- DSCR
- —
- Eligible?
- —
Personal DTI + credit; lowest rate.
DSCR
20% down · 8.5% · 30yr
- Down + closing
- —
- Monthly P&I
- —
- Monthly cashflow
- —
- DSCR
- —
- Eligible?
- —
No personal income docs; deal must DSCR.
Hard money
10% down · 12.0% · 12mo
- Down + closing
- —
- Monthly P&I
- —
- Monthly cashflow
- —
- DSCR
- —
- Eligible?
- —
Short-term bridge; refi at stabilization.
Rent comps 4 comps
| Address | Beds | Baths | Sqft | Rent | $/sqft | DOM | Units | Dist |
|---|---|---|---|---|---|---|---|---|
| 3736 White Pine Rd Middle River, MD | 1.0–2.0 | 1.0 | 741 | $1,335 | $1.80 | 0d | 17 | 0.88mi |
| 37 Alberge Ln Middle River, MD | 2.0–3.0 | 1.0–2.0 | 928 | $2,052 | $2.21 | 0d | 8 | 0.99mi |
| 11550 Crossroads Cir Middle River, MD | 1.0–2.0 | 1.0–2.0 | 864 | $2,824 | $3.27 | 0d | 11 | 1.05mi |
| 6221 Greenleigh Ave Middle River, MD | 1.0–2.0 | 1.0–2.0 | 1059 | $2,957 | $2.79 | 3d | 16 | 1.22mi |
Listing history 15 events
-
2026-06-21days on market $39,999 Active 332 DOM
-
2026-06-18days on market $39,999 Active 329 DOM
-
2026-06-17days on market $39,999 Active 328 DOM
-
2026-06-16days on market $39,999 Active 327 DOM
-
2026-06-15days on market $39,999 Active 326 DOM
-
2026-06-13days on market $39,999 Active 324 DOM
-
2026-06-09days on market $39,999 Active 320 DOM
-
2026-06-08days on market $39,999 Active 319 DOM
-
2026-06-08price $39,999 Active 318 DOM
-
2026-06-07days on market $40,000 Active 318 DOM
-
2026-06-04days on market $40,000 Active 315 DOM
-
2026-06-03days on market $40,000 Active 314 DOM
-
2026-06-02days on market $40,000 Active 313 DOM
-
2026-06-02remarks 225-char remark
-
2026-06-02$40,000 Active 312 DOM
ⓘ Source: listings_history table (triggers on properties + properties_extension) + one-shot
backfill from property_details.listing_events for pre-trigger history.
Nearby sold comps map
Loading sold comps map…
Walkable amenities ~0.75 mi
Loading nearby amenities…
Taxation est. · year 1
- Rental income
- $26,665
- − Mortgage interest
- −$2,241
- − Property taxes
- −$600
- − Insurance
- −$200
- − Repairs & maintenance
- −$2,133
- − Management
- −$2,133
- − Depreciation
- −$1,164
- Taxable income
- $18,194
- Est. tax owed @ 24.0%
- −$4,367
- After-tax cash flow
- $13,381/yr
For passive investors: Depreciation is non-cash, so a rental often shows a tax loss while cash-flowing — sheltering income. Rental losses are passive: they offset passive income freely, and up to $25,000/yr can offset ordinary (W-2) income if you actively participate and your MAGI is under $100k (phasing out to $0 by $150k); unused losses carry forward. On sale, claimed depreciation is recaptured at up to 25%, and gains may owe capital-gains tax (a 1031 exchange can defer both). Figures are a year-1 estimate at your 24.0% rate — not tax advice; consult a CPA.
Schools (NCES district)
- District
- Baltimore County Public Schools
- NCES district ID
- 2400120
- Math proficiency
- 15% ▼ -16.00%
- Reading proficiency
- 34% ▼ -5.00%
- Median HH income
- $66,746
- Composite
- 23.17/100
- National rank
- #7948
- State rank
- #11 of 24 in MD
Livability — Middle River
- Score
- 78/100
- State rank
- #76
- US rank
- #2777
Category grades
Schools grade is shown separately in the Schools card above.
Census & demographics
- Census place
- Middle River, MD
- County
- Baltimore County · 769,527 people
- City population
- 42,824
- Metro
- Baltimore-Columbia-Towson, MD
- Population (ZIP)
- 42,824
- Household income
- $81,817
- Rent vs Own
- Severe rent burden
- 1921.0
Population outlook (Baltimore County) Hauer SSP2
- Today (2025)
- 885,518 people
- By 2030
- 909,272 · +2.7%
- By 2040
- 951,547 · +7.5%
- By 2050
- 990,955 · +11.9%
- By 2075
- 1,086,411 · +22.7%
- By 2100
- 1,135,078 · +28.2%
Race, ethnicity, and origin ACS 2023
- Neighborhood character
- Diverse neighborhood (Simpson 0.60)
- Race & ethnicity
- White 57% Black 27% Two or more races 6% Hispanic / Latino 6% Asian 5%
- Hispanic origin (detail)
- Puerto Rican 1%
- Common ancestry
- Romanian 4% Ukrainian 2% Lithuanian 1%
- Foreign-born
- 12% · Canada, Vietnam
- Languages at home
- 86% English-only · Spanish 3% Arabic 3% Tagalog/Filipino 2%
Political lean MEDSL · Baltimore
- 2024 margin
- Strong D (+24.5) · D 61.0% · R 36.5% · Other 2.5%
- 2008→2024 swing
- +9.9pp toward D · 2008: 14.6pp · 2024: 24.5pp
- All cycles
- 2024: D+24.5 2020: D+27.0 2016: D+17.4 2012: D+16.4 2008: D+14.6
Not yet ingested
- Civics
- —
Market trends
- HPI YoY
- ▼ -199.31%
- Current HPI
- 254.5597
- Rent YoY
- ▲ 0.83%
- Metro
- Baltimore-Columbia-Towson, MD
- State GDP YoY
- ▲ 2.97%
- F500 in state
- 12
Industry mix (Fortune 500 HQ in MD)
| Industry | F500 HQs | Revenue |
|---|---|---|
| Aerospace / Defense | 1 | $71B |
|
||
| Utilities | 1 | $25B |
|
||
| Hotels | 1 | $24B |
|
||
| Consumer Goods | 1 | $7B |
|
||
| Real Estate | 1 | $6B |
|
||
| Chemicals | 1 | $2B |
|
||
Price history
-10.9% since first listed14 events — show timeline
- 2026-06-01 Relisted — BRIGHT MLS
- 2026-04-28 Listing Removed — BRIGHT MLS
- 2026-04-28 Price Changed $40,000 BRIGHT MLS
- 2026-04-07 Price Changed $35,250 BRIGHT MLS
- 2026-03-20 Price Changed $37,500 BRIGHT MLS
- 2026-03-20 Relisted — BRIGHT MLS
- 2026-03-19 Listing Removed — BRIGHT MLS
- 2026-02-07 Price Changed $40,000 BRIGHT MLS
- 2025-06-19 Listed $50,000 BRIGHT MLS
- 2023-04-17 Sold (MLS) $40,000 BRIGHT MLS
- 2023-03-17 Pending — BRIGHT MLS
- 2023-03-14 Listed $44,900 BRIGHT MLS
- 2005-11-20 Delisted — MRIS
- 2005-11-17 Listed — MRIS
Cash-flow waterfall
monthlySold comps — $/sqft
last 12 mo · ≤1 miLoading sold comps…