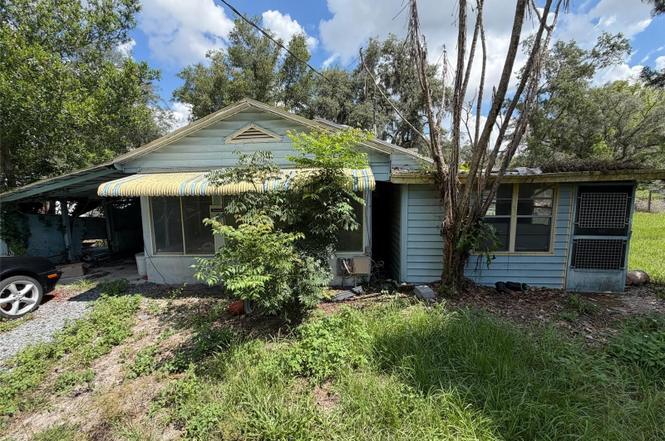
38343 Corey St · Zephyrhills South, FL
Flood risk 4/10 · Minor
- FEMA flood zone
- X (unshaded)
- Chance of flooding over 30 yrs
- 0.22%
- Est. flood insurance / yr
- $507 – $1,088
Fire risk 4/10 · Minor
- Est. fire insurance / yr
- $947 – $1,759
Heat risk 9/10 · Severe
- Hot days now (above 108°F)
- 7 days/yr
- Hot days in 30 yrs
- 24 days/yr
Wind risk 9/10 · Severe
- Chance of severe wind over 30 yrs
- 99.0%
Air-quality risk 2/10 · Minimal
- Unhealthy air days now
- 1 days/yr
- Unhealthy air days in 30 yrs
- 2 days/yr
Risk factors via First Street. Map © Google.
Why this score? — see what drove the C+ grade
The composite is a weighted blend of 9 inputs, each scored 0–100. Each bar is that input's sub-score; the figure is the points it added to the 100-point composite (weight × sub-score).
- Cash flow +24.8/30.0
- ARV discount +15.0/15.0
- DSCR +8.0/10.0
- 1% rule +5.3/10.0
- Schools +4.3/10.0
- Livability +2.9/5.0
- Condition / age +2.5/5.0
- Rent growth +1.6/5.0
- Appreciation +0.0/10.0
$115,000
🖨 Deal sheet 📄 Offer letter ✓ Due diligence
Listing remarks MLS
FIXER-UPPER THAT NEEDS A COMPLETE REMODELING
Key facts
- New ac system
- 0.29 acre lot
- Parking
Tags
Property features AI
Finance
- Other: Lot size about 0.29 acres (approximately 1/4 to less than 1/2 acre)
- HOA & community: No association/HOA; Pets allowed
Exterior
- Parking: Has carport (1 space)
- Utilities: Well water; Septic sewer; Electricity available; Water available
- Home design: Single-family residence; Residential property; One story; Faces south; Property condition: Completed; Zoning: R3
- Construction: Vinyl siding; Shingle roof; Slab foundation; Built on vinyl-sided construction
- Exterior features: Other exterior features; Gravel road access
Interior
- Kitchen: Range
- Bedrooms: 2 bedrooms
- Flooring: Tile
- Bathrooms: 1 full bathroom
- Heating & cooling: Natural gas heating; Central air conditioning
- Interior features: Ceiling fans
- Laundry & utility: Other laundry features
Neighborhood map
What this means for you Summary
Snapshot
- This is a 2-bed/1.0-bath single-family listed at $115k.
Deal economics
- At list price, monthly cash flow is $243 ($3k/yr) — positive.
- The deal already cash-flows at list — no discount required.
- Meets the 1% rule at list price ($1k rent vs $115k).
- Cap rate 8.8% vs local median 4.1% in Zephyrhills South — top-decile yield for the area; either an underpriced asset or a hidden risk that comps aren't pricing in. Stress-test before assuming the spread holds.
Location & tenants
- Location reads 58/100 on livability (#836 in FL) — a working-class tenant base; expect higher turnover. Strengths: cost of living A+; Watch: employment D, amenities F, commute F.
- Pasco (suburban): math 50% / reading 52% proficiency, ranked #32 of 73 in FL (top 44%) — acceptable for families but not a draw, mixed tenant base, ~2y average lease.
- Zoned schools: West Zephyrhills Elementary School (math 27% / reading 32%, grade F, #1,896 of 2,144 statewide, top 90%, 615 students, 81% FRL); Zephyrhills High School (math 35% / reading 37%, grade F, #359 of 667 statewide, top 55%, 1,656 students, 70% FRL) — zoned schools average 75% FRL vs 48% district-wide (27 pts higher); higher-poverty schools than district average — tighter screening recommended.
- Zoned-school proficiency averages 33% at this address vs 51% district-wide (-18 pts) — the specific schools serving this property underperform the Pasco average; the district grade overstates school quality for this exact location.
- Market conditions: Rents falling (-3.6%/yr); 294 active listings in the ZIP; 17 comparable units currently listed for rent nearby; rentals at typical pace (median 24d on market — plan ~3-4 weeks tenant-placement turnaround); 6,765 units permitted in Pasco County in 2024 (1,250 in 5+ unit buildings).
Forward outlook
- Local home prices are declining (-3.0%/yr); year-one equity from $795 of loan paydown is wiped out by about $3k of value loss. Plan a longer hold.
- Pasco County population projected at +29% by 2050 — long-run rental-demand tailwind backs the buy-and-hold thesis.
Negotiation context
- Only 3 days on market — expect competitive offers; lowballing is unlikely to land.
- 2 sale attempts since 19y ago with the ask held roughly flat each time — persistent listings suggest the price (not the market) is what's stuck; bring a comps-based counter.
- Current owner paid $47k; list at $115k implies a 145% gain — meaningful room to come down on a strong offer.
Risks & watch-outs
- Watch-outs: built in 1950 — expect roof / HVAC / electrical / plumbing capex.
- Climate carrying-cost: severe wind risk, 99% chance of damaging wind over 30y; extreme-heat days projected 7→24/yr by 2055 (HVAC capex compounding) — expect insurance premiums to compound above CPI over the hold.
Questions for the listing agent
- Built in 1950 — when were the roof, HVAC, electrical panel, plumbing, and water heater last replaced?
- Is there a deadline driving the sale (1031 exchange, divorce, estate, relocation)? That informs how much negotiation room exists.
- Schools are F-rated, which usually means shorter tenancies and higher turnover. Who's the typical renter profile here, and what's been the actual vacancy rate?
- What's the average days-on-market for RENTAL listings here right now (not sales)? A rising rental-DOM trend means longer vacancies and softer asking-rent achievability than the comps imply.
- What's the recent tenant-quality profile in this submarket — average credit score on applications, eviction rate, late-payment / NSF rate, and stable-employment percentage? A property-management company in the area should have these aggregated.
- How much new for-sale + rental construction is in the pipeline within 1–3 miles? Heavy new supply typically softens prices + rents 12–24 months out; constrained supply supports both.
Investment metrics
- 1% rule
- 1.03% ✓
- Cap rate
- 8.82%
- Cash-on-cash
- 9.04%
- DSCR
- 1.40
- GRM
- 8.1
CMA / ARV
- ARV (on-the-fly)
- $149,766
- Comps found
- 6
Show comp detail 6 sales within ~0.75 mi
| Address | Dist | Beds/Ba | Sqft | Sold | Price | $/sf | Match |
|---|---|---|---|---|---|---|---|
| 38312 Justin Ave | 0.43mi | 1/1.0 (-1) | 688 (+0%) | 2mo | $150,000 | $218 | 73 |
| 38310 Fir Ave | 0.07mi | 2/2.0 | 644 (-6%) | 22mo | $210,000 | $326 | 64 |
| 4641 Orange Blossom Dr | 0.56mi | 2/1.0 | 684 (-0%) | 15mo | $77,575 | $113 | 61 |
| 4631 6th St | 0.42mi | 3/1.0 (+1) | 734 (+7%) | 8mo | $224,000 | $305 | 57 |
| 4522 5th St | 0.30mi | 2/1.0 | 780 (+14%) | 12mo | $140,000 | $179 | 53 |
| 37910 Sago Palm Dr | 0.59mi | 2/1.0 | 788 (+15%) | 15mo | $75,000 | $95 | 36 |
Match score weights: distance 35% · size 25% · config 20% · recency 20%. Top-matched comps best support the ARV.
Projected returns pro-forma
-3.0% appreciation · 0.0% rent growth · sell at horizon
- IRR
- -5.7%
- Equity multiple
- 0.79×
- Total profit
- $-6,686
- Equity at exit
- $17,147
- IRR
- 0.3%
- Equity multiple
- 1.02×
- Total profit
- $530
- Equity at exit
- $9,943
Cash invested: $32,200 (down + closing). Projections, not guarantees.
Landlord ↔ Tenant lean methodology
- Overall (STATE)
- 87 Strongly Landlord-Friendly
- State Florida
- 87 Strongly Landlord-Friendly · R+3
- County
- — inherits STATE
- City
- — inherits STATE
ZIP-level market 33542
- Home prices YoY
- -20.6%
- Rents YoY
- -3.6%
- Active inventory
- 294
- Price-to-rent
- 8.1×
Monthly cashflow live
- Estimated rent
- $1,179 high interval (Pro) →
- Mortgage (P&I)
- −$603
- Tax from tax record
- −$38 /mo · $454/yr
- Insurance
- −$48
- HOA
- −$0
- Vacancy / Maint / Mgmt
- −$248
- Net cashflow
- $243
Break-even live
UW: 25.0% down · 7.5% · 30yr · 1.5% tax · 5.0% vac · 8.0% maint · 8.0% mgmt
Financing live
Cash to close
- Down payment
- $28,750
- Closing costs
- $3,450
- Reserves months
- —
- Total cash needed
- —
Loan-product check · same deal, 3 products live
Conventional
25% down · 7.5% · 30yr
- Down + closing
- —
- Monthly P&I
- —
- Monthly cashflow
- —
- DSCR
- —
- Eligible?
- —
Personal DTI + credit; lowest rate.
DSCR
20% down · 8.5% · 30yr
- Down + closing
- —
- Monthly P&I
- —
- Monthly cashflow
- —
- DSCR
- —
- Eligible?
- —
No personal income docs; deal must DSCR.
Hard money
10% down · 12.0% · 12mo
- Down + closing
- —
- Monthly P&I
- —
- Monthly cashflow
- —
- DSCR
- —
- Eligible?
- —
Short-term bridge; refi at stabilization.
Rent comps 17 comps
| Address | Beds | Baths | Sqft | Rent | $/sqft | DOM | Units | Dist |
|---|---|---|---|---|---|---|---|---|
| 4352 6th St Zephyrhills, FL | 1.0 | 1.0 | 494 | $1,100 | $2.23 | 24d | 1 | 0.17mi |
| 4410 Plum St Zephyrhills, FL | 1.0 | 1.0 | 624 | $1,100 | $1.76 | 24d | 1 | 0.19mi |
| 4412 Plum St Zephyrhills, FL | 1.0 | 1.0 | 624 | $1,100 | $1.76 | 24d | 1 | 0.19mi |
| 37925 Date Palm Dr Zephyrhills, FL | 3.0 | 1.5 | 720 | $1,300 | $1.81 | 24d | 1 | 0.54mi |
| 4833 Royal Palm Dr Zephyrhills, FL | 2.0 | 1.0 | 672 | $1,090 | $1.62 | 24d | 1 | 0.76mi |
| 38941 C Ave Zephyrhills, FL | 1.0 | 1.0 | 520 | $1,050 | $2.02 | 4d | 1 | 0.80mi |
| 4808 20th St Zephyrhills, FL | 2.0 | 1.0 | 702 | $1,295 | $1.84 | 10d | 1 | 0.87mi |
| 5150 6th St Zephyrhills, FL | 1.0 | 1.0 | 600 | $925 | $1.54 | 24d | 1 | 0.95mi |
| 38044 6th Ave Unit 38044 Zephyrhills, FL | 1.0 | 1.0 | 494 | $950 | $1.92 | 24d | 1 | 0.96mi |
| 5214 7th St Zephyrhills, FL | 1.0 | 1.0 | 550 | $1,100 | $2.00 | 16d | 1 | 0.99mi |
| 5214 7th St Zephyrhills, FL | 1.0 | 1.0 | 550 | $950 | $1.73 | 4d | 1 | 0.99mi |
| 5208 7th St Zephyrhills, FL | 1.0 | 1.0 | 550 | $950 | $1.73 | 4d | 1 | 0.99mi |
| 5206 7th St Zephyrhills, FL | 1.0 | 1.0 | 550 | $950 | $1.73 | 4d | 1 | 0.99mi |
| 5217 17th St Zephyrhills, FL | 1.0 | 1.0 | 540 | $1,050 | $1.94 | 24d | 1 | 1.09mi |
| 5426 8th St #1 Zephyrhills, FL | 1.0 | 1.0 | 432 | $1,150 | $2.66 | 24d | 1 | 1.21mi |
| 39041 Manor Dr Unit B Zephyrhills, FL | 1.0 | 1.0 | 450 | $1,000 | $2.22 | 24d | 1 | 1.33mi |
| 5611 1st St Zephyrhills, FL | 1.0 | 1.0 | 600 | $1,095 | $1.82 | 16d | 1 | 1.44mi |
Listing history 4 events
-
2026-06-18days on market $115,000 Active 3 DOM
-
2026-06-17days on market $115,000 Active 2 DOM
-
2026-06-15remarks 319-char remark
-
2026-06-15$115,000 Active 1 DOM
ⓘ Source: listings_history table (triggers on properties + properties_extension) + one-shot
backfill from property_details.listing_events for pre-trigger history.
Tax reassessment forecast FL · Resets to sale price
- Current annual tax
- $454 · $38/mo
- Projected year-2 tax
- $954 · $80/mo
- Expected delta
- +$501/yr (+$42/mo · 110.4%)
ⓘ Screening estimate from a state-policy table — verify with the county assessor before closing.
Climate risk First Street
- Flood 4/10 Moderate FEMA zone X (unshaded) · 22% chance over 30 yrs
- Wildfire 4/10 Moderate
- Heat 9/10 Extreme 7 d/yr ≥108°F today · 24 d/yr by 30 yrs out
- Wind 9/10 Extreme 99% chance of damaging wind over 30 yrs
- Air quality 2/10 Low 1 unhealthy d/yr today · 2 by 30 yrs out
Nearby sold comps map
Loading sold comps map…
Walkable amenities ~0.75 mi
Loading nearby amenities…
Taxation est. · year 1
- Rental income
- $14,148
- − Mortgage interest
- −$6,442
- − Property taxes
- −$454
- − Insurance
- −$575
- − Repairs & maintenance
- −$1,132
- − Management
- −$1,132
- − Depreciation
- −$3,345
- Taxable income
- $1,068
- Est. tax owed @ 24.0%
- −$256
- After-tax cash flow
- $2,655/yr
For passive investors: Depreciation is non-cash, so a rental often shows a tax loss while cash-flowing — sheltering income. Rental losses are passive: they offset passive income freely, and up to $25,000/yr can offset ordinary (W-2) income if you actively participate and your MAGI is under $100k (phasing out to $0 by $150k); unused losses carry forward. On sale, claimed depreciation is recaptured at up to 25%, and gains may owe capital-gains tax (a 1031 exchange can defer both). Figures are a year-1 estimate at your 24.0% rate — not tax advice; consult a CPA.
Schools (NCES district)
- District
- Pasco
- NCES district ID
- 1201530
- Math proficiency
- 50% ▼ -10.00%
- Reading proficiency
- 52% ▼ -5.00%
- Median HH income
- $45,039
- Composite
- 43.14/100
- National rank
- #3074
- State rank
- #32 of 73 in FL
Livability — Zephyrhills South
- Score
- 58/100
- State rank
- #836
- US rank
- #20702
Category grades
Schools grade is shown separately in the Schools card above.
Census & demographics
- Census place
- Zephyrhills South, FL
- County
- Pasco County · 524,098 people
- Metro
- Tampa-St. Petersburg-Clearwater, FL
- Population (ZIP)
- 23,612
- Household income
- $49,316
- Rent vs Own
- Severe rent burden
- 831.0
Population outlook (Pasco County) Hauer SSP2
- Today (2025)
- 570,045 people
- By 2030
- 605,844 · +6.3%
- By 2040
- 674,806 · +18.4%
- By 2050
- 736,022 · +29.1%
- By 2075
- 862,900 · +51.4%
- By 2100
- 906,364 · +59.0%
Race, ethnicity, and origin ACS 2023
- Neighborhood character
- Predominantly White (76%)
- Race & ethnicity
- White 76% Hispanic / Latino 17% Two or more races 8% Black 4% Asian 1%
- Hispanic origin (detail)
- Mexican 2% Puerto Rican 10%
- Common ancestry
- Lithuanian 3% Romanian 2% Iranian 2%
- Foreign-born
- 5% · Canada, Jamaica
- Languages at home
- 86% English-only · Spanish 12% Other Indo-European 1% Russian/Polish/Slavic 1%
Political lean MEDSL · Pasco
- 2024 margin
- Strong R (+25.2) · D 36.9% · R 62.1% · Other 1.0%
- 2008→2024 swing
- -21.6pp toward R · 2008: -3.6pp · 2024: -25.2pp
- All cycles
- 2024: R+25.2 2020: R+20.1 2016: R+21.6 2012: R+6.7 2008: R+3.6
Not yet ingested
- Civics
- —
Market trends
- HPI YoY
- ▼ -81.25%
- Current HPI
- 313.3993
- Rent YoY
- ▼ -3.56%
- Metro
- Tampa-St. Petersburg-Clearwater, FL
- State GDP YoY
- ▲ 3.28%
- F500 in state
- 36
Industry mix (Fortune 500 HQ in FL)
| Industry | F500 HQs | Revenue |
|---|---|---|
| Industrial Technology | 2 | $29B |
|
||
| Insurance | 2 | $17B |
|
||
| Retail | 1 | $60B |
|
||
| Technology Distribution | 1 | $58B |
|
||
| Homebuilding | 1 | $35B |
|
||
| Technology Manufacturing | 1 | $35B |
|
||
Price history
+425.1% since first listed5 events — show timeline
- 2026-06-15 Listed $115,000 Stellar MLS as Distributed by MLS Grid
- 2007-09-19 Sold (Public Records) $47,000 Public Records
- 2007-09-07 Sold (MLS) $27,500 Stellar MLS as Distributed by MLS Grid
- 2007-08-14 Listed $27,500 Stellar MLS as Distributed by MLS Grid
- 1980-11-01 Sold (Public Records) $21,900 Public Records
Property tax history
+4.0%/yrLatest (2025): $454 · +6.2% YoY. Source: county tax records.
Cash-flow waterfall
monthlySold comps — $/sqft
last 12 mo · ≤1 miLoading sold comps…