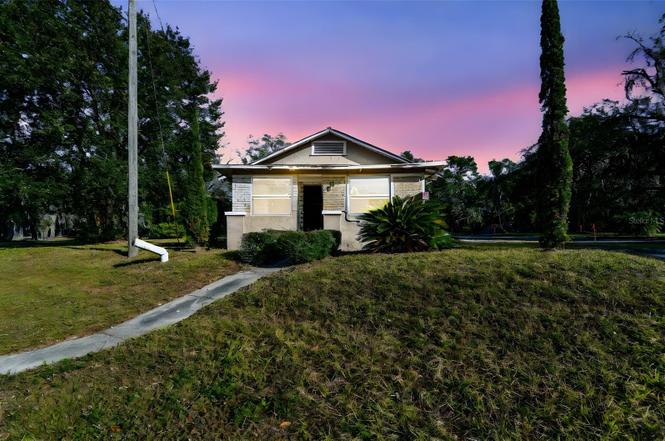
2311 S Ronald Reagan Blvd · Altamonte Springs, FL
Flood risk 1/10 · Minimal
- FEMA flood zone
- X (unshaded)
- Chance of flooding over 30 yrs
- 0.0%
- Est. flood insurance / yr
- $507 – $1,088
Fire risk 2/10 · Minimal
- Est. fire insurance / yr
- $947 – $1,759
Heat risk 8/10 · Major
- Hot days now (above 108°F)
- 5 days/yr
- Hot days in 30 yrs
- 14 days/yr
Wind risk 9/10 · Severe
- Chance of severe wind over 30 yrs
- 99.0%
Air-quality risk 2/10 · Minimal
- Unhealthy air days now
- 1 days/yr
- Unhealthy air days in 30 yrs
- 1 days/yr
Risk factors via First Street. Map © Google.
Why this score? — see what drove the B grade
The composite is a weighted blend of 9 inputs, each scored 0–100. Each bar is that input's sub-score; the figure is the points it added to the 100-point composite (weight × sub-score).
- Cash flow +30.0/30.0
- 1% rule +10.0/10.0
- DSCR +10.0/10.0
- ARV discount +7.5/15.0
- Schools +5.1/10.0
- Livability +4.1/5.0
- Condition / age +2.5/5.0
- Rent growth +2.1/5.0
- Appreciation +0.0/10.0
$119,900
🖨 Deal sheet (PDF) 📄 Offer letter ✓ Due diligence
Listing remarks MLS
Excellent opportunity to renovate or tear down existing home, as the property is in a prime location near the Sun rail station in Altamonte Springs with a new development in the surrounding area.
Key facts
- Oversized lot
- No hoa
- 6,534 sq ft lot
Tags
Property features AI
Finance
- Other: Property type: Residential, single family; Lot about 0.18 acres (0 to less than 1/4 acre)
- Financial info: No lease restrictions; Property is unfurnished
- HOA & community: No HOA/association
Exterior
- Parking: Carport with 2 spaces
- Utilities: Public water; Public sewer; Cable connected; Electricity connected; Sewer connected
- Home design: Single family residence; Residential property; One level; Front faces west; Zoned R-1
- Construction: Block, brick and stucco construction; Metal roof; Slab foundation; Built area and lot details available
- Exterior features: Private mailbox; Concrete and paved road access
Interior
- Kitchen: No appliances listed
- Bedrooms: 2 bedrooms
- Flooring: Other flooring
- Bathrooms: 1 full bathroom; 1 half bathroom
- Heating & cooling: Central heating; Central air conditioning
- Interior features: No interior features listed
- Laundry & utility: No laundry features
Neighborhood map
What this means for you Summary
Snapshot
- This is a 3-bed/2.0-bath single-family listed at $120k.
Deal economics
- At list price, monthly cash flow is $727 ($9k/yr) — positive.
- The deal already cash-flows at list — no discount required.
- Meets the 1% rule at list price ($2k rent vs $120k).
- Recommended offer: $113k (6.0% below list) — sets the bar for market timing.
- Cap rate 13.6% vs local median 3.4% in Altamonte Springs — top-decile yield for the area; either an underpriced asset or a hidden risk that comps aren't pricing in. Stress-test before assuming the spread holds.
Location & tenants
- Location reads 82/100 on livability (#62 in FL, #1,095 nationally) — a professional / high-income tenant draw. Strengths: commute A+, cost of living A+, housing A+; Watch: employment C-, crime D+, amenities D-.
- Seminole (suburban): math 57% / reading 61% proficiency, ranked #13 of 73 in FL (top 18%) — acceptable for families but not a draw, mixed tenant base, ~2y average lease.
- Zoned schools: Altamonte Elementary School (math 46% / reading 51%, grade D, #1,152 of 2,144 statewide, top 55%, 589 students, 78% FRL); Lyman High School (math 36% / reading 50%, grade F, #255 of 667 statewide, top 39%, 2,084 students, 53% FRL) — zoned schools average 66% FRL vs 38% district-wide (27 pts higher); higher-poverty schools than district average — tighter screening recommended.
- Zoned-school proficiency averages 46% at this address vs 59% district-wide (-13 pts) — the specific schools serving this property underperform the Seminole average; the district grade overstates school quality for this exact location.
- Market conditions: Rents soft (-1.5%/yr); 200 active listings in the ZIP; 26 comparable units currently listed for rent nearby; rentals at typical pace (median 18d on market — plan ~3-4 weeks tenant-placement turnaround); 1,979 units permitted in Seminole County in 2024 (1,191 in 5+ unit buildings).
Forward outlook
- Local home prices are declining (-3.0%/yr); year-one equity from $829 of loan paydown is wiped out by about $4k of value loss. Plan a longer hold.
- Seminole County population projected at +24% by 2050 — long-run rental-demand tailwind backs the buy-and-hold thesis.
- At projected returns (-3.0% appreciation + 0.0% rent growth), your $34k cash investment doubles in ~6 years — after that, you're playing with house money.
Negotiation context
- It's been on market 63 days — a 6% lower offer ($113k) is reasonable based on typical stale-listing flexibility.
- 4 sale attempts since 2y ago; this cycle's ask has dropped $15k (11%) from the opening price — seller is motivated, your offer sets the floor, not the list.
Risks & watch-outs
- Watch-outs: built in 1943 — expect roof / HVAC / electrical / plumbing capex.
- Climate carrying-cost: severe wind risk, 99% chance of damaging wind over 30y; extreme-heat days projected 5→14/yr by 2055 (HVAC capex compounding) — expect insurance premiums to compound above CPI over the hold.
Questions for the listing agent
- It's been on market 63 days. Have you received any prior offers? Is the seller open to a 6% concession, seller financing, or rate buy-down credit?
- Built in 1943 — when were the roof, HVAC, electrical panel, plumbing, and water heater last replaced?
- Why hasn't it sold? Are there any deal-killer items the seller is aware of (foundation, flood, title, zoning, code violations)?
- Is there a deadline driving the sale (1031 exchange, divorce, estate, relocation)? That informs how much negotiation room exists.
- Crime grade is D in this area — have there been break-ins, vandalism, or insurance claims at this property in the last 3 years? What carrier currently insures it and at what premium?
- What's the average days-on-market for RENTAL listings here right now (not sales)? A rising rental-DOM trend means longer vacancies and softer asking-rent achievability than the comps imply.
- What's the recent tenant-quality profile in this submarket — average credit score on applications, eviction rate, late-payment / NSF rate, and stable-employment percentage? A property-management company in the area should have these aggregated.
- How much new for-sale + rental construction is in the pipeline within 1–3 miles? Heavy new supply typically softens prices + rents 12–24 months out; constrained supply supports both.
Investment metrics
- 1% rule
- 1.62% ✓
- Cap rate
- 13.57%
- Cash-on-cash
- 26.00%
- DSCR
- 2.16
- GRM
- 5.1
CMA / ARV
- ARV (on-the-fly)
- $359,652
- Comps found
- 12
Show comp detail 12 sales within ~0.75 mi
| Address | Dist | Beds/Ba | Sqft | Sold | Price | $/sf | Match |
|---|---|---|---|---|---|---|---|
| 115 Leon St | 0.46mi | 3/2.0 | 1,451 (-1%) | 4mo | $385,000 | $265 | 74 |
| 303 Hermits Trl | 0.42mi | 3/2.0 | 1,557 (+6%) | 2mo | $469,000 | $301 | 68 |
| 614 Plum Ln | 0.50mi | 3/2.0 | 1,450 (-1%) | 11mo | $315,000 | $217 | 66 |
| 633 Hermits Trl | 0.44mi | 3/3.0 | 1,425 (-2%) | 11mo | $322,000 | $226 | 62 |
| 1002 Williams St | 0.25mi | 4/2.5 (+1) | 1,657 (+13%) | 2mo | $415,000 | $250 | 58 |
| 1171 Pine St | 0.44mi | 4/2.0 (+1) | 1,605 (+10%) | 2mo | $410,000 | $255 | 57 |
| 120 East St | 0.41mi | 3/2.0 | 1,631 (+12%) | 6mo | $230,000 | $141 | 57 |
| 124 Salem St | 0.53mi | 3/2.0 | 1,618 (+11%) | 5mo | $287,000 | $177 | 53 |
| 600 Plum Ln | 0.41mi | 4/1.5 (+1) | 1,334 (-9%) | 9mo | $280,000 | $210 | 52 |
| 730 Florida Blvd | 0.58mi | 3/2.0 | 1,664 (+14%) | 5mo | $392,500 | $236 | 46 |
| 507 Peach Tree Ln | 0.44mi | 4/2.0 (+1) | 1,300 (-11%) | 13mo | $320,000 | $246 | 45 |
| 1218 Depugh St | 0.57mi | 3/2.0 | 1,287 (-12%) | 14mo | $331,500 | $258 | 42 |
Match score weights: distance 35% · size 25% · config 20% · recency 20%. Top-matched comps best support the ARV.
Projected returns pro-forma
-3.0% appreciation · 0.0% rent growth · sell at horizon
- IRR
- 16.3%
- Equity multiple
- 1.63×
- Total profit
- $21,221
- Equity at exit
- $17,877
- IRR
- 22.6%
- Equity multiple
- 2.67×
- Total profit
- $56,194
- Equity at exit
- $10,367
Cash invested: $33,572 (down + closing). Projections, not guarantees.
Landlord ↔ Tenant lean methodology
- Overall (STATE)
- 87 Strongly Landlord-Friendly
- State Florida
- 87 Strongly Landlord-Friendly · R+3
- County
- — inherits STATE
- City
- — inherits STATE
ZIP-level market 32701
- Home prices YoY
- -34.4%
- Rents YoY
- -1.5%
- Active inventory
- 200
- Price-to-rent
- 5.1×
Monthly cashflow live
- Estimated rent
- $1,943 high interval (Pro) →
- Mortgage (P&I)
- −$629
- Tax from tax record
- −$129 /mo · $1,545/yr
- Insurance
- −$50
- HOA
- −$0
- Vacancy / Maint / Mgmt
- −$408
- Net cashflow
- $727
Break-even live
Sensitivity live
| Price | -10% $795 | -5% $761 | +0% $727 | +5% $693 | +10% $660 |
|---|---|---|---|---|---|
| Rent | -10% $574 | -5% $651 | +0% $727 | +5% $804 | +10% $881 |
| Rate | -1.0pp $788 | -0.5pp $758 | base $727 | +0.5pp $696 | +1.0pp $665 |
UW: 25.0% down · 7.5% · 30yr · 1.5% tax · 5.0% vac · 8.0% maint · 8.0% mgmt
Financing live
Cash to close
- Down payment
- $29,975
- Closing costs
- $3,597
- Reserves months
- —
- Total cash needed
- —
Loan-product check · same deal, 3 products live
Conventional
25% down · 7.5% · 30yr
- Down + closing
- —
- Monthly P&I
- —
- Monthly cashflow
- —
- DSCR
- —
- Eligible?
- —
Personal DTI + credit; lowest rate.
DSCR
20% down · 8.5% · 30yr
- Down + closing
- —
- Monthly P&I
- —
- Monthly cashflow
- —
- DSCR
- —
- Eligible?
- —
No personal income docs; deal must DSCR.
Hard money
10% down · 12.0% · 12mo
- Down + closing
- —
- Monthly P&I
- —
- Monthly cashflow
- —
- DSCR
- —
- Eligible?
- —
Short-term bridge; refi at stabilization.
Rent comps 26 comps
| Address | Beds | Baths | Sqft | Rent | $/sqft | DOM | Units | Dist |
|---|---|---|---|---|---|---|---|---|
| 1010 Merritt St Altamonte Springs, FL | 1.0–2.0 | 1.0 | 862 | $1,372 | $1.59 | 24d | 1 | 0.23mi |
| 815 2nd St Unit A Altamonte Springs, FL | 2.0 | 1.5 | 1008 | $1,600 | $1.59 | 13d | 1 | 0.28mi |
| 1227 Merritt St Altamonte Springs, FL | 3.0 | 2.0 | 1280 | $2,100 | $1.64 | 24d | 1 | 0.52mi |
| 738 Preble Ave Altamonte Springs, FL | 3.0 | 2.0 | 1414 | $2,190 | $1.55 | 24d | 1 | 0.61mi |
| 871 Darwin Dr Altamonte Springs, FL | 3.0 | 2.0 | 1170 | $2,200 | $1.88 | 3d | 1 | 0.85mi |
| 828 Orienta Ave Altamonte Springs, FL | 1.0–2.0 | 1.0–2.0 | 845 | $1,474 | $1.74 | 22d | 30 | 0.86mi |
| 308 N Cypress Way Casselberry, FL | 3.0 | 2.0 | 1546 | $2,300 | $1.49 | 21d | 1 | 0.96mi |
| 200 Maitland Ave Altamonte Springs, FL | 1.0–3.0 | 1.0–2.0 | 1115 | $1,898 | $1.70 | 24d | 3 | 0.97mi |
| 200 Maitland Ave Altamonte Springs, FL | 2.0 | 2.0 | 1216 | $1,825 | $1.50 | 12d | 1 | 0.97mi |
| 375 Palm Springs Dr Altamonte Springs, FL | 3.0 | 1.0–2.0 | 828 | $1,808 | $2.18 | 2d | 19 | 1.06mi |
| 1050 S Ronald Reagan Blvd Longwood, FL | 3.0 | 1.0–2.0 | 1014 | $3,217 | $3.17 | 5d | 44 | 1.14mi |
| 505 One Center Blvd Altamonte Springs, FL | 3.0 | 1.0–2.0 | 963 | $3,242 | $3.37 | 2d | 39 | 1.21mi |
| 602 Orange Dr #173 Altamonte Springs, FL | 2.0 | 2.0 | 1029 | $1,675 | $1.63 | 24d | 1 | 1.22mi |
| 400 Morrill Ter Casselberry, FL | 2.0 | 1.0 | 1000 | $1,550 | $1.55 | 5d | 1 | 1.26mi |
| 400 Sandpiper Ln Casselberry, FL | 1.0–3.0 | 1.0–2.0 | 937 | $2,080 | $2.22 | 3d | 11 | 1.26mi |
| 112 Highland Dr Fern Park, FL | 3.0 | 1.0 | 1192 | $1,885 | $1.58 | 24d | 1 | 1.27mi |
| 568 Orange Dr #48 Altamonte Springs, FL | 2.0 | 2.0 | 1029 | $1,545 | $1.50 | 15d | 1 | 1.27mi |
| 525 One Center Blvd Altamonte Springs, FL | 1.0–3.0 | 1.0–2.0 | 1082 | $2,568 | $2.37 | 2d | 17 | 1.31mi |
| 512 Orange Dr #30 Altamonte Springs, FL | 2.0 | 2.0 | 1002 | $1,645 | $1.64 | 18d | 1 | 1.33mi |
| 600 Cranes Way #204 Altamonte Springs, FL | 2.0 | 2.5 | 1482 | $2,500 | $1.69 | 24d | 1 | 1.37mi |
| 120 Valmora Dr Casselberry, FL | 3.0 | 2.0 | 1740 | $2,375 | $1.36 | 24d | 1 | 1.39mi |
| 375 Summer Cypress Cv Longwood, FL | 1.0–3.0 | 1.0–2.0 | 1012 | $2,468 | $2.44 | 2d | 22 | 1.40mi |
| 821 Pennsylvania Ave Altamonte Springs, FL | 3.0 | 2.0 | 1637 | $2,300 | $1.41 | 18d | 1 | 1.42mi |
| 524 Orange Dr #21 Altamonte Springs, FL | 2.0 | 2.0 | 1002 | $1,695 | $1.69 | 15d | 1 | 1.44mi |
| 534 Orange Dr #13 Altamonte Springs, FL | 2.0 | 2.0 | 1252 | $1,550 | $1.24 | 24d | 1 | 1.48mi |
| 530 Orange Dr #11 Altamonte Springs, FL | 2.0 | 2.0 | 1002 | $1,795 | $1.79 | 24d | 1 | 1.49mi |
Listing history 12 events
-
2026-05-22status Pending
-
2026-05-12price $119,900
-
2026-04-28status Active
-
2026-02-17status Pending
-
2026-01-09$134,900 Active
-
2024-05-10soldstatus $160,000 Closed 195-char remark
Show marketing remark (195 chars)
Excellent opportunity to renovate or tear down existing home, as the property is in a prime location near the Sun rail station in Altamonte Springs with a new development in the surrounding area.
-
2024-05-06soldstatus $160,000
-
2024-05-02status Pending 195-char remark
Show marketing remark (195 chars)
Excellent opportunity to renovate or tear down existing home, as the property is in a prime location near the Sun rail station in Altamonte Springs with a new development in the surrounding area.
-
2024-04-13status Active 195-char remark
Show marketing remark (195 chars)
Excellent opportunity to renovate or tear down existing home, as the property is in a prime location near the Sun rail station in Altamonte Springs with a new development in the surrounding area.
-
2024-03-13status Pending 195-char remark
Show marketing remark (195 chars)
Excellent opportunity to renovate or tear down existing home, as the property is in a prime location near the Sun rail station in Altamonte Springs with a new development in the surrounding area.
-
2024-03-03$235,000 Active 195-char remark
Show marketing remark (195 chars)
Excellent opportunity to renovate or tear down existing home, as the property is in a prime location near the Sun rail station in Altamonte Springs with a new development in the surrounding area.
-
2019-09-13soldstatus $100
ⓘ Source: listings_history table (triggers on properties + properties_extension) + one-shot
backfill from property_details.listing_events for pre-trigger history.
Tax reassessment forecast FL · Resets to sale price
- Current annual tax
- $1,545 · $129/mo
- Projected year-2 tax
- $1,545 · $129/mo
- Expected delta
- $0/yr ($0/mo · 0.0%)
ⓘ Screening estimate from a state-policy table — verify with the county assessor before closing.
Climate risk First Street
- Flood 1/10 Low FEMA zone X (unshaded) · 0% chance over 30 yrs
- Wildfire 2/10 Low
- Heat 8/10 Severe 5 d/yr ≥108°F today · 14 d/yr by 30 yrs out
- Wind 9/10 Extreme 99% chance of damaging wind over 30 yrs
- Air quality 2/10 Low 1 unhealthy d/yr today · 1 by 30 yrs out
Nearby sold comps map
Loading sold comps map…
Walkable amenities ~0.75 mi
Loading nearby amenities…
Taxation est. · year 1
- Rental income
- $23,314
- − Mortgage interest
- −$6,716
- − Property taxes
- −$1,545
- − Insurance
- −$600
- − Repairs & maintenance
- −$1,865
- − Management
- −$1,865
- − Depreciation
- −$3,488
- Taxable income
- $7,235
- Est. tax owed @ 24.0%
- −$1,736
- After-tax cash flow
- $6,992/yr
For passive investors: Depreciation is non-cash, so a rental often shows a tax loss while cash-flowing — sheltering income. Rental losses are passive: they offset passive income freely, and up to $25,000/yr can offset ordinary (W-2) income if you actively participate and your MAGI is under $100k (phasing out to $0 by $150k); unused losses carry forward. On sale, claimed depreciation is recaptured at up to 25%, and gains may owe capital-gains tax (a 1031 exchange can defer both). Figures are a year-1 estimate at your 24.0% rate — not tax advice; consult a CPA.
Schools (NCES district)
- District
- Seminole
- NCES district ID
- 1201710
- Math proficiency
- 57% ▼ -7.00%
- Reading proficiency
- 61% ▼ -1.00%
- Median HH income
- $58,478
- Composite
- 51.05/100
- National rank
- #1769
- State rank
- #13 of 73 in FL
Livability — Altamonte Springs
- Score
- 82/100
- State rank
- #62
- US rank
- #1095
Category grades
Schools grade is shown separately in the Schools card above.
Census & demographics
- County
- Seminole County · 436,154 people
- City population
- 62,497
- Metro
- Orlando-Kissimmee-Sanford, FL
- Population (ZIP)
- 24,592
- Household income
- $62,198
- Rent vs Own
- Severe rent burden
- 1447.0
Population outlook (Seminole County) Hauer SSP2
- Today (2025)
- 515,494 people
- By 2030
- 545,713 · +5.9%
- By 2040
- 598,068 · +16.0%
- By 2050
- 640,663 · +24.3%
- By 2075
- 724,461 · +40.5%
- By 2100
- 755,530 · +46.6%
Race, ethnicity, and origin ACS 2023
- Neighborhood character
- Diverse neighborhood (Simpson 0.67)
- Race & ethnicity
- White 46% Hispanic / Latino 28% Black 19% Two or more races 18% Asian 3%
- Hispanic origin (detail)
- Puerto Rican 16% Cuban 3% Dominican 1%
- Common ancestry
- Lithuanian 2% Romanian 2% Slovak 1%
- Foreign-born
- 15% · Canada, Jamaica
- Languages at home
- 75% English-only · Spanish 19% Other Indo-European 2% Russian/Polish/Slavic 1%
Political lean MEDSL · Seminole
- 2024 margin
- Toss-up / Even · D 47.6% · R 51.1% · Other 1.3%
- 2008→2024 swing
- -0.8pp no change · 2008: -2.8pp · 2024: -3.5pp
- All cycles
- 2024: R+3.5 2020: D+2.8 2016: R+1.6 2012: R+6.5 2008: R+2.8
Not yet ingested
- Civics
- —
Market trends
- HPI YoY
- ▼ -169.27%
- Current HPI
- 323.2703
- Rent YoY
- ▼ -1.52%
- Metro
- Orlando-Kissimmee-Sanford, FL
- State GDP YoY
- ▲ 3.28%
- F500 in state
- 36
Industry mix (Fortune 500 HQ in FL)
| Industry | F500 HQs | Revenue |
|---|---|---|
| Industrial Technology | 2 | $29B |
|
||
| Insurance | 2 | $17B |
|
||
| Retail | 1 | $60B |
|
||
| Technology Distribution | 1 | $58B |
|
||
| Homebuilding | 1 | $35B |
|
||
| Technology Manufacturing | 1 | $35B |
|
||
Price history
-49.0% since first listed12 events — show timeline
- 2026-05-22 Pending — Stellar MLS as Distributed by MLS Grid
- 2026-05-12 Price Changed $119,900 Stellar MLS as Distributed by MLS Grid
- 2026-04-28 Relisted — Stellar MLS as Distributed by MLS Grid
- 2026-02-17 Pending — Stellar MLS as Distributed by MLS Grid
- 2026-01-09 Listed $134,900 Stellar MLS as Distributed by MLS Grid
- 2024-05-10 Sold (MLS) $160,000 Stellar MLS as Distributed by MLS Grid
- 2024-05-06 Sold (Public Records) $160,000 Public Records
- 2024-05-02 Pending — Stellar MLS as Distributed by MLS Grid
- 2024-04-13 Relisted — Stellar MLS as Distributed by MLS Grid
- 2024-03-13 Pending — Stellar MLS as Distributed by MLS Grid
- 2024-03-03 Listed $235,000 Stellar MLS as Distributed by MLS Grid
- 2019-09-13 Sold (Public Records) $100 Public Records
Property tax history
+24.1%/yrLatest (2025): $1,545 · +7.7% YoY. Source: county tax records.
Cash-flow waterfall
monthlySold comps — $/sqft
last 12 mo · ≤1 miLoading sold comps…