 Multi-family
129 SE 5th St · Hallandale Beach, FL
Flood risk 7/10 · Major
- FEMA flood zone
- X (shaded)
- Chance of flooding over 30 yrs
- 0.71%
- Est. flood insurance / yr
- $507 – $1,088
Fire risk 1/10 · Minimal
- Est. fire insurance / yr
- $947 – $1,759
Heat risk 10/10 · Severe
- Hot days now (above 104°F)
- 7 days/yr
- Hot days in 30 yrs
- 29 days/yr
Wind risk 10/10 · Severe
- Chance of severe wind over 30 yrs
- 99.0%
Air-quality risk 2/10 · Minimal
- Unhealthy air days now
- 1 days/yr
- Unhealthy air days in 30 yrs
- 2 days/yr
Risk factors via First Street. Map © Google.
Why this score? — see what drove the C grade
The composite is a weighted blend of 9 inputs, each scored 0–100. Each bar is that input's sub-score; the figure is the points it added to the 100-point composite (weight × sub-score).
- Cash flow +23.5/30.0
- DSCR +7.5/10.0
- ARV discount +7.5/15.0
- 1% rule +6.1/10.0
- Schools +4.1/10.0
- Livability +4.0/5.0
- Condition / age +3.8/5.0
- Rent growth +2.6/5.0
- Appreciation +0.0/10.0
$3,200,000
🖨 Deal sheet (PDF) 📄 Offer letter ✓ Due diligence
Multi-family units
County records classify this as Multi-Family (2-4 Unit). Listing-text estimate: 1 unit. estimate disagrees with records
Listing remarks
This is 14 units in Hallandale Beach, an A+ rated location! Property consists of 10 efficiencies, 2-2/2s, and 2-1/1s. The property was run as an Assisted Living faciitly prior to 2019 and can still function as one with a license. The city will allow for up to 20 residents for an ALF. Its currenty functioning as regular rental property. 1st building: Consists of 10 efficiencies-rented at 1300/mo month to month (3200 sq ft) 2nd building: Consists of 2-2/2s-rented at 2300/mo each unit and 2-1/1s rented at 1800/mo each unit. (3200 sq ft) NOI=221,067 If you have or acquire an ALF license, you can get 4-5k per resident have up to 20 residents. Possible Pro Forma NOI running as an ALF=$545,090
Key facts
- New roofs
- A rated location
- 8 parking spots
Tags
Property features AI
Finance
- Financial info: Multiple rental units with existing income: a 2-bedroom unit currently rents for $2,300; two 1-bedroom units rent for $1,800 each; ten efficiency units generate $13,000 total; Some units are month-to-month; Rent may include electricity, gardener, sewer and water
Exterior
- Parking: Open parking with capacity for 8 vehicles
- Utilities: Public sewer; Cable not available
- Home design: Single-story building; Resale property; Shingle roof; Zoned CENTRAL
- Construction: Block construction; Shingle roof
- Exterior features: Less than quarter acre lot
Interior
- Kitchen: Each unit includes a kitchen
- Bedrooms: One 2-bedroom unit (includes kitchen and AC); Two 1-bedroom units (each includes kitchen and AC); Ten efficiency units (each includes kitchen and AC)
- Flooring: Ceramic tile
- Bathrooms: One 2-bath unit; Two 1-bath units; Ten 1-bath efficiency units
- Heating & cooling: Central heating; Central air conditioning plus wall/window AC units
- Interior features: Ceramic tile flooring; Central air conditioning and wall/window units
- Laundry & utility: Utilities: electricity, sewer, water (may be included with some rents)
Neighborhood map
What this means for you Summary
Snapshot
- This is a ?-bed/104.0-bath multifamily listed at $3.20M. Condition is rated good.
Deal economics
- At list price, monthly cash flow is $6k ($71k/yr) — positive.
- The deal already cash-flows at list — no discount required.
- Meets the 1% rule at list price ($36k rent vs $3.20M).
- Recommended offer: $3.10M (3.0% below list) — sets the bar for market timing.
- Cap rate 8.5% vs local median 5.2% in Hallandale Beach — top-decile yield for the area; either an underpriced asset or a hidden risk that comps aren't pricing in. Stress-test before assuming the spread holds.
Location & tenants
- Location reads 81/100 on livability (#86 in FL, #1,400 nationally) — a professional / high-income tenant draw. Strengths: commute A+, health & safety A+, crime B+; Watch: schools C-, employment D-.
- Broward (suburban): math 42% / reading 53% proficiency, ranked #46 of 73 in FL (top 63%) — families likely to look elsewhere, expect single-tenant / working-renter base with shorter leases.
- Market conditions: Rents flat; 1380 active listings in the ZIP; 1 comparable units currently listed for rent nearby; 2,111 units permitted in Broward County in 2024 (1,265 in 5+ unit buildings).
- At $35,532/mo this rent would consume 819% of the median local household income ($52k/yr) (locally 3293% of renters already pay >50% of income on rent) — very limited rent-growth headroom before tenants either downsize or default.
Forward outlook
- Local home prices are declining (-3.0%/yr); year-one equity from $22k of loan paydown is wiped out by about $96k of value loss. Plan a longer hold.
- Broward County population projected at +34% by 2050 — long-run rental-demand tailwind backs the buy-and-hold thesis.
Negotiation context
- It's been on market 48 days — a 3% lower offer ($3.10M) is reasonable based on typical stale-listing flexibility.
- 11 sale attempts since 8y ago with the ask held roughly flat each time — persistent listings suggest the price (not the market) is what's stuck; bring a comps-based counter.
- Current owner paid $1.06M; list at $3.20M implies a 202% gain — meaningful room to come down on a strong offer.
Risks & watch-outs
- Watch-outs: flood insurance adds $66/mo.
- Climate carrying-cost: major flood risk; severe wind risk, 99% chance of damaging wind over 30y; extreme-heat days projected 7→29/yr by 2055 (HVAC capex compounding) — expect insurance premiums to compound above CPI over the hold.
Questions for the listing agent
- It's been on market 48 days. Have you received any prior offers? Is the seller open to a 3% concession, seller financing, or rate buy-down credit?
- Built in 1977 — when were the roof, HVAC, electrical panel, plumbing, and water heater last replaced?
- What's the actual annual flood-insurance premium (NFIP or private), and is the property in a SFHA with mandatory coverage?
- Is there a deadline driving the sale (1031 exchange, divorce, estate, relocation)? That informs how much negotiation room exists.
- What's the average days-on-market for RENTAL listings here right now (not sales)? A rising rental-DOM trend means longer vacancies and softer asking-rent achievability than the comps imply.
- What's the recent tenant-quality profile in this submarket — average credit score on applications, eviction rate, late-payment / NSF rate, and stable-employment percentage? A property-management company in the area should have these aggregated.
- How much new apartment / multifamily construction is in the pipeline within 1–3 miles? Heavy new supply (>2% of stock underway) typically softens rents 12–24 months out; light construction supports rent growth.
Investment metrics
- 1% rule
- 1.11% ✓
- Cap rate
- 8.53%
- Cash-on-cash
- 7.98%
- DSCR
- 1.35
- GRM
- 7.5
CMA / ARV
No comps found within radius.
Projected returns pro-forma
-3.0% appreciation · 0.43% rent growth · sell at horizon
- IRR
- -7.2%
- Equity multiple
- 0.74×
- Total profit
- $-232,449
- Equity at exit
- $477,130
- IRR
- -1.2%
- Equity multiple
- 0.93×
- Total profit
- $-66,231
- Equity at exit
- $276,678
Cash invested: $896,000 (down + closing). Projections, not guarantees.
Landlord ↔ Tenant lean methodology
- Overall (STATE)
- 87 Strongly Landlord-Friendly
- State Florida
- 87 Strongly Landlord-Friendly · R+3
- County
- — inherits STATE
- City
- — inherits STATE
ZIP-level market 33009
- Rents YoY
- 0.4%
- Active inventory
- 1380
- Price-to-rent
- 106.9×
Monthly cashflow live
- Estimated rent
- $35,532 high interval (Pro) →
- Mortgage (P&I)
- −$16,781
- Tax est. 1.5%
- −$4,000 /mo · $48,000/yr
- Insurance
- −$1,333
- Flood insurance flood zone
- −$66 /mo · $798/yr
- HOA
- −$0
- Vacancy / Maint / Mgmt
- −$7,462
- Net cashflow
- $5,889
Break-even live
Sensitivity live
| Price | -10% $8,101 | -5% $6,995 | +0% $5,889 | +5% $4,784 | +10% $3,678 |
|---|---|---|---|---|---|
| Rent | -10% $3,082 | -5% $4,486 | +0% $5,889 | +5% $7,293 | +10% $8,696 |
| Rate | -1.0pp $7,501 | -0.5pp $6,703 | base $5,889 | +0.5pp $5,060 | +1.0pp $4,217 |
14-unit breakdown (identical units grouped — click to expand)
| Units | Beds | Baths | Est. rent |
|---|---|---|---|
| 12× units | 1 | 1 | $29,928 |
| #1 | 1 | 1 | $2,494 |
| #2 | 1 | 1 | $2,494 |
| #3 | 1 | 1 | $2,494 |
| #4 | 1 | 1 | $2,494 |
| #5 | 1 | 1 | $2,494 |
| #6 | 1 | 1 | $2,494 |
| #7 | 1 | 1 | $2,494 |
| #8 | 1 | 1 | $2,494 |
| #9 | 1 | 1 | $2,494 |
| #10 | 1 | 1 | $2,494 |
| #13 | 1 | 1 | $2,494 |
| #14 | 1 | 1 | $2,494 |
| 2× units | 2 | 2 | $5,606 |
| #11 | 2 | 2 | $2,803 |
| #12 | 2 | 2 | $2,803 |
| Total (14 units) | $35,532 | ||
UW: 25.0% down · 7.5% · 30yr · 1.5% tax · 5.0% vac · 8.0% maint · 8.0% mgmt
Financing live
Cash to close
- Down payment
- $800,000
- Closing costs
- $96,000
- Reserves months
- —
- Total cash needed
- —
Loan-product check · same deal, 3 products live
Conventional
25% down · 7.5% · 30yr
- Down + closing
- —
- Monthly P&I
- —
- Monthly cashflow
- —
- DSCR
- —
- Eligible?
- —
Personal DTI + credit; lowest rate.
DSCR
20% down · 8.5% · 30yr
- Down + closing
- —
- Monthly P&I
- —
- Monthly cashflow
- —
- DSCR
- —
- Eligible?
- —
No personal income docs; deal must DSCR.
Hard money
10% down · 12.0% · 12mo
- Down + closing
- —
- Monthly P&I
- —
- Monthly cashflow
- —
- DSCR
- —
- Eligible?
- —
Short-term bridge; refi at stabilization.
Rent comps 1 comps
| Address | Beds | Baths | Sqft | Rent | $/sqft | DOM | Units | Dist |
|---|---|---|---|---|---|---|---|---|
| 932 SW 10th St Unit 3 Hallandale Beach, FL | 3.0 | 2.5 | 11530 | $3,200 | $0.28 | 25d | 1 | 0.95mi |
Listing history 31 events
-
2026-05-12price $3,200,000
-
2026-04-21price $2,700,000
-
2026-04-10$3,200,000 Active
-
2026-03-14$1,300
-
2026-01-10historical
-
2026-01-06price $3,100,000
-
2025-12-10$3,200,000 Active
-
2025-07-07historical
-
2025-06-13price $2,990,000
-
2025-06-12status Active
-
2025-06-08historical
-
2025-03-07$3,000,000 Active
-
2024-11-25historical
-
2024-10-28$2,800,000 Active
-
2024-05-03historical
-
2024-03-29price $3,200,000
-
2024-03-29price $3,000,000
-
2024-03-29status Active
-
2024-03-28historical
-
2024-03-04price $3,200,000
-
2023-11-09price $3,300,000
-
2023-11-03$3,600,000 Active
-
2023-10-31status Pending
-
2023-10-27status Active
-
2023-10-18status Pending
-
2023-10-18historical
-
2023-08-18price $3,200,000
-
2023-07-26$3,600,000 Active
-
2019-02-26soldstatus $1,060,000 Sold
-
2019-01-28status Pending
-
2018-08-24$1,100,000 Active
ⓘ Source: listings_history table (triggers on properties + properties_extension) + one-shot
backfill from property_details.listing_events for pre-trigger history.
Climate risk First Street
- Flood 7/10 Severe FEMA zone X (shaded) · 71% chance over 30 yrs
- Wildfire 1/10 Low
- Heat 10/10 Extreme 7 d/yr ≥104°F today · 29 d/yr by 30 yrs out
- Wind 10/10 Extreme 99% chance of damaging wind over 30 yrs
- Air quality 2/10 Low 1 unhealthy d/yr today · 2 by 30 yrs out
Nearby sold comps map
Loading sold comps map…
Walkable amenities ~0.75 mi
Loading nearby amenities…
Taxation est. · year 1
- Rental income
- $426,384
- − Mortgage interest
- −$179,250
- − Property taxes
- −$48,000
- − Insurance
- −$16,798
- − Repairs & maintenance
- −$34,111
- − Management
- −$34,111
- − Depreciation
- −$93,091
- Taxable income
- $21,024
- Est. tax owed @ 24.0%
- −$5,046
- After-tax cash flow
- $65,626/yr
For passive investors: Depreciation is non-cash, so a rental often shows a tax loss while cash-flowing — sheltering income. Rental losses are passive: they offset passive income freely, and up to $25,000/yr can offset ordinary (W-2) income if you actively participate and your MAGI is under $100k (phasing out to $0 by $150k); unused losses carry forward. On sale, claimed depreciation is recaptured at up to 25%, and gains may owe capital-gains tax (a 1031 exchange can defer both). Figures are a year-1 estimate at your 24.0% rate — not tax advice; consult a CPA.
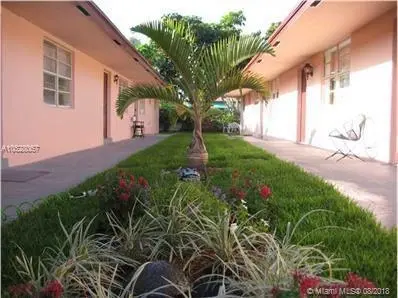
Condition & rehab AI · 11 photos
This multi-family property is in good condition with minimal repairs needed. Painting the exterior and maintaining the HVAC system would significantly enhance its curb appeal and rental value.
Value-add opportunities
- Both Paint exterior walls — Enhances curb appeal and property value
- Both Trim landscaping — Improves curb appeal and adds value
- Both Clean and maintain HVAC system — Ensures comfort and energy efficiency, attracting tenants
Renovation cost estimate screening
Value-add ROI direction
- Both Paint exterior walls — Enhances curb appeal and property value ↑
- Both Trim landscaping — Improves curb appeal and adds value ↑
- Both Clean and maintain HVAC system — Ensures comfort and energy efficiency, attracting tenants ↑
ⓘ Cost ranges are severity-bucket heuristics (US national rule-of-thumb). Get contractor quotes + a written scope before underwriting a rehab budget.
Schools (NCES district)
- District
- Broward
- NCES district ID
- 1200180
- Math proficiency
- 42% ▼ -18.00%
- Reading proficiency
- 53% ▼ -5.00%
- Median HH income
- $52,139
- Composite
- 40.88/100
- National rank
- #3621
- State rank
- #46 of 73 in FL
Livability — Hallandale Beach
- Score
- 81/100
- State rank
- #86
- US rank
- #1400
Category grades
Schools grade is shown separately in the Schools card above.
Census & demographics
- Census place
- Hallandale Beach, FL
- County
- Broward County · 1,963,430 people
- City population
- 44,021
- Metro
- Miami-Fort Lauderdale-Pompano Beach, FL
- Population (ZIP)
- 44,502
- Household income
- $52,079
- Rent vs Own
- Severe rent burden
- 3293.0
Population outlook (Broward County) Hauer SSP2
- Today (2025)
- 2,207,033 people
- By 2030
- 2,360,704 · +7.0%
- By 2040
- 2,661,208 · +20.6%
- By 2050
- 2,946,698 · +33.5%
- By 2075
- 3,602,273 · +63.2%
- By 2100
- 3,970,984 · +79.9%
Race, ethnicity, and origin ACS 2023
- Neighborhood character
- Diverse neighborhood (Simpson 0.67)
- Race & ethnicity
- Hispanic / Latino 39% White 39% Two or more races 24% Black 17% Asian 1%
- Hispanic origin (detail)
- Mexican 2% Puerto Rican 3% Cuban 9% Dominican 3% Salvadoran 2%
- Common ancestry
- Scotch-Irish 5% Hispanic 5% Subsaharan African 3%
- Foreign-born
- 51% · Canada, Jamaica, Dominican Republic
- Languages at home
- 38% English-only · Spanish 36% Russian/Polish/Slavic 12% French/Haitian/Cajun 7%
Political lean MEDSL · Broward
- 2024 margin
- D (+17.0) · D 58.0% · R 41.0%
- 2008→2024 swing
- -17.8pp toward R · 2008: 34.7pp · 2024: 17.0pp
- All cycles
- 2024: D+17.0 2020: D+29.8 2016: D+35.0 2012: D+34.9 2008: D+34.7
Not yet ingested
- Civics
- —
Market trends
- HPI YoY
- ▼ -299.13%
- Current HPI
- 329.9081
- Rent YoY
- ▲ 0.43%
- Metro
- Miami-Fort Lauderdale-Pompano Beach, FL
- State GDP YoY
- ▲ 3.28%
- F500 in state
- 36
Industry mix (Fortune 500 HQ in FL)
| Industry | F500 HQs | Revenue |
|---|---|---|
| Industrial Technology | 2 | $29B |
|
||
| Insurance | 2 | $17B |
|
||
| Retail | 1 | $60B |
|
||
| Technology Distribution | 1 | $58B |
|
||
| Homebuilding | 1 | $35B |
|
||
| Technology Manufacturing | 1 | $35B |
|
||
Price history
+190.9% since first listed31 events — show timeline
- 2026-05-12 Price Changed $3,200,000 MARMLS
- 2026-04-21 Price Changed $2,700,000 MARMLS
- 2026-04-10 Listed $3,200,000 MARMLS
- 2026-03-14 Listed for Rent $1,300 SHOWMOJO
- 2026-01-10 Listing Removed — MARMLS
- 2026-01-06 Price Changed $3,100,000 MARMLS
- 2025-12-10 Listed $3,200,000 MARMLS
- 2025-07-07 Listing Removed — MARMLS
- 2025-06-13 Price Changed $2,990,000 MARMLS
- 2025-06-12 Relisted — MARMLS
- 2025-06-08 Listing Removed — MARMLS
- 2025-03-07 Listed $3,000,000 MARMLS
- 2024-11-25 Listing Removed — MARMLS
- 2024-10-28 Listed $2,800,000 MARMLS
- 2024-05-03 Listing Removed — MARMLS
- 2024-03-29 Price Changed $3,200,000 MARMLS
- 2024-03-29 Price Changed $3,000,000 MARMLS
- 2024-03-29 Relisted — MARMLS
- 2024-03-28 Listing Removed — MARMLS
- 2024-03-04 Price Changed $3,200,000 MARMLS
- 2023-11-09 Price Changed $3,300,000 MARMLS
- 2023-11-03 Listed $3,600,000 MARMLS
- 2023-10-31 Pending — MARMLS
- 2023-10-27 Relisted — MARMLS
- 2023-10-18 Pending — MARMLS
- 2023-10-18 Listing Removed — MARMLS
- 2023-08-18 Price Changed $3,200,000 MARMLS
- 2023-07-26 Listed $3,600,000 MARMLS
- 2019-02-26 Sold (MLS) $1,060,000 MARMLS
- 2019-01-28 Pending — MARMLS
- 2018-08-24 Listed $1,100,000 MARMLS
Cash-flow waterfall
monthlySold comps — $/sqft
last 12 mo · ≤1 miLoading sold comps…