1280 Peachtree St #1504 · Atlanta, GA
Flood risk No data
- FEMA flood zone
- —
- Chance of flooding over 30 yrs
- —
- Est. flood insurance / yr
- —
Fire risk No data
- Est. fire insurance / yr
- —
Heat risk No data
- Hot days now (above threshold)
- —
- Hot days in 30 yrs
- —
Wind risk No data
- Chance of severe wind over 30 yrs
- —
Air-quality risk No data
- Unhealthy air days now
- —
- Unhealthy air days in 30 yrs
- —
Risk factors via First Street. Map © Google.
Why this score? — see what drove the D grade
The composite is a weighted blend of 9 inputs, each scored 0–100. Each bar is that input's sub-score; the figure is the points it added to the 100-point composite (weight × sub-score).
- Cash flow +15.0/30.0
- ARV discount +7.5/15.0
- 1% rule +5.4/10.0
- DSCR +4.6/10.0
- Livability +4.2/5.0
- Rent growth +2.8/5.0
- Schools +2.7/10.0
- Condition / age +2.5/5.0
- Appreciation +0.0/10.0
$221,000
🖨 Deal sheet 📄 Offer letter ✓ Due diligence
Listing remarks MLS
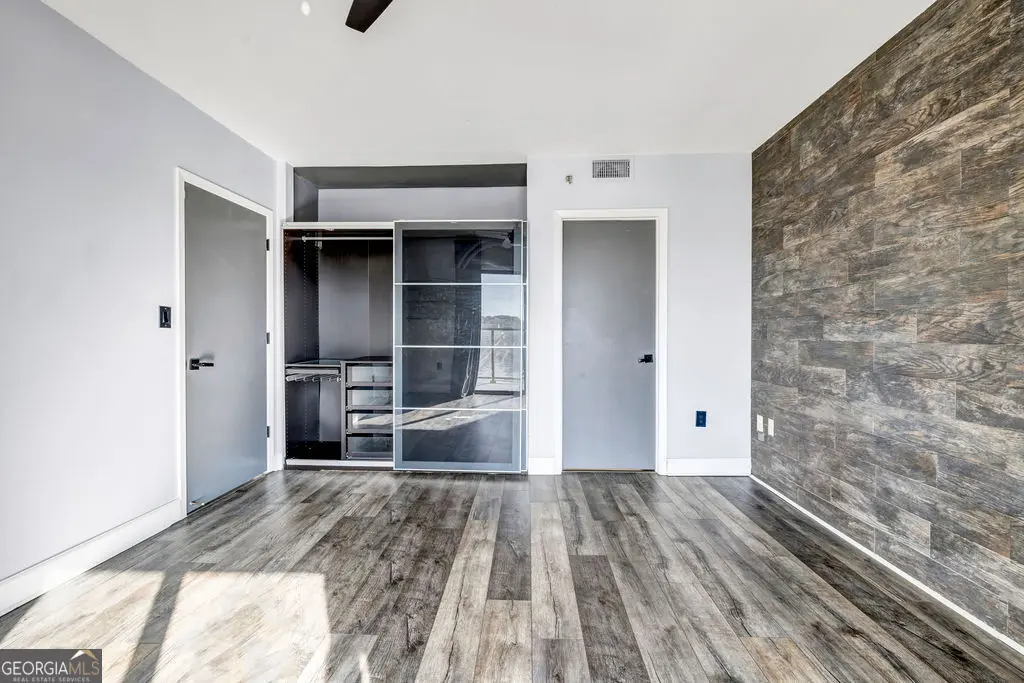
Modern 1 bedroom on the 15th floor with exhilarating southeast facing views. 1280 West is a luxury condo building in the heart of Midtown Atlanta's arts district. Convenient to 75/85 for easy access to downtown, Buckhead, Piedmont Park, Mercedes Benz stadium, the Beltline and more. Unit 1504 has been remodeled with an updated kitchen, bedroom and bathroom. Enjoy full amenities including rooftop pool and tennis courts, indoor basketball court, tennis courts, running track, racquetball, club room, billiards room, gym and business center. The 15 floor hallway/common area is currently being renovated with new paint and floors
Key facts
- Parking
- Built 1989
- Listed 13 days
Property features AI
Finance
- Other: Located on a city street; Directions: GPS; County: Fulton, GA
- HOA & community: Part of an association; Community clubhouse; Community fitness center; Business center; Near Beltline; Near public transport
Exterior
- Parking: Assigned parking (1 space)
- Utilities: Public water; Public sewer; Electricity available; Cable available; Phone available; Sewer available; Water available
- Home design: One-level unit; Fee simple ownership
- Construction: Stone and stucco construction; Composition roof; Resale condition
- Exterior features: Patio; Other exterior features
Interior
- Kitchen: Breakfast bar; Cabinets; Dishwasher; Disposal; Microwave; Refrigerator
- Bedrooms: One main-level bedroom; Bedroom with other features
- Flooring: Vinyl flooring; Wood flooring
- Bathrooms: One full bathroom (main level); Master bath: none
- Heating & cooling: Central heating (electric); Central air conditioning; Ceiling fan(s)
- Interior features: One common wall (attached unit); Other interior features
Neighborhood map
What this means for you Summary
Snapshot
- This is a 1-bed/1.0-bath condo listed at $221k.
Deal economics
- At list price, monthly cash flow is $69 ($830/yr) — positive.
- The deal already cash-flows at list — no discount required.
- Meets the 1% rule at list price ($2k rent vs $221k).
- Cap rate 6.7% vs local median 3.1% in Atlanta — top-decile yield for the area; either an underpriced asset or a hidden risk that comps aren't pricing in. Stress-test before assuming the spread holds.
Location & tenants
- Location reads 83/100 on livability (#6 in GA, #919 nationally) — a professional / high-income tenant draw. Strengths: amenities A+, commute A+, housing A+; Watch: cost of living C-.
- Atlanta Public Schools (urban): math 28% / reading 35% proficiency, ranked #80 of 174 in GA (top 46%) — families likely to look elsewhere, expect single-tenant / working-renter base with shorter leases; 71% free/reduced lunch — lower-income household profile, screen leases tightly.
- Zoned schools: David T Howard Middle School (math 58% / reading 63%, grade B+, #39 of 470 statewide, top 8%, 1,119 students, 19% FRL); Midtown High School (math 22% / reading 34%, grade F, #151 of 424 statewide, top 36%, 1,602 students, 19% FRL) — zoned schools average 19% FRL vs 71% district-wide (52 pts lower); this property's tenant base skews higher-income than the district average.
- Zoned-school proficiency averages 44% at this address vs 32% district-wide (+13 pts) — the actual schools serving this property are materially stronger than the Atlanta Public Schools average implies; a family-tenant draw the district grade alone would hide.
- Market conditions: Rents rising (+1.1%/yr); 317 active listings in the ZIP; 40 comparable units currently listed for rent nearby; rentals leasing fast (median 3d on market — plan ~1-2 weeks tenant-placement turnaround); solid renter incomes; 11,565 units permitted in Fulton County in 2024 (8,159 in 5+ unit buildings).
- This rent runs 32% of the median local income ($86k/yr) — at the standard rent-burdened threshold; future hikes will face affordability resistance.
Forward outlook
- Local home prices are declining (-3.0%/yr); year-one equity from $2k of loan paydown is wiped out by about $7k of value loss. Plan a longer hold.
- Fulton County population projected at +38% by 2050 — long-run rental-demand tailwind backs the buy-and-hold thesis.
Negotiation context
- Only 13 days on market — expect competitive offers; lowballing is unlikely to land.
- 9 sale attempts since 15y ago with the ask held roughly flat each time — persistent listings suggest the price (not the market) is what's stuck; bring a comps-based counter.
- Current owner paid $159k; 39% above their basis — modest negotiation headroom, anchor on the comps not their cost.
Questions for the listing agent
- What does the HOA fee cover, when was the last increase, and are there any pending special assessments or reserve-fund shortfalls?
- Any open or pending special assessments — roof, HVAC, plumbing, elevator, façade? What's the per-unit balance and payoff schedule, and is the seller paying it off at close or rolling it to the buyer?
- Is there a deadline driving the sale (1031 exchange, divorce, estate, relocation)? That informs how much negotiation room exists.
- The area grade is low — what's the realistic commute time and amenity access for the typical tenant pool here? Any planned neighborhood developments (good or bad) we should know about?
- What's the average days-on-market for RENTAL listings here right now (not sales)? A rising rental-DOM trend means longer vacancies and softer asking-rent achievability than the comps imply.
- What's the recent tenant-quality profile in this submarket — average credit score on applications, eviction rate, late-payment / NSF rate, and stable-employment percentage? A property-management company in the area should have these aggregated.
- How much new apartment / multifamily construction is in the pipeline within 1–3 miles? Heavy new supply (>2% of stock underway) typically softens rents 12–24 months out; light construction supports rent growth.
Investment metrics
- 1% rule
- 1.04% ✓
- Cap rate
- 6.67%
- Cash-on-cash
- 1.34%
- DSCR
- 1.06
- GRM
- 8.0
CMA / ARV
No comps found within radius.
Projected returns pro-forma
-3.0% appreciation · 1.12% rent growth · sell at horizon
- IRR
- -16.5%
- Equity multiple
- 0.43×
- Total profit
- $-35,491
- Equity at exit
- $32,952
- IRR
- -12.5%
- Equity multiple
- 0.33×
- Total profit
- $-41,359
- Equity at exit
- $19,108
Cash invested: $61,880 (down + closing). Projections, not guarantees.
Landlord ↔ Tenant lean methodology
- Overall (STATE)
- 90 Strongly Landlord-Friendly
- State Georgia
- 90 Strongly Landlord-Friendly · R+3
- County
- — inherits STATE
- City
- — inherits STATE
ZIP-level market 30308
- Rents YoY
- 1.1%
- Active inventory
- 317
- Price-to-rent
- 8.0×
Monthly cashflow live
- Estimated rent
- $2,289 high interval (Pro) →
- Mortgage (P&I)
- −$1,159
- Tax from tax record
- −$87 /mo · $1,050/yr
- Insurance
- −$92
- HOA est. from 26 same-building comps
- −$401
- Vacancy / Maint / Mgmt
- −$481
- Net cashflow
- $69
Break-even live
Sensitivity live
| Price | -10% $194 | -5% $132 | +0% $69 | +5% $7 | +10% $-56 |
|---|---|---|---|---|---|
| Rent | -10% $-112 | -5% $-21 | +0% $69 | +5% $160 | +10% $250 |
| Rate | -1.0pp $180 | -0.5pp $125 | base $69 | +0.5pp $12 | +1.0pp $-46 |
UW: 25.0% down · 7.5% · 30yr · 1.5% tax · 5.0% vac · 8.0% maint · 8.0% mgmt
Financing live
Cash to close
- Down payment
- $55,250
- Closing costs
- $6,630
- Reserves months
- —
- Total cash needed
- —
Loan-product check · same deal, 3 products live
Conventional
25% down · 7.5% · 30yr
- Down + closing
- —
- Monthly P&I
- —
- Monthly cashflow
- —
- DSCR
- —
- Eligible?
- —
Personal DTI + credit; lowest rate.
DSCR
20% down · 8.5% · 30yr
- Down + closing
- —
- Monthly P&I
- —
- Monthly cashflow
- —
- DSCR
- —
- Eligible?
- —
No personal income docs; deal must DSCR.
Hard money
10% down · 12.0% · 12mo
- Down + closing
- —
- Monthly P&I
- —
- Monthly cashflow
- —
- DSCR
- —
- Eligible?
- —
Short-term bridge; refi at stabilization.
Rent comps 40 comps
| Address | Beds | Baths | Sqft | Rent | $/sqft | DOM | Units | Dist |
|---|---|---|---|---|---|---|---|---|
| 1240 W Peachtree St NW Atlanta, GA | 2.0 | 1.0–2.0 | 1101 | $3,454 | $3.14 | 3d | 25 | 0.03mi |
| 1280 W Peachtree St NW Atlanta, GA | 1.0–2.0 | 1.0–2.0 | 826 | $1,800 | $2.18 | 24d | 2 | 0.03mi |
| 1270 Spring St NW Atlanta, GA | 1.0–2.0 | 1.0–2.0 | 987 | $1,683 | $1.71 | 3d | 17 | 0.07mi |
| 1230 W Peachtree St NW Atlanta, GA | 3.0 | 1.0–2.0 | 1066 | $3,088 | $2.90 | 1d | 51 | 0.07mi |
| 1301 Spring St NW Atlanta, GA | 2.0 | 1.0–2.0 | 939 | $3,112 | $3.31 | 2d | 39 | 0.08mi |
| 22 14th St NW Atlanta, GA | 3.0 | 1.0–2.0 | 1039 | $2,539 | $2.44 | 2d | 32 | 0.20mi |
| 1163 W Peachtree St NE Atlanta, GA | 2.0 | 1.0–2.0 | 1013 | $2,804 | $2.77 | 2d | 45 | 0.21mi |
| 1163 W Peachtree St NW Atlanta, GA | — | 1.0 | 628 | $1,871 | $2.98 | 3d | 1 | 0.23mi |
| 1140 Spring St NW Atlanta, GA | 3.0 | 1.0–2.0 | 1196 | $2,748 | $2.30 | 3d | 20 | 0.24mi |
| 1384 W Peachtree St NW Atlanta, GA | — | 1.0 | 384 | $895 | $2.33 | 24d | 1 | 0.24mi |
| 1382 Peachtree St NE Atlanta, GA | 3.0 | 1.0–2.0 | 919 | $2,719 | $2.96 | 1d | 28 | 0.25mi |
| 1400 W Peachtree St NW Atlanta, GA | 2.0 | 1.0–2.0 | 910 | $2,492 | $2.74 | 1d | 33 | 0.26mi |
| 1400 W Peachtree St NE Unit 813 Atlanta, GA | 1.0 | 1.0 | 652 | $1,986 | $3.05 | 15d | 1 | 0.26mi |
| 1405 Spring St NW Atlanta, GA | 3.0 | 1.0–2.0 | 920 | $3,366 | $3.66 | 2d | 41 | 0.28mi |
| 1136 Crescent Ave NE Atlanta, GA | 1.0 | 1.0 | 552 | $1,500 | $2.72 | 22d | 6 | 0.34mi |
| 1421 Peachtree St NE Unit 103-A Atlanta, GA | 1.0 | 1.0 | 625 | $1,700 | $2.72 | 5d | 1 | 0.35mi |
| 1441 Peachtree St NE Atlanta, GA | 3.0 | 1.0–2.0 | 961 | $2,676 | $2.78 | 3d | 93 | 0.38mi |
| 1074 Peachtree Walk NE Unit B222 Atlanta, GA | 1.0 | 1.0 | 730 | $1,850 | $2.53 | 8d | 1 | 0.39mi |
| 1074 Peachtree Walk NE Unit B222 Atlanta, GA | 1.0 | 1.0 | 730 | $1,900 | $2.60 | 18d | 1 | 0.39mi |
| 77 12th St NE Atlanta, GA | 2.0 | 1.0–2.0 | 941 | $2,613 | $2.78 | 2d | 22 | 0.39mi |
| 10 Tower St NW Atlanta, GA | 2.0 | 1.0–2.0 | 1014 | $3,512 | $3.46 | 1d | 194 | 0.42mi |
| 33 11th St NE Atlanta, GA | 2.0 | 1.0–2.0 | 1148 | $3,698 | $3.22 | 2d | 28 | 0.44mi |
| 1018 W Peachtree St NW Atlanta, GA | 3.0 | 1.0–3.0 | 1156 | $3,444 | $2.98 | 2d | 35 | 0.45mi |
| 1010 W Peachtree St NW Atlanta, GA | 2.0 | 1.0–2.0 | 865 | $2,620 | $3.03 | 2d | 26 | 0.48mi |
| 1000 Spring St NW Atlanta, GA | 3.0 | 1.0–3.0 | 1001 | $3,491 | $3.49 | 2d | 16 | 0.49mi |
| 222 14th St NE Atlanta, GA | 2.0 | 1.0–2.0 | 858 | $2,140 | $2.49 | 2d | 10 | 0.50mi |
| 199 14th St NE #201 Atlanta, GA | 1.0 | 1.0 | 625 | $1,695 | $2.71 | 24d | 1 | 0.50mi |
| 199 14th St NE Unit 209 Atlanta, GA | 1.0 | 1.0 | 750 | $1,495 | $1.99 | 24d | 1 | 0.51mi |
| 199 14th St NE #812 Atlanta, GA | — | 1.0 | 533 | $1,390 | $2.61 | 24d | 1 | 0.51mi |
| 1081 Juniper St NE Atlanta, GA | 3.0 | 1.0–3.5 | 1375 | $7,290 | $5.30 | 3d | 105 | 0.52mi |
| 195 13th St NE Atlanta, GA | 2.0 | 1.0–2.0 | 804 | $2,790 | $3.47 | 2d | 14 | 0.53mi |
| 1200 14th Pl NE Atlanta, GA | 1.0 | 1.0 | 650 | $1,595 | $2.45 | 24d | 1 | 0.56mi |
| 207 13th St NE Atlanta, GA | 3.0 | 1.0–3.5 | 1645 | $3,499 | $2.13 | 8d | 14 | 0.57mi |
| 208 12th St NE Unit 102 Atlanta, GA | 1.0 | 1.0 | 575 | $2,250 | $3.91 | 24d | 1 | 0.57mi |
| 208 12th St NE Unit 202 Atlanta, GA | 1.0 | 1.0 | 575 | $2,250 | $3.91 | 18d | 1 | 0.57mi |
| 1020 Piedmont Ave NE Atlanta, GA | 2.0 | 1.0–2.0 | 1005 | $2,950 | $2.93 | 2d | 23 | 0.63mi |
| 180 10th St NE Atlanta, GA | 1.0–3.0 | 1.0–3.0 | 1345 | $2,095 | $1.56 | 1d | 21 | 0.64mi |
| 915 W Peachtree St NW Atlanta, GA | 2.0 | 1.0–2.0 | 1262 | $4,122 | $3.27 | 2d | 23 | 0.64mi |
| 1220 Mecaslin St NW Atlanta, GA | 1.0–3.0 | 1.0–3.0 | 1060 | $1,563 | $1.47 | 2d | 19 | 0.66mi |
| 401 16th St NW Unit 1357A Atlanta, GA | 1.0 | 1.0 | 750 | $2,000 | $2.67 | 24d | 1 | 0.67mi |
HOA detail condo
- Monthly dues
- $0 · $0/yr
- Likely covers
- poolgym
- Assessments
- None detected in remarks — confirm with the listing agent.
Listing history 10 events
-
2026-06-18days on market $221,000 Active 13 DOM
-
2026-06-17days on market $221,000 Active 12 DOM
-
2026-06-16days on market $221,000 Active 11 DOM
-
2026-06-15days on market $221,000 Active 10 DOM
-
2026-06-13days on market $221,000 Active 8 DOM
-
2026-06-13days on market $221,000 Active 7 DOM
-
2026-06-09days on market $221,000 Active 4 DOM
-
2026-06-08days on market $221,000 Active 3 DOM
-
2026-06-07remarks 629-char remark
-
2026-06-07$221,000 Active 2 DOM
ⓘ Source: listings_history table (triggers on properties + properties_extension) + one-shot
backfill from property_details.listing_events for pre-trigger history.
Tax reassessment forecast GA · Resets to sale price
- Current annual tax
- $1,050 · $87/mo
- Projected year-2 tax
- $2,033 · $169/mo
- Expected delta
- +$984/yr (+$82/mo · 93.7%)
ⓘ Screening estimate from a state-policy table — verify with the county assessor before closing.
Nearby sold comps map
Loading sold comps map…
Walkable amenities ~0.75 mi
Loading nearby amenities…
Taxation est. · year 1
- Rental income
- $27,474
- − Mortgage interest
- −$12,379
- − Property taxes
- −$1,050
- − Insurance
- −$1,105
- − Repairs & maintenance
- −$2,198
- − Management
- −$2,198
- − HOA
- −$4,812
- − Depreciation
- −$6,429
- Taxable loss
- −$2,697
- Est. tax savings @ 24.0%
- +$647
- After-tax cash flow
- $1,478/yr
For passive investors: Depreciation is non-cash, so a rental often shows a tax loss while cash-flowing — sheltering income. Rental losses are passive: they offset passive income freely, and up to $25,000/yr can offset ordinary (W-2) income if you actively participate and your MAGI is under $100k (phasing out to $0 by $150k); unused losses carry forward. On sale, claimed depreciation is recaptured at up to 25%, and gains may owe capital-gains tax (a 1031 exchange can defer both). Figures are a year-1 estimate at your 24.0% rate — not tax advice; consult a CPA.
Schools (NCES district)
- District
- Atlanta Public Schools
- NCES district ID
- 1300120
- Math proficiency
- 28% ▼ -6.00%
- Reading proficiency
- 35% ▼ -2.00%
- Median HH income
- $48,306
- Composite
- 27.27/100
- National rank
- #7006
- State rank
- #80 of 174 in GA
Livability — Atlanta
- Score
- 83/100
- State rank
- #6
- US rank
- #919
Category grades
Schools grade is shown separately in the Schools card above.
Census & demographics
- Census place
- Atlanta, GA
- County
- Fulton County · 1,094,430 people
- City population
- 629,525
- Metro
- Atlanta-Sandy Springs-Alpharetta, GA
- Population (ZIP)
- 23,181
- Household income
- $85,693
- Rent vs Own
- Severe rent burden
- 2306.0
Population outlook (Fulton County) Hauer SSP2
- Today (2025)
- 1,203,707 people
- By 2030
- 1,299,706 · +8.0%
- By 2040
- 1,488,256 · +23.6%
- By 2050
- 1,664,580 · +38.3%
- By 2075
- 2,036,072 · +69.2%
- By 2100
- 2,222,402 · +84.6%
Race, ethnicity, and origin ACS 2023
- Neighborhood character
- Diverse neighborhood (Simpson 0.64)
- Race & ethnicity
- White 53% Black 26% Two or more races 10% Hispanic / Latino 7% Asian 7%
- Hispanic origin (detail)
- Mexican 1% Puerto Rican 2%
- Common ancestry
- Italian 4% Romanian 3% Lithuanian 2%
- Foreign-born
- 12% · Canada, South Korea, China
- Languages at home
- 85% English-only · Spanish 6% Other Indo-European 2% Other Asian/Pacific 2%
Political lean MEDSL · Fulton
- 2024 margin
- Solid D (+44.9) · D 71.9% · R 27.0% · Other 1.1%
- 2008→2024 swing
- +9.8pp toward D · 2008: 35.0pp · 2024: 44.9pp
- All cycles
- 2024: D+44.9 2020: D+46.4 2016: D+42.1 2012: D+29.6 2008: D+35.0
Not yet ingested
- Civics
- —
Market trends
- HPI YoY
- ▼ -293.30%
- Current HPI
- 159.9963
- Rent YoY
- ▲ 1.12%
- Metro
- Atlanta-Sandy Springs-Alpharetta, GA
- State GDP YoY
- ▲ 2.66%
- F500 in state
- 28
Industry mix (Fortune 500 HQ in GA)
| Industry | F500 HQs | Revenue |
|---|---|---|
| Paper / Packaging | 2 | $29B |
|
||
| Retail | 1 | $160B |
|
||
| Transportation / Logistics | 1 | $91B |
|
||
| Airlines | 1 | $62B |
|
||
| Consumer Goods | 1 | $47B |
|
||
| Utilities | 1 | $25B |
|
||
Price history
+176.6% since first listed35 events — show timeline
- 2026-06-05 Listed $221,000 FMLS
- 2026-06-05 Listed $221,000 GAMLS
- 2026-06-04 Coming Soon $221,000 GAMLS
- 2026-06-04 Coming Soon $221,000 FMLS
- 2025-06-04 Listing Removed — FMLS
- 2025-05-30 Relisted — FMLS
- 2025-03-31 Listing Removed — GAMLS
- 2025-01-25 Price Changed $219,000 GAMLS
- 2025-01-25 Price Changed $219,000 FMLS
- 2024-12-09 Price Changed $229,900 FMLS
- 2024-12-09 Price Changed $229,900 GAMLS
- 2024-10-14 Listed $239,900 GAMLS
- 2024-10-14 Listed $239,900 FMLS
- 2017-06-13 Sold (Public Records) $158,900 Public Records
- 2017-06-09 Sold (MLS) $158,900 FMLS
- 2017-05-12 Contingent — FMLS
- 2017-05-02 Listed $158,900 FMLS
- 2015-12-22 Sold (MLS) $94,900 GAMLS
- 2015-12-22 Sold (MLS) $94,900 FMLS
- 2015-12-04 Pending — GAMLS
- 2015-12-03 Pending — FMLS
- 2015-11-26 Price Changed $94,900 GAMLS
- 2015-11-26 Price Changed $94,900 FMLS
- 2015-11-24 Price Changed $107,500 GAMLS
- 2015-11-23 Price Changed $107,500 FMLS
- 2015-10-28 Price Changed $112,990 GAMLS
- 2015-10-28 Price Changed $112,990 FMLS
- 2015-10-01 Price Changed $118,800 GAMLS
- 2015-10-01 Price Changed $118,800 FMLS
- 2015-09-05 Listed $124,900 GAMLS
- 2015-09-05 Listed $124,900 FMLS
- 2013-03-27 Listing Removed — GAMLS
- 2012-09-12 Contingent — GAMLS
- 2012-03-29 Price Changed $41,900 GAMLS
- 2011-09-01 Listed $79,900 GAMLS
Property tax history
-5.0%/yrLatest (2025): $1,050 · -4.0% YoY. Source: county tax records.
Cash-flow waterfall
monthlySold comps — $/sqft
last 12 mo · ≤1 miLoading sold comps…