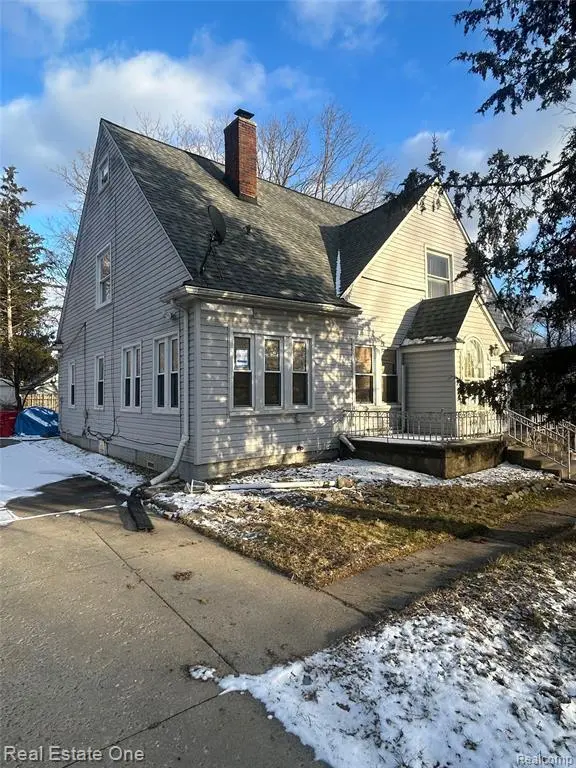
21130 Seminole St · Southfield, MI
Flood risk 1/10 · Minimal
- FEMA flood zone
- X (unshaded)
- Chance of flooding over 30 yrs
- 0.0%
- Est. flood insurance / yr
- $473 – $860
Fire risk 1/10 · Minimal
- Est. fire insurance / yr
- $784 – $1,456
Heat risk 3/10 · Minor
- Hot days now (above 97°F)
- 7 days/yr
- Hot days in 30 yrs
- 15 days/yr
Wind risk 2/10 · Minimal
- Chance of severe wind over 30 yrs
- —
Air-quality risk 3/10 · Minor
- Unhealthy air days now
- 2 days/yr
- Unhealthy air days in 30 yrs
- 3 days/yr
Risk factors via First Street. Map © Google.
Why this score? — see what drove the B grade
The composite is a weighted blend of 9 inputs, each scored 0–100. Each bar is that input's sub-score; the figure is the points it added to the 100-point composite (weight × sub-score).
- Cash flow +30.0/30.0
- ARV discount +15.0/15.0
- DSCR +10.0/10.0
- 1% rule +9.4/10.0
- Livability +3.6/5.0
- Condition / age +2.5/5.0
- Schools +2.4/10.0
- Rent growth +2.0/5.0
- Appreciation +0.0/10.0
$135,000
🖨 Deal sheet 📄 Offer letter ✓ Due diligence
Listing remarks MLS
Investor Special – Bring Your Vision & Build Instant Equity Tons of sweat equity opportunity in this spacious 5-bedroom, 2 full bath home located in a quiet, tucked-away Southfield neighborhood. This property has been taken down to the studs, offering a true blank canvas for a full custom renovation. Large footprint with endless layout possibilities - perfect for a high-end flip, long-term rental, or owner-occupant looking to design their dream home from the ground up. Exterior features vinyl siding and sits on a nice-sized lot, giving you a strong starting point for your project. Solid location with convenient access to major freeways, shopping, and amenities - making this an ideal investment play in a stable area. Full rehab required. Priced for condition. Sold as-is. Serious investors only - bring your contractor and your vision
Key facts
- Nice-sized lot
- Custom renovation
- Vinyl siding
Tags
Property features AI
Exterior
- Parking: No garage
- Utilities: Public water; Public sewer; Water and sewer available
- Home design: Single-family residence; Two levels; Ground-level entry with steps
- Construction: Aluminum siding; Brick/mortar foundation
- Exterior features: Paved road access; Lot dimensions approximately 40 x 138 (0.39 acre)
Interior
- Bedrooms: Total rooms: 9
- Bathrooms: 2 full bathrooms
- Heating & cooling: Forced air heating (natural gas); No central air conditioning
- Interior features: Wood-burning fireplace in the living room; Unfinished basement
Neighborhood map
What this means for you Summary
Snapshot
- This is a 3-bed/2.0-bath single-family listed at $135k.
Deal economics
- At list price, monthly cash flow is $600 ($7k/yr) — positive.
- The deal already cash-flows at list — no discount required.
- Meets the 1% rule at list price ($2k rent vs $135k).
- Recommended offer: $133k (1.5% below list) — sets the bar for market timing.
- Cap rate 11.6% vs local median 4.4% in Southfield — top-decile yield for the area; either an underpriced asset or a hidden risk that comps aren't pricing in. Stress-test before assuming the spread holds.
Location & tenants
- Location reads 72/100 on livability (#248 in MI) — a middle-class / working-renter tenant base. Strengths: commute A+, cost of living A+, housing A+; Watch: schools D, health & safety D, crime F.
- Southfield Public School District (urban): math 17% / reading 37% proficiency, ranked #392 of 540 in MI (top 73%) — low school quality limits family demand, transient renter base, plan for 1-2y turnover.
- Market conditions: Rents soft (-2.0%/yr); 80 active listings in the ZIP; 2 comparable units currently listed for rent nearby; 2,614 units permitted in Oakland County in 2024 (721 in 5+ unit buildings).
- This rent runs 38% of the median local income ($61k/yr) — at the standard rent-burdened threshold; future hikes will face affordability resistance.
Forward outlook
- Local home prices are declining (-3.0%/yr); year-one equity from $933 of loan paydown is wiped out by about $4k of value loss. Plan a longer hold.
- Oakland County population projected at +10% by 2050 — modest demand growth; plan on rents tracking national, not racing it.
- At projected returns (-3.0% appreciation + 0.0% rent growth), your $38k cash investment doubles in ~9 years — after that, you're playing with house money.
Negotiation context
- It's been on market 28 days — a 2% lower offer ($133k) is reasonable based on typical stale-listing flexibility.
- 12 sale attempts since 28y ago with the ask held roughly flat each time — persistent listings suggest the price (not the market) is what's stuck; bring a comps-based counter.
Risks & watch-outs
- Watch-outs: built in 1928 — expect roof / HVAC / electrical / plumbing capex.
Questions for the listing agent
- Built in 1928 — when were the roof, HVAC, electrical panel, plumbing, and water heater last replaced?
- Is there a deadline driving the sale (1031 exchange, divorce, estate, relocation)? That informs how much negotiation room exists.
- Schools are D-rated, which usually means shorter tenancies and higher turnover. Who's the typical renter profile here, and what's been the actual vacancy rate?
- Crime grade is F in this area — have there been break-ins, vandalism, or insurance claims at this property in the last 3 years? What carrier currently insures it and at what premium?
- What's the average days-on-market for RENTAL listings here right now (not sales)? A rising rental-DOM trend means longer vacancies and softer asking-rent achievability than the comps imply.
- What's the recent tenant-quality profile in this submarket — average credit score on applications, eviction rate, late-payment / NSF rate, and stable-employment percentage? A property-management company in the area should have these aggregated.
- How much new for-sale + rental construction is in the pipeline within 1–3 miles? Heavy new supply typically softens prices + rents 12–24 months out; constrained supply supports both.
Investment metrics
- 1% rule
- 1.44% ✓
- Cap rate
- 11.63%
- Cash-on-cash
- 19.06%
- DSCR
- 1.85
- GRM
- 5.8
CMA / ARV
- ARV (median comp)
- $244,512
- List price
- $135,000
- Delta
- -44.79%
- Verdict
- UNDERPRICED
- Comps
- 20 within 1.0 mi
Show comp detail 12 sales within ~0.75 mi
| Address | Dist | Beds/Ba | Sqft | Sold | Price | $/sf | Match |
|---|---|---|---|---|---|---|---|
| 20508 Fox | 0.48mi | 3/2.0 | 2,068 (+1%) | 0mo | $215,000 | $104 | 76 |
| 20905 Van Buren St | 0.32mi | 3/2.0 | 2,200 (+7%) | 1mo | $286,500 | $130 | 72 |
| 21885 Maplewood Dr | 0.66mi | 2/2.0 (-1) | 2,099 (+2%) | 4mo | $217,000 | $103 | 57 |
| 20548 Gaylord | 0.50mi | 2/2.0 (-1) | 1,904 (-7%) | 4mo | $161,000 | $85 | 57 |
| 21105 Oxford Ave | 0.52mi | 3/1.5 | 1,850 (-10%) | 1mo | $250,000 | $135 | 56 |
| 21850 Ontaga St | 0.44mi | 3/1.5 | 2,294 (+12%) | 2mo | $290,000 | $126 | 56 |
| 21305 Oxford Ave | 0.52mi | 3/2.5 | 1,870 (-9%) | 5mo | $283,500 | $152 | 55 |
| 22091 Malden St | 0.64mi | 3/2.5 | 1,880 (-8%) | 3mo | $310,000 | $165 | 51 |
| 22035 Inkster Rd Rd | 0.51mi | 3/2.0 | 1,811 (-12%) | 7mo | $240,000 | $133 | 51 |
| 20533 Angling Rd | 0.64mi | 3/2.5 | 1,843 (-10%) | 3mo | $418,000 | $227 | 49 |
| 21221 Hamilton Ave | 0.75mi | 2/3.0 (-1) | 2,175 (+6%) | 6mo | $271,500 | $125 | 40 |
| 20540 Woodworth Ave | 0.72mi | 3/1.0 | 1,800 (-12%) | 5mo | $175,000 | $97 | 37 |
Match score weights: distance 35% · size 25% · config 20% · recency 20%. Top-matched comps best support the ARV.
Projected returns pro-forma
-3.0% appreciation · 0.0% rent growth · sell at horizon
- IRR
- 7.5%
- Equity multiple
- 1.28×
- Total profit
- $10,706
- Equity at exit
- $20,129
- IRR
- 14.0%
- Equity multiple
- 1.97×
- Total profit
- $36,700
- Equity at exit
- $11,672
Cash invested: $37,800 (down + closing). Projections, not guarantees.
Landlord ↔ Tenant lean methodology
- Overall (STATE)
- 62 Landlord-Friendly
- State Michigan
- 62 Landlord-Friendly · EVEN
- County
- — inherits STATE
- City
- — inherits STATE
ZIP-level market 48033
- Rents YoY
- -2.0%
- Active inventory
- 80
- Price-to-rent
- 5.8×
Monthly cashflow live
- Estimated rent
- $1,941 medium interval (Pro) →
- Mortgage (P&I)
- −$708
- Tax est. 1.5%
- −$169 /mo · $2,025/yr
- Insurance
- −$56
- HOA
- −$0
- Vacancy / Maint / Mgmt
- −$408
- Net cashflow
- $600
Break-even live
UW: 25.0% down · 7.5% · 30yr · 1.5% tax · 5.0% vac · 8.0% maint · 8.0% mgmt
Financing live
Cash to close
- Down payment
- $33,750
- Closing costs
- $4,050
- Reserves months
- —
- Total cash needed
- —
Loan-product check · same deal, 3 products live
Conventional
25% down · 7.5% · 30yr
- Down + closing
- —
- Monthly P&I
- —
- Monthly cashflow
- —
- DSCR
- —
- Eligible?
- —
Personal DTI + credit; lowest rate.
DSCR
20% down · 8.5% · 30yr
- Down + closing
- —
- Monthly P&I
- —
- Monthly cashflow
- —
- DSCR
- —
- Eligible?
- —
No personal income docs; deal must DSCR.
Hard money
10% down · 12.0% · 12mo
- Down + closing
- —
- Monthly P&I
- —
- Monthly cashflow
- —
- DSCR
- —
- Eligible?
- —
Short-term bridge; refi at stabilization.
Rent comps 2 comps
| Address | Beds | Baths | Sqft | Rent | $/sqft | DOM | Units | Dist |
|---|---|---|---|---|---|---|---|---|
| 20797 Negaunee St Southfield, MI | 4.0 | 2.0 | 1640 | $2,000 | $1.22 | 20d | 1 | 0.17mi |
| 20862 Kenwood St Farmington Hills, MI | 3.0 | 1.5 | 1700 | $1,995 | $1.17 | 44d | 1 | 1.22mi |
Listing history 33 events
-
2026-04-28$135,000 Active 867-char remark
Show marketing remark (868 chars)
Investor Special – Bring Your Vision & Build Instant Equity Tons of sweat equity opportunity in this spacious 5-bedroom, 2 full bath home located in a quiet, tucked-away Southfield neighborhood. This property has been taken down to the studs, offering a true blank canvas for a full custom renovation. Large footprint with endless layout possibilities - perfect for a high-end flip, long-term rental, or owner-occupant looking to design their dream home from the ground up. Exterior features vinyl siding and sits on a nice-sized lot, giving you a strong starting point for your project. Solid location with convenient access to major freeways, shopping, and amenities - making this an ideal investment play in a stable area. Full rehab required. Priced for condition. Sold as-is. Serious investors only - bring your contractor and your vision
-
2026-04-28$135,000 Active 868-char remark
Show marketing remark (868 chars)
Investor Special – Bring Your Vision & Build Instant Equity Tons of sweat equity opportunity in this spacious 5-bedroom, 2 full bath home located in a quiet, tucked-away Southfield neighborhood. This property has been taken down to the studs, offering a true blank canvas for a full custom renovation. Large footprint with endless layout possibilities - perfect for a high-end flip, long-term rental, or owner-occupant looking to design their dream home from the ground up. Exterior features vinyl siding and sits on a nice-sized lot, giving you a strong starting point for your project. Solid location with convenient access to major freeways, shopping, and amenities - making this an ideal investment play in a stable area. Full rehab required. Priced for condition. Sold as-is. Serious investors only - bring your contractor and your vision
-
2021-03-18soldstatus $105,000
-
2020-10-26soldstatus $105,000 Sold
Show marketing remark (270 chars)
Remarkable find is this 6 bedroom, first floor master with bath, 4 bedrooms on the 2nd floor and 1 on the upper level, total SIX (6). Two (2) full and two (2) half baths. Attention investors and 203K buyers. So much home all on a double lot. Please no same day showings.
-
2020-10-26soldstatus $105,000 Closed
Show marketing remark (270 chars)
Remarkable find is this 6 bedroom, first floor master with bath, 4 bedrooms on the 2nd floor and 1 on the upper level, total SIX (6). Two (2) full and two (2) half baths. Attention investors and 203K buyers. So much home all on a double lot. Please no same day showings.
-
2020-07-12status Pending
Show marketing remark (270 chars)
Remarkable find is this 6 bedroom, first floor master with bath, 4 bedrooms on the 2nd floor and 1 on the upper level, total SIX (6). Two (2) full and two (2) half baths. Attention investors and 203K buyers. So much home all on a double lot. Please no same day showings.
-
2020-02-21price $119,000
-
2020-02-20price $119,000
Show marketing remark (270 chars)
Remarkable find is this 6 bedroom, first floor master with bath, 4 bedrooms on the 2nd floor and 1 on the upper level, total SIX (6). Two (2) full and two (2) half baths. Attention investors and 203K buyers. So much home all on a double lot. Please no same day showings.
-
2019-07-08$122,000 Active
Show marketing remark (270 chars)
Remarkable find is this 6 bedroom, first floor master with bath, 4 bedrooms on the 2nd floor and 1 on the upper level, total SIX (6). Two (2) full and two (2) half baths. Attention investors and 203K buyers. So much home all on a double lot. Please no same day showings.
-
2014-01-23soldstatus $66,000
-
2014-01-23soldstatus $66,000
-
2013-09-16historical
-
2013-04-26$67,900
-
2013-04-26$67,900
-
2013-03-07soldstatus $169,848
-
2004-02-02soldstatus $52,500
-
2004-01-24soldstatus $225,000
-
2001-09-17historical
-
2001-01-17$189,900
-
2000-12-31historical
-
2000-09-21$159,900
-
2000-09-20historical
-
2000-04-20$159,900
-
2000-04-01historical
-
1999-10-01historical
-
1999-08-17$149,900
-
1999-05-01$149,900
-
1999-04-30historical
-
1998-08-31$154,900
-
1995-05-09soldstatus $78,124
-
1992-09-17soldstatus $74,000
ⓘ Source: listings_history table (triggers on properties + properties_extension) + one-shot
backfill from property_details.listing_events for pre-trigger history.
Climate risk First Street
- Flood 1/10 Low FEMA zone X (unshaded) · 0% chance over 30 yrs
- Wildfire 1/10 Low
- Heat 3/10 Moderate 7 d/yr ≥97°F today · 15 d/yr by 30 yrs out
- Wind 2/10 Low
- Air quality 3/10 Moderate 2 unhealthy d/yr today · 3 by 30 yrs out
Nearby sold comps map
Loading sold comps map…
Walkable amenities ~0.75 mi
Loading nearby amenities…
Taxation est. · year 1
- Rental income
- $23,292
- − Mortgage interest
- −$7,562
- − Property taxes
- −$2,025
- − Insurance
- −$675
- − Repairs & maintenance
- −$1,863
- − Management
- −$1,863
- − Depreciation
- −$3,927
- Taxable income
- $5,376
- Est. tax owed @ 24.0%
- −$1,290
- After-tax cash flow
- $5,915/yr
For passive investors: Depreciation is non-cash, so a rental often shows a tax loss while cash-flowing — sheltering income. Rental losses are passive: they offset passive income freely, and up to $25,000/yr can offset ordinary (W-2) income if you actively participate and your MAGI is under $100k (phasing out to $0 by $150k); unused losses carry forward. On sale, claimed depreciation is recaptured at up to 25%, and gains may owe capital-gains tax (a 1031 exchange can defer both). Figures are a year-1 estimate at your 24.0% rate — not tax advice; consult a CPA.
Schools (NCES district)
- District
- Southfield Public School District
- NCES district ID
- 2632310
- Math proficiency
- 17% ▼ -3.00%
- Reading proficiency
- 37% ▲ 1.00%
- Median HH income
- $51,400
- Composite
- 23.77/100
- National rank
- #7814
- State rank
- #392 of 540 in MI
Livability — Southfield
- Score
- 72/100
- State rank
- #248
- US rank
- #6175
Category grades
Schools grade is shown separately in the Schools card above.
Census & demographics
- Census place
- Southfield, MI
- County
- Oakland County · 1,009,092 people
- City population
- 54,914
- Metro
- Detroit-Warren-Dearborn, MI
- Population (ZIP)
- 17,277
- Household income
- $61,016
- Rent vs Own
- Severe rent burden
- 1166.0
Population outlook (Oakland County) Hauer SSP2
- Today (2025)
- 1,335,747 people
- By 2030
- 1,375,100 · +2.9%
- By 2040
- 1,435,385 · +7.5%
- By 2050
- 1,469,250 · +10.0%
- By 2075
- 1,531,946 · +14.7%
- By 2100
- 1,450,485 · +8.6%
Race, ethnicity, and origin ACS 2023
- Neighborhood character
- Predominantly Black (68%)
- Race & ethnicity
- Black 68% White 24% Two or more races 6% Asian 2% Hispanic / Latino 1%
- Common ancestry
- Romanian 3% Scotch-Irish 1% Slovak 1%
- Foreign-born
- 6% · Canada
- Languages at home
- 92% English-only · Spanish 1% Arabic 1% Russian/Polish/Slavic 1%
Political lean MEDSL · Oakland
- 2024 margin
- D (+10.6) · D 54.4% · R 43.8% · Other 1.9%
- 2008→2024 swing
- -3.9pp toward R · 2008: 14.5pp · 2024: 10.6pp
- All cycles
- 2024: D+10.6 2020: D+14.1 2016: D+8.1 2012: D+8.1 2008: D+14.5
Not yet ingested
- Civics
- —
Market trends
- HPI YoY
- ▼ -175.44%
- Current HPI
- 187.5011
- Rent YoY
- ▼ -1.96%
- Metro
- Detroit-Warren-Dearborn, MI
- State GDP YoY
- ▲ 1.37%
- F500 in state
- 28
Industry mix (Fortune 500 HQ in MI)
| Industry | F500 HQs | Revenue |
|---|---|---|
| Automotive Parts | 3 | $48B |
|
||
| Automotive | 2 | $372B |
|
||
| Chemicals | 1 | $45B |
|
||
| Automotive Retail | 1 | $29B |
|
||
| Healthcare / Medical Devices | 1 | $23B |
|
||
| Automotive Technology | 1 | $20B |
|
||
Price history
+82.4% since first listed37 events — show timeline
- 2026-05-26 Pending — MiRealSource-MiMLS
- 2026-05-26 Pending — REALCOMP
- 2026-05-26 Sold (MLS) $135,000 REALCOMP
- 2026-05-26 Sold (MLS) $135,000 MiRealSource-MiMLS
- 2026-04-28 Listed $135,000 REALCOMP
- 2026-04-28 Listed $135,000 MiRealSource-MiMLS
- 2021-03-18 Sold (Public Records) $105,000 Public Records
- 2020-10-26 Sold (MLS) $105,000 MiRealSource-MiMLS
- 2020-10-26 Sold (MLS) $105,000 REALCOMP
- 2020-07-12 Pending — MiRealSource-MiMLS
- 2020-07-12 Pending — REALCOMP
- 2020-02-21 Price Changed $119,000 MiRealSource-MiMLS
- 2020-02-20 Price Changed $119,000 REALCOMP
- 2019-07-08 Listed $122,000 MiRealSource-MiMLS
- 2019-07-08 Listed $122,000 REALCOMP
- 2014-01-23 Sold (MLS) $66,000 REALCOMP
- 2014-01-23 Sold (MLS) $66,000 MiRealSource-MiMLS
- 2013-09-16 Listing Removed — MiRealSource-MiMLS
- 2013-04-26 Listed $67,900 REALCOMP
- 2013-04-26 Listed $67,900 MiRealSource-MiMLS
- 2013-03-07 Sold (Public Records) $169,848 Public Records
- 2004-02-02 Sold (Public Records) $52,500 Public Records
- 2004-01-24 Sold (Public Records) $225,000 Public Records
- 2001-09-17 Listing Removed — REALCOMP
- 2001-01-17 Listed $189,900 REALCOMP
- 2000-12-31 Listing Removed — REALCOMP
- 2000-09-21 Listed $159,900 REALCOMP
- 2000-09-20 Listing Removed — REALCOMP
- 2000-04-20 Listed $159,900 REALCOMP
- 2000-04-01 Listing Removed — REALCOMP
- 1999-10-01 Listing Removed — REALCOMP
- 1999-08-17 Listed $149,900 REALCOMP
- 1999-05-01 Listed $149,900 REALCOMP
- 1999-04-30 Listing Removed — REALCOMP
- 1998-08-31 Listed $154,900 REALCOMP
- 1995-05-09 Sold (Public Records) $78,124 Public Records
- 1992-09-17 Sold (Public Records) $74,000 Public Records
Property tax history
-31.8%/yrLatest (2023): $59 · -31.9% YoY. Source: county tax records.
Cash-flow waterfall
monthlySold comps — $/sqft
last 12 mo · ≤1 miLoading sold comps…