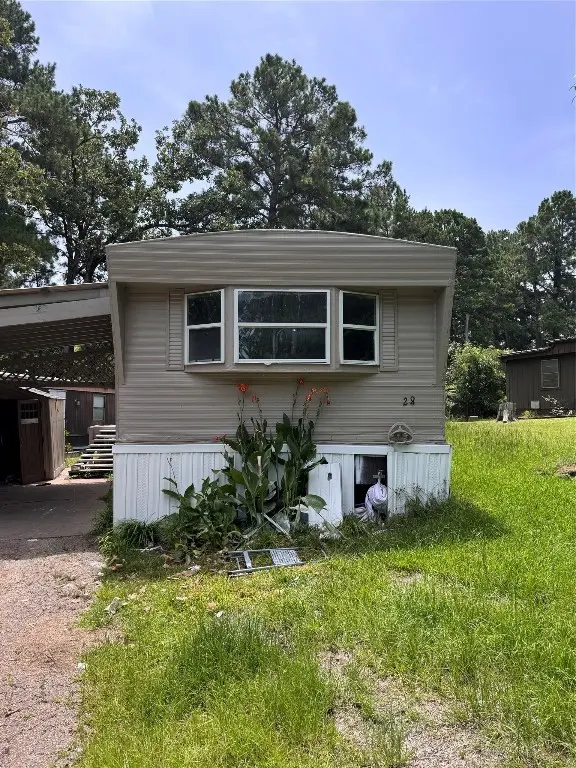
28 E Whippoorwill Ln · Westwood Shores, TX
Flood risk 1/10 · Minimal
- FEMA flood zone
- —
- Chance of flooding over 30 yrs
- 0.0%
- Est. flood insurance / yr
- —
Fire risk 3/10 · Minor
- Est. fire insurance / yr
- $1,222 – $2,270
Heat risk 8/10 · Major
- Hot days now (above 111°F)
- 7 days/yr
- Hot days in 30 yrs
- 24 days/yr
Wind risk 8/10 · Major
- Chance of severe wind over 30 yrs
- 91.0%
Air-quality risk 1/10 · Minimal
- Unhealthy air days now
- 0 days/yr
- Unhealthy air days in 30 yrs
- 0 days/yr
Risk factors via First Street. Map © Google.
Why this score? — see what drove the D+ grade
The composite is a weighted blend of 9 inputs, each scored 0–100. Each bar is that input's sub-score; the figure is the points it added to the 100-point composite (weight × sub-score).
- Cash flow +15.0/30.0
- ARV discount +7.5/15.0
- 1% rule +5.0/10.0
- DSCR +5.0/10.0
- Appreciation +4.7/10.0
- Livability +3.1/5.0
- Rent growth +2.5/5.0
- Condition / age +2.5/5.0
- Schools +2.3/10.0
$18,000
🖨 Deal sheet (PDF) 📄 Offer letter ✓ Due diligence
Listing remarks
3 Bedroom 2 bath, Located in Westwood Shores, residents enjoy fantastic amenities including a swimming pool, tennis and pickleball courts, a private golf course, fitness center, mini golf, boat ramps to Lake Livingston, and a clubhouse with a restaurant. Perfect as a peaceful retreat or a rental investment, this home combines convenience and leisure in a desirable community.
Key facts
- Fitness center
- Pickleball courts
- Mini golf
Tags
Property features AI
Finance
- Financial info: Association fee paid annually
- HOA & community: Part of Westwood Shores association; Association amenities include marina, boat ramp, clubhouse, fitness center, golf course, park, and tennis courts; Annual association fee
Exterior
- Parking: Detached carport; 1-car carport
- Utilities: Public water; Public sewer
- Home design: Residential property; Built in 1973
- Construction: Block foundation; Composition roof
- Exterior features: Cleared lot; Located in a subdivision
Interior
- Kitchen: Electric cooktop; Electric oven; Refrigerator; Dishwasher not listed
- Bedrooms: 3 total rooms
- Flooring: Vinyl flooring
- Bathrooms: 2 full bathrooms
- Heating & cooling: Window unit(s) cooling
- Interior features: Ceiling fan(s)
- Laundry & utility: Washer hookup; Electric dryer hookup; Washer and dryer listed as appliances
Neighborhood map
What this means for you Summary
Snapshot
- This is a 3-bed/2.0-bath manufactured listed at $18k.
Deal economics
- At list price, monthly cash flow is $527 ($6k/yr) — positive.
- The deal already cash-flows at list — no discount required.
- Meets the 1% rule at list price ($1k rent vs $18k).
- Cap rate 41.4% vs local median 3.6% in Westwood Shores — top-decile yield for the area; either an underpriced asset or a hidden risk that comps aren't pricing in. Stress-test before assuming the spread holds.
Location & tenants
- Location reads 62/100 on livability (#914 in TX) — a middle-class / working-renter tenant base. Strengths: crime A+, cost of living A+, housing A+; Watch: amenities F, commute F, health & safety F.
- Trinity ISD (rural): math 27% / reading 29% proficiency, ranked #682 of 826 in TX (top 83%) — low school quality limits family demand, transient renter base, plan for 1-2y turnover.
- Zoned schools: Lansberry El (math 35% / reading 33%, grade F, #2,149 of 4,322 statewide, top 50%, 570 students, 91% FRL); Trinity H S (math 22% / reading 32%, grade F, #1,204 of 1,632 statewide, top 75%, 350 students, 84% FRL) — zoned schools average 87% FRL vs 50% district-wide (37 pts higher); higher-poverty schools than district average — tighter screening recommended.
- Market conditions: 468 active listings in the ZIP; 1 units permitted in Trinity County in 2024 (0 in 5+ unit buildings).
Forward outlook
- In year one you build about $31 of equity ($124 loan paydown + $-93 appreciation (-0.5% local appreciation)).
- Trinity County population projected at -13% by 2050 — secular population decline; favor cash flow + early exit over multi-decade hold.
- At projected returns (-0.5% appreciation + 3.0% rent growth), your $5k cash investment doubles in ~1 year — after that, you're playing with house money.
Negotiation context
- Only 5 days on market — expect competitive offers; lowballing is unlikely to land.
- 4 sale attempts with the ask held roughly flat each time — persistent listings suggest the price (not the market) is what's stuck; bring a comps-based counter.
Risks & watch-outs
- Watch-outs: property tax is 4.0% of price.
- Climate carrying-cost: severe wind risk, 91% chance of damaging wind over 30y; extreme-heat days projected 7→24/yr by 2055 (HVAC capex compounding) — expect insurance premiums to compound above CPI over the hold.
Questions for the listing agent
- Built in 1973 — when were the roof, HVAC, electrical panel, plumbing, and water heater last replaced?
- Property tax is high relative to price — has the assessment been appealed recently, and will the sale trigger a re-assessment?
- What does the HOA fee cover, when was the last increase, and are there any pending special assessments or reserve-fund shortfalls?
- Is there a deadline driving the sale (1031 exchange, divorce, estate, relocation)? That informs how much negotiation room exists.
- Schools are F-rated, which usually means shorter tenancies and higher turnover. Who's the typical renter profile here, and what's been the actual vacancy rate?
- The area grade is low — what's the realistic commute time and amenity access for the typical tenant pool here? Any planned neighborhood developments (good or bad) we should know about?
- What's the average days-on-market for RENTAL listings here right now (not sales)? A rising rental-DOM trend means longer vacancies and softer asking-rent achievability than the comps imply.
- What's the recent tenant-quality profile in this submarket — average credit score on applications, eviction rate, late-payment / NSF rate, and stable-employment percentage? A property-management company in the area should have these aggregated.
- How much new for-sale + rental construction is in the pipeline within 1–3 miles? Heavy new supply typically softens prices + rents 12–24 months out; constrained supply supports both.
Investment metrics
- 1% rule
- 6.46% ✓
- Cap rate
- 41.39%
- Cash-on-cash
- 125.36%
- DSCR
- 6.58
- GRM
- 1.3
CMA / ARV
- ARV (median comp)
- $42,000
- List price
- $18,000
- Delta
- -40.48%
- Verdict
- UNDERPRICED
- Comps
- 11 within 1.0 mi
Show comp detail 6 sales within ~0.75 mi
| Address | Dist | Beds/Ba | Sqft | Sold | Price | $/sf | Match |
|---|---|---|---|---|---|---|---|
| 28 Heron Ln | 0.06mi | 3/2.0 | 924 (-6%) | 1mo | $25,000 | $27 | 87 |
| 1171 Cardinal Ln | 0.12mi | 3/2.0 | 910 (-7%) | 2mo | $35,000 | $38 | 81 |
| 160 Raven | 0.11mi | 3/2.0 | 924 (-6%) | 12mo | $55,000 | $60 | 76 |
| 1002 Cardinal Ln | 0.03mi | 2/2.0 (-1) | 896 (-9%) | 8mo | $35,000 | $39 | 73 |
| 39 E Whippoorwill Ln | 0.06mi | 2/2.0 (-1) | 840 (-14%) | 4mo | $42,000 | $50 | 65 |
| 43 Mockingbird Ln | 0.06mi | 2/2.0 (-1) | 840 (-14%) | 6mo | $53,000 | $63 | 63 |
Match score weights: distance 35% · size 25% · config 20% · recency 20%. Top-matched comps best support the ARV.
Projected returns pro-forma
-0.52% appreciation · 3.0% rent growth · sell at horizon
- IRR
- —
- Equity multiple
- 7.50×
- Total profit
- $32,756
- Equity at exit
- $4,766
- IRR
- —
- Equity multiple
- 15.75×
- Total profit
- $74,327
- Equity at exit
- $5,374
Cash invested: $5,040 (down + closing). Projections, not guarantees.
Landlord ↔ Tenant lean methodology
- Overall (STATE)
- 87 Strongly Landlord-Friendly
- State Texas
- 87 Strongly Landlord-Friendly · R+5
- County
- — inherits STATE
- City
- — inherits STATE
ZIP-level market 75862
- Home prices YoY
- -0.3%
- Active inventory
- 468
- Price-to-rent
- 1.3×
Monthly cashflow live
- Estimated rent
- $1,163 medium interval (Pro) →
- Mortgage (P&I)
- −$94
- Tax from tax record
- −$59 /mo · $712/yr
- Insurance
- −$8
- HOA
- −$231
- Vacancy / Maint / Mgmt
- −$244
- Net cashflow
- $527
Break-even live
Sensitivity live
| Price | -10% $537 | -5% $532 | +0% $527 | +5% $521 | +10% $516 |
|---|---|---|---|---|---|
| Rent | -10% $435 | -5% $481 | +0% $527 | +5% $572 | +10% $618 |
| Rate | -1.0pp $536 | -0.5pp $531 | base $527 | +0.5pp $522 | +1.0pp $517 |
UW: 25.0% down · 7.5% · 30yr · 1.5% tax · 5.0% vac · 8.0% maint · 8.0% mgmt
Financing live
Cash to close
- Down payment
- $4,500
- Closing costs
- $540
- Reserves months
- —
- Total cash needed
- —
Loan-product check · same deal, 3 products live
Conventional
25% down · 7.5% · 30yr
- Down + closing
- —
- Monthly P&I
- —
- Monthly cashflow
- —
- DSCR
- —
- Eligible?
- —
Personal DTI + credit; lowest rate.
DSCR
20% down · 8.5% · 30yr
- Down + closing
- —
- Monthly P&I
- —
- Monthly cashflow
- —
- DSCR
- —
- Eligible?
- —
No personal income docs; deal must DSCR.
Hard money
10% down · 12.0% · 12mo
- Down + closing
- —
- Monthly P&I
- —
- Monthly cashflow
- —
- DSCR
- —
- Eligible?
- —
Short-term bridge; refi at stabilization.
HOA detail
- Monthly dues
- $231 · $2,772/yr
- Likely covers
- poolgym
Listing history 16 events
-
2026-06-09status $18,000 Pending 5 DOM
-
2026-06-08days on market $18,000 Active 5 DOM
-
2026-06-07days on market $18,000 Active 4 DOM
-
2026-06-05pricedays on market $18,000 Active 1 DOM
-
2026-05-30days on market $25,000 Active 170 DOM
-
2026-05-05status Active 378-char remark
-
2026-04-27status Pending 378-char remark
-
2026-04-03price $25,000 378-char remark
-
2026-03-11price $28,000 378-char remark
-
2026-02-03price $32,000 378-char remark
-
2026-01-22price $38,000 378-char remark
-
2025-12-12$40,000 Active 378-char remark
-
2025-12-11historical
-
2025-08-07price $40,000
-
2025-07-18price $48,000
-
2025-07-02$55,000 Active
ⓘ Source: listings_history table (triggers on properties + properties_extension) + one-shot
backfill from property_details.listing_events for pre-trigger history.
Tax reassessment forecast TX · Resets to sale price
- Current annual tax
- $712 · $59/mo
- Projected year-2 tax
- $712 · $59/mo
- Expected delta
- $0/yr ($0/mo · 0.0%)
ⓘ Screening estimate from a state-policy table — verify with the county assessor before closing.
Climate risk First Street
- Flood 1/10 Low 0% chance over 30 yrs
- Wildfire 3/10 Moderate
- Heat 8/10 Severe 7 d/yr ≥111°F today · 24 d/yr by 30 yrs out
- Wind 8/10 Severe 91% chance of damaging wind over 30 yrs
- Air quality 1/10 Low 0 unhealthy d/yr today · 0 by 30 yrs out
Nearby sold comps map
Loading sold comps map…
Walkable amenities ~0.75 mi
Loading nearby amenities…
Taxation est. · year 1
- Rental income
- $13,956
- − Mortgage interest
- −$1,008
- − Property taxes
- −$712
- − Insurance
- −$90
- − Repairs & maintenance
- −$1,116
- − Management
- −$1,116
- − HOA
- −$2,772
- − Depreciation
- −$524
- Taxable income
- $6,617
- Est. tax owed @ 24.0%
- −$1,588
- After-tax cash flow
- $4,730/yr
For passive investors: Depreciation is non-cash, so a rental often shows a tax loss while cash-flowing — sheltering income. Rental losses are passive: they offset passive income freely, and up to $25,000/yr can offset ordinary (W-2) income if you actively participate and your MAGI is under $100k (phasing out to $0 by $150k); unused losses carry forward. On sale, claimed depreciation is recaptured at up to 25%, and gains may owe capital-gains tax (a 1031 exchange can defer both). Figures are a year-1 estimate at your 24.0% rate — not tax advice; consult a CPA.
Schools (NCES district)
- District
- Trinity ISD
- NCES district ID
- 4843200
- Math proficiency
- 27% ▼ -2.00%
- Reading proficiency
- 29% ▲ 1.00%
- Median HH income
- $37,104
- Composite
- 23.31/100
- National rank
- #7919
- State rank
- #682 of 826 in TX
Livability — Westwood Shores
- Score
- 62/100
- State rank
- #914
- US rank
- #16347
Category grades
Schools grade is shown separately in the Schools card above.
Census & demographics
- Census place
- Westwood Shores, TX
- Population (ZIP)
- 10,030
Population outlook (Trinity County) Hauer SSP2
- Today (2025)
- 13,746 people
- By 2030
- 13,333 · -3.0%
- By 2040
- 12,542 · -8.8%
- By 2050
- 11,942 · -13.1%
- By 2075
- 10,871 · -20.9%
- By 2100
- 9,784 · -28.8%
Race, ethnicity, and origin ACS 2023
- Neighborhood character
- Predominantly White (74%)
- Race & ethnicity
- White 74% Hispanic / Latino 12% Black 10% Two or more races 7%
- Hispanic origin (detail)
- Mexican 11%
- Common ancestry
- Lithuanian 3% Serbian 2% Slovak 2%
- Foreign-born
- 4% · Canada
- Languages at home
- 89% English-only · Spanish 9% French/Haitian/Cajun 2%
Political lean MEDSL · Trinity
- 2024 margin
- Solid R (+67.0) · D 16.2% · R 83.2%
- 2008→2024 swing
- -31.3pp toward R · 2008: -35.7pp · 2024: -67.0pp
- All cycles
- 2024: R+67.0 2020: R+61.3 2016: R+59.9 2012: R+46.9 2008: R+35.7
Not yet ingested
- Civics
- —
Market trends
- HPI YoY
- ▼ -0.52%
- Current HPI
- 174.6638
- Rent YoY
- —
- Metro
- —
- State GDP YoY
- ▲ 3.95%
- F500 in state
- 110
Industry mix (Fortune 500 HQ in TX)
| Industry | F500 HQs | Revenue |
|---|---|---|
| Energy | 16 | $1,198B |
|
||
| Technology | 5 | $198B |
|
||
| Engineering / Construction | 4 | $72B |
|
||
| Energy Services | 3 | $60B |
|
||
| Utilities | 3 | $41B |
|
||
| Healthcare | 2 | $330B |
|
||
Price history
-67.3% since first listed14 events — show timeline
- 2026-06-08 Pending — HARMLS
- 2026-06-03 Listed $18,000 HARMLS
- 2026-05-30 Listing Removed — HARMLS
- 2026-05-05 Relisted — HARMLS
- 2026-04-27 Pending — HARMLS
- 2026-04-03 Price Changed $25,000 HARMLS
- 2026-03-11 Price Changed $28,000 HARMLS
- 2026-02-03 Price Changed $32,000 HARMLS
- 2026-01-22 Price Changed $38,000 HARMLS
- 2025-12-12 Listed $40,000 HARMLS
- 2025-12-11 Listing Removed — HARMLS
- 2025-08-07 Price Changed $40,000 HARMLS
- 2025-07-18 Price Changed $48,000 HARMLS
- 2025-07-02 Listed $55,000 HARMLS
Property tax history
+5.3%/yrLatest (2025): $712 · -3.2% YoY. Source: county tax records.
Cash-flow waterfall
monthlySold comps — $/sqft
last 12 mo · ≤1 miLoading sold comps…