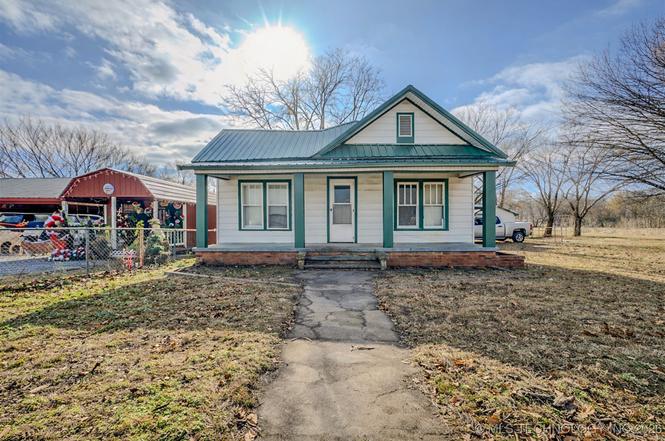
402 E Main St · Wilburton, OK
Flood risk 1/10 · Minimal
- FEMA flood zone
- X
- Chance of flooding over 30 yrs
- 0.0%
- Est. flood insurance / yr
- $507 – $1,088
Fire risk 7/10 · Major
- Est. fire insurance / yr
- $2,463 – $4,575
Heat risk 6/10 · Moderate
- Hot days now (above 112°F)
- 7 days/yr
- Hot days in 30 yrs
- 20 days/yr
Wind risk 3/10 · Minor
- Chance of severe wind over 30 yrs
- 6.0%
Air-quality risk 2/10 · Minimal
- Unhealthy air days now
- 1 days/yr
- Unhealthy air days in 30 yrs
- 1 days/yr
Risk factors via First Street. Map © Google.
Why this score? — see what drove the B+ grade
The composite is a weighted blend of 9 inputs, each scored 0–100. Each bar is that input's sub-score; the figure is the points it added to the 100-point composite (weight × sub-score).
- Cash flow +28.7/30.0
- ARV discount +15.0/15.0
- DSCR +10.0/10.0
- 1% rule +7.0/10.0
- Appreciation +5.2/10.0
- Livability +3.0/5.0
- Rent growth +2.5/5.0
- Condition / age +2.5/5.0
- Schools +2.0/10.0
$85,000
🖨 Deal sheet 📄 Offer letter ✓ Due diligence
Listing remarks
Opportunity knocks at 402 E. Main St. in the heart of Wilburton. This unique property features two separate homes on one lot, offering rare flexibility for investors, multi generational living, or buyers looking to offset their mortgage with rental income. Both homes need some TLC, but that is exactly where the value lies. With vision and a little sweat equity, this property has the potential to become a strong income producing investment, a live in and rent opportunity, or a customized home setup tailored to your needs. Whether you are an investor looking to add doors to your portfolio or a first time buyer ready to build equity instead of paying rent, this property opens the door to long
Key facts
- Space and layout
- Two separate homes
- 0.32 acre lot
Tags
Property features AI
Finance
- HOA & community: Sidewalks
Exterior
- Parking: Attached garage with 2 spaces; Carport
- Security: Storm shelter
- Utilities: Public water; Public sewer; Unknown utilities provider
- Home design: Single-story; Wood frame construction with aluminum and vinyl siding
- Construction: Metal roof; Crawlspace foundation; Built (year per public records)
- Exterior features: Covered porch; Shed(s); Storm shelter; North-facing lot
Interior
- Kitchen: Range; Stove
- Flooring: Carpet; Vinyl
- Bathrooms: 2 full bathrooms
- Heating & cooling: Floor furnace (gas); Window cooling units
- Interior features: Ceiling fan(s); Laminate counters; Gas oven connection; Aluminum window frames; Crawl space
- Laundry & utility: Gas water heater
Neighborhood map
What this means for you Summary
Snapshot
- This is a 2-bed/2.0-bath single-family listed at $85k.
Deal economics
- At list price, monthly cash flow is $283 ($3k/yr) — positive.
- The deal already cash-flows at list — no discount required.
- Meets the 1% rule at list price ($1k rent vs $85k).
- Recommended offer: $75k (12.0% below list) — sets the bar for market timing.
Location & tenants
- Location reads 60/100 on livability (#351 in OK) — a middle-class / working-renter tenant base. Strengths: cost of living A+, housing A+, crime B+; Watch: schools F, amenities F, commute F.
- Wilburton (town): math 25% / reading 22% proficiency, ranked #136 of 270 in OK (top 50%) — low school quality limits family demand, transient renter base, plan for 1-2y turnover.
- Market conditions: 57 active listings in the ZIP.
Forward outlook
- In year one you build about $939 of equity ($588 loan paydown + $351 appreciation (0.4% local appreciation)).
- Latimer County population projected at -24% by 2050 — secular population decline; favor cash flow + early exit over multi-decade hold.
- At projected returns (0.4% appreciation + 3.0% rent growth), your $24k cash investment doubles in ~5 years — after that, you're playing with house money.
Negotiation context
- It's been on market 153 days — a 12% lower offer ($75k) is reasonable based on typical stale-listing flexibility.
Risks & watch-outs
- Watch-outs: built in 1947 — expect roof / HVAC / electrical / plumbing capex.
- Climate carrying-cost: major wildfire risk; extreme-heat days projected 7→20/yr by 2055 (HVAC capex compounding) — expect insurance premiums to compound above CPI over the hold.
Questions for the listing agent
- It's been on market 153 days. Have you received any prior offers? Is the seller open to a 12% concession, seller financing, or rate buy-down credit?
- Built in 1947 — when were the roof, HVAC, electrical panel, plumbing, and water heater last replaced?
- Why hasn't it sold? Are there any deal-killer items the seller is aware of (foundation, flood, title, zoning, code violations)?
- Is there a deadline driving the sale (1031 exchange, divorce, estate, relocation)? That informs how much negotiation room exists.
- Schools are F-rated, which usually means shorter tenancies and higher turnover. Who's the typical renter profile here, and what's been the actual vacancy rate?
- What's the average days-on-market for RENTAL listings here right now (not sales)? A rising rental-DOM trend means longer vacancies and softer asking-rent achievability than the comps imply.
- What's the recent tenant-quality profile in this submarket — average credit score on applications, eviction rate, late-payment / NSF rate, and stable-employment percentage? A property-management company in the area should have these aggregated.
- How much new for-sale + rental construction is in the pipeline within 1–3 miles? Heavy new supply typically softens prices + rents 12–24 months out; constrained supply supports both.
Investment metrics
- 1% rule
- 1.20% ✓
- Cap rate
- 10.29%
- Cash-on-cash
- 14.28%
- DSCR
- 1.64
- GRM
- 7.0
CMA / ARV
- ARV (on-the-fly)
- $131,127
- Comps found
- 5
Show comp detail 5 sales within ~0.75 mi
| Address | Dist | Beds/Ba | Sqft | Sold | Price | $/sf | Match |
|---|---|---|---|---|---|---|---|
| 908 E Rock Is | 0.36mi | 2/2.0 | 1,100 (-9%) | 8mo | $130,000 | $118 | 62 |
| 414 E Ada | 0.10mi | 3/1.0 (+1) | 1,100 (-9%) | 19mo | $105,000 | $95 | 56 |
| 203 E Cedar Ave | 0.33mi | 3/1.0 (+1) | 1,056 (-12%) | 3mo | $115,000 | $109 | 53 |
| 175 SE 101st Rd | 0.70mi | 2/1.0 | 1,200 (-0%) | 18mo | $145,000 | $121 | 48 |
| 305 SW 1st | 0.48mi | 3/1.0 (+1) | 1,338 (+11%) | 12mo | $95,000 | $71 | 40 |
Match score weights: distance 35% · size 25% · config 20% · recency 20%. Top-matched comps best support the ARV.
Projected returns pro-forma
0.41% appreciation · 3.0% rent growth · sell at horizon
- IRR
- 14.7%
- Equity multiple
- 1.72×
- Total profit
- $17,183
- Equity at exit
- $26,451
- IRR
- 18.8%
- Equity multiple
- 3.15×
- Total profit
- $51,140
- Equity at exit
- $33,244
Cash invested: $23,800 (down + closing). Projections, not guarantees.
Landlord ↔ Tenant lean methodology
- Overall (STATE)
- 83 Strongly Landlord-Friendly
- State Oklahoma
- 83 Strongly Landlord-Friendly · R+20
- County
- — inherits STATE
- City
- — inherits STATE
ZIP-level market 74578
- Home prices YoY
- 0.2%
- Active inventory
- 57
- Price-to-rent
- 7.0×
Monthly cashflow live
- Estimated rent
- $1,017 medium interval (Pro) →
- Mortgage (P&I)
- −$446
- Tax from tax record
- −$39 /mo · $468/yr
- Insurance
- −$35
- HOA
- −$0
- Vacancy / Maint / Mgmt
- −$214
- Net cashflow
- $283
Break-even live
UW: 25.0% down · 7.5% · 30yr · 1.5% tax · 5.0% vac · 8.0% maint · 8.0% mgmt
Financing live
Cash to close
- Down payment
- $21,250
- Closing costs
- $2,550
- Reserves months
- —
- Total cash needed
- —
Loan-product check · same deal, 3 products live
Conventional
25% down · 7.5% · 30yr
- Down + closing
- —
- Monthly P&I
- —
- Monthly cashflow
- —
- DSCR
- —
- Eligible?
- —
Personal DTI + credit; lowest rate.
DSCR
20% down · 8.5% · 30yr
- Down + closing
- —
- Monthly P&I
- —
- Monthly cashflow
- —
- DSCR
- —
- Eligible?
- —
No personal income docs; deal must DSCR.
Hard money
10% down · 12.0% · 12mo
- Down + closing
- —
- Monthly P&I
- —
- Monthly cashflow
- —
- DSCR
- —
- Eligible?
- —
Short-term bridge; refi at stabilization.
Listing history 16 events
-
2026-06-18days on market $85,000 Active 153 DOM
-
2026-06-17days on market $85,000 Active 152 DOM
-
2026-06-16days on market $85,000 Active 151 DOM
-
2026-06-15days on market $85,000 Active 150 DOM
-
2026-06-13days on market $85,000 Active 148 DOM
-
2026-06-12days on market $85,000 Active 147 DOM
-
2026-06-09days on market $85,000 Active 144 DOM
-
2026-06-08days on market $85,000 Active 143 DOM
-
2026-06-08days on market $85,000 Active 142 DOM
-
2026-06-07days on market $85,000 Active 141 DOM
-
2026-06-04days on market $85,000 Active 138 DOM
-
2026-06-02days on market $85,000 Active 137 DOM
-
2026-06-01days on market $85,000 Active 136 DOM
-
2026-05-31days on market $85,000 Active 135 DOM
-
2026-03-23price $85,000
-
2026-01-16$99,999 Active
ⓘ Source: listings_history table (triggers on properties + properties_extension) + one-shot
backfill from property_details.listing_events for pre-trigger history.
Tax reassessment forecast OK · Resets to sale price
- Current annual tax
- $468 · $39/mo
- Projected year-2 tax
- $765 · $64/mo
- Expected delta
- +$297/yr (+$25/mo · 63.5%)
ⓘ Screening estimate from a state-policy table — verify with the county assessor before closing.
Climate risk First Street
- Flood 1/10 Low FEMA zone X · 0% chance over 30 yrs
- Wildfire 7/10 Severe
- Heat 6/10 Major 7 d/yr ≥112°F today · 20 d/yr by 30 yrs out
- Wind 3/10 Moderate 6% chance of damaging wind over 30 yrs
- Air quality 2/10 Low 1 unhealthy d/yr today · 1 by 30 yrs out
Nearby sold comps map
Loading sold comps map…
Walkable amenities ~0.75 mi
Loading nearby amenities…
Taxation est. · year 1
- Rental income
- $12,202
- − Mortgage interest
- −$4,761
- − Property taxes
- −$468
- − Insurance
- −$425
- − Repairs & maintenance
- −$976
- − Management
- −$976
- − Depreciation
- −$2,473
- Taxable income
- $2,122
- Est. tax owed @ 24.0%
- −$509
- After-tax cash flow
- $2,888/yr
For passive investors: Depreciation is non-cash, so a rental often shows a tax loss while cash-flowing — sheltering income. Rental losses are passive: they offset passive income freely, and up to $25,000/yr can offset ordinary (W-2) income if you actively participate and your MAGI is under $100k (phasing out to $0 by $150k); unused losses carry forward. On sale, claimed depreciation is recaptured at up to 25%, and gains may owe capital-gains tax (a 1031 exchange can defer both). Figures are a year-1 estimate at your 24.0% rate — not tax advice; consult a CPA.
Schools (NCES district)
- District
- Wilburton
- NCES district ID
- 4032790
- Math proficiency
- 25% ▼ -10.00%
- Reading proficiency
- 22% ▼ -11.00%
- Median HH income
- $38,345
- Composite
- 19.72/100
- National rank
- #8718
- State rank
- #136 of 270 in OK
Livability — Wilburton
- Score
- 60/100
- State rank
- #351
- US rank
- #19035
Category grades
Schools grade is shown separately in the Schools card above.
Census & demographics
- Census place
- Wilburton, OK
- Population (ZIP)
- 5,721
Population outlook (Latimer County) Hauer SSP2
- Today (2025)
- 9,565 people
- By 2030
- 9,029 · -5.6%
- By 2040
- 8,084 · -15.5%
- By 2050
- 7,283 · -23.9%
- By 2075
- 5,893 · -38.4%
- By 2100
- 4,944 · -48.3%
Race, ethnicity, and origin ACS 2023
- Neighborhood character
- Diverse neighborhood (Simpson 0.62)
- Race & ethnicity
- White 61% Native American 24% Two or more races 10% Hispanic / Latino 5% Black 1%
- Common ancestry
- Italian 2% Lithuanian 1% Iranian 1%
- Foreign-born
- 1% · Canada
- Languages at home
- 97% English-only · Spanish 2%
Political lean MEDSL · Latimer
- 2024 margin
- Solid R (+65.6) · D 16.7% · R 82.3% · Other 1.0%
- 2008→2024 swing
- -28.5pp toward R · 2008: -37.1pp · 2024: -65.6pp
- All cycles
- 2024: R+65.6 2020: R+63.0 2016: R+56.7 2012: R+38.3 2008: R+37.1
Not yet ingested
- Civics
- —
Market trends
- HPI YoY
- ▲ 0.41%
- Current HPI
- 176.1285
- Rent YoY
- —
- Metro
- —
- State GDP YoY
- ▲ 1.55%
- F500 in state
- 6
Industry mix (Fortune 500 HQ in OK)
| Industry | F500 HQs | Revenue |
|---|---|---|
| Energy | 3 | $48B |
|
||
Price history
-15.0% since first listed2 events — show timeline
- 2026-03-23 Price Changed $85,000 MLS Technology, Inc.
- 2026-01-16 Listed $99,999 MLS Technology, Inc.
Property tax history
+5.4%/yrLatest (2025): $468 · +5.2% YoY. Source: county tax records.
Cash-flow waterfall
monthlySold comps — $/sqft
last 12 mo · ≤1 miLoading sold comps…