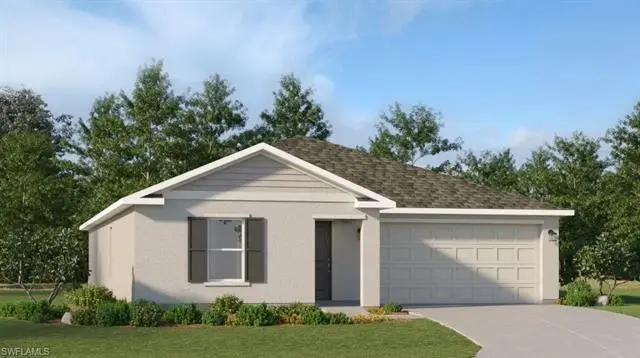
4024 23rd St SW · Lehigh Acres, FL
Flood risk 5/10 · Moderate
- FEMA flood zone
- X (unshaded)
- Chance of flooding over 30 yrs
- 0.66%
- Est. flood insurance / yr
- $507 – $1,088
Fire risk 5/10 · Moderate
- Est. fire insurance / yr
- $947 – $1,759
Heat risk 10/10 · Severe
- Hot days now (above 107°F)
- 7 days/yr
- Hot days in 30 yrs
- 31 days/yr
Wind risk 10/10 · Severe
- Chance of severe wind over 30 yrs
- 99.0%
Air-quality risk 2/10 · Minimal
- Unhealthy air days now
- 1 days/yr
- Unhealthy air days in 30 yrs
- 1 days/yr
Risk factors via First Street. Map © Google.
Why this score? — see what drove the D grade
The composite is a weighted blend of 9 inputs, each scored 0–100. Each bar is that input's sub-score; the figure is the points it added to the 100-point composite (weight × sub-score).
- Appreciation +10.0/10.0
- Cash flow +7.8/30.0
- ARV discount +7.5/15.0
- Schools +4.1/10.0
- Livability +3.0/5.0
- Condition / age +2.5/5.0
- 1% rule +2.4/10.0
- Rent growth +2.1/5.0
- DSCR +1.9/10.0
$265,097
🖨 Deal sheet 📄 Offer letter ✓ Due diligence
Listing remarks
One or more photo(s) has been virtually staged, AI generated or rendered. THIS NEW CONSTRUCTION HOME IS READY FOR YOU NOW! This new single-story home maximizes space and emphasizes convenience. The open-concept layout integrates the family room, dining room and kitchen with a central island, facilitating effortless transitions between rooms for easy entertaining during gatherings. On the opposite side of the home are all three bedrooms, including the peaceful owner’s suite with an attached bathroom and walk-in closet. Discover the allure of Lennar's standalone homes throughout Lehigh Acres, where you can enjoy the advantages of a Lennar home with no HOA fees. Prices, dimensions and fe
Key facts
- 0.25 acre lot
- 2 garage spots
- Built 2026
Property features AI
Finance
- Other: Corner lot; Lot dimensions approx. 90 x 120 (developer brochure); Lot size about 0.247 acre; Landscaped view; Irrigation via well; No canal access; Single unit building on one floor
- HOA & community: No HOA maintenance; No community amenities; Community type: see remarks
Exterior
- Parking: Attached 2-car garage
- Utilities: Well water; Septic sewer; Electric service (central)
- Home design: Residential single-family home; 1-story ranch / traditional exterior; Rear exposure faces north; Located in Lehigh Acres development
- Construction: Concrete block construction; Built in 2026
- Exterior features: Shingle roof; Single-hung and sliding windows; Manual shutters; Stucco exterior
Interior
- Kitchen: Dishwasher; Double oven; Range; Self-cleaning oven; Microwave; Refrigerator/ice maker; Freezer
- Bedrooms: 3 bedrooms; Primary bedroom on first floor
- Flooring: Carpet; Tile
- Bathrooms: 2 full bathrooms; Master bath with shower (no tub)
- Heating & cooling: Central electric heat; Central electric air conditioning
- Interior features: High-speed internet available; Walk-in closet; Dining area (family); Guest bath; Guest room; Laundry in residence; Open porch/lanai; Unfurnished; Great room floor plan; 2-story interior layout
- Laundry & utility: Washer; Dryer; Auto garage door
Neighborhood map
What this means for you Summary
Snapshot
- This is a 3-bed/2.0-bath land listed at $265k.
Deal economics
- At list price, monthly cash flow is $-290 ($-3k/yr) — negative.
- To cash-flow at today's rent, offer at most $223k (15.8% below list).
- To meet the 1% rule (rent ≥ 1% of price), the offer needs to be $195k (26.4% below list).
- Recommended offer: $195k (26.4% below list) — sets the bar for 1% rule.
Location & tenants
- Location reads 59/100 on livability (#826 in FL) — a working-class tenant base; expect higher turnover. Strengths: cost of living A+, housing A+; Watch: crime C-, employment D+, schools D-.
- Lee (suburban): math 47% / reading 50% proficiency, ranked #42 of 73 in FL (top 58%) — families likely to look elsewhere, expect single-tenant / working-renter base with shorter leases.
- Market conditions: Rents soft (-1.5%/yr); 786 active listings in the ZIP; 40 comparable units currently listed for rent nearby; rentals at typical pace (median 24d on market — plan ~3-4 weeks tenant-placement turnaround); 15,411 units permitted in Lee County in 2024 (4,686 in 5+ unit buildings).
- This rent runs 32% of the median local income ($73k/yr) — at the standard rent-burdened threshold; future hikes will face affordability resistance.
Forward outlook
- In year one you build about $28k of equity ($2k loan paydown + $27k appreciation (10.0% local appreciation)).
- Lee County population projected at +44% by 2050 — long-run rental-demand tailwind backs the buy-and-hold thesis.
- By year 2, paydown + projected appreciation supports a ~$46k cash-out refi (75% LTV) — recoverable capital for the next deal without selling this one.
Negotiation context
- Only 9 days on market — expect competitive offers; lowballing is unlikely to land.
- Current owner paid $224k; 18% above their basis — modest negotiation headroom, anchor on the comps not their cost.
Risks & watch-outs
- Climate carrying-cost: moderate flood risk; severe wind risk, 99% chance of damaging wind over 30y; moderate wildfire risk; extreme-heat days projected 7→31/yr by 2055 (HVAC capex compounding) — expect insurance premiums to compound above CPI over the hold.
Questions for the listing agent
- What do current leases actually rent for vs. the listed asking? Can we see a recent rent roll and the last 12 months of T-12 income?
- Is there a deadline driving the sale (1031 exchange, divorce, estate, relocation)? That informs how much negotiation room exists.
- Schools are D-rated, which usually means shorter tenancies and higher turnover. Who's the typical renter profile here, and what's been the actual vacancy rate?
- The area grade is low — what's the realistic commute time and amenity access for the typical tenant pool here? Any planned neighborhood developments (good or bad) we should know about?
- What's the average days-on-market for RENTAL listings here right now (not sales)? A rising rental-DOM trend means longer vacancies and softer asking-rent achievability than the comps imply.
- What's the recent tenant-quality profile in this submarket — average credit score on applications, eviction rate, late-payment / NSF rate, and stable-employment percentage? A property-management company in the area should have these aggregated.
- How much new for-sale + rental construction is in the pipeline within 1–3 miles? Heavy new supply typically softens prices + rents 12–24 months out; constrained supply supports both.
Investment metrics
- 1% rule
- 0.74% ✗
- Cap rate
- 4.98%
- Cash-on-cash
- -4.69%
- DSCR
- 0.79
- GRM
- 11.3
CMA / ARV
No comps found within radius.
Projected returns pro-forma
10.0% appreciation · 0.0% rent growth · sell at horizon
- IRR
- 20.1%
- Equity multiple
- 2.62×
- Total profit
- $120,196
- Equity at exit
- $238,820
- IRR
- 17.8%
- Equity multiple
- 5.83×
- Total profit
- $358,319
- Equity at exit
- $515,025
Cash invested: $74,227 (down + closing). Projections, not guarantees.
Landlord ↔ Tenant lean methodology
- Overall (STATE)
- 87 Strongly Landlord-Friendly
- State Florida
- 87 Strongly Landlord-Friendly · R+3
- County
- — inherits STATE
- City
- — inherits STATE
ZIP-level market 33976
- Home prices YoY
- 6.8%
- Rents YoY
- -1.5%
- Active inventory
- 786
- Price-to-rent
- 11.3×
Monthly cashflow live
- Estimated rent
- $1,951 high interval (Pro) →
- Mortgage (P&I)
- −$1,390
- Tax est. 1.5%
- −$331 /mo · $3,976/yr
- Insurance
- −$110
- HOA
- −$0
- Vacancy / Maint / Mgmt
- −$410
- Net cashflow
- $-290
Break-even live
UW: 25.0% down · 7.5% · 30yr · 1.5% tax · 5.0% vac · 8.0% maint · 8.0% mgmt
Financing live
Cash to close
- Down payment
- $66,274
- Closing costs
- $7,953
- Reserves months
- —
- Total cash needed
- —
Loan-product check · same deal, 3 products live
Conventional
25% down · 7.5% · 30yr
- Down + closing
- —
- Monthly P&I
- —
- Monthly cashflow
- —
- DSCR
- —
- Eligible?
- —
Personal DTI + credit; lowest rate.
DSCR
20% down · 8.5% · 30yr
- Down + closing
- —
- Monthly P&I
- —
- Monthly cashflow
- —
- DSCR
- —
- Eligible?
- —
No personal income docs; deal must DSCR.
Hard money
10% down · 12.0% · 12mo
- Down + closing
- —
- Monthly P&I
- —
- Monthly cashflow
- —
- DSCR
- —
- Eligible?
- —
Short-term bridge; refi at stabilization.
Rent comps 40 comps
| Address | Beds | Baths | Sqft | Rent | $/sqft | DOM | Units | Dist |
|---|---|---|---|---|---|---|---|---|
| 4203 23rd St SW Lehigh Acres, FL | 4.0 | 2.0 | 1833 | $1,850 | $1.01 | 19d | 1 | 0.13mi |
| 4001 22nd St SW Lehigh Acres, FL | 3.0 | 2.0 | 1055 | $1,950 | $1.85 | 3d | 1 | 0.22mi |
| 4221 18th St SW Lehigh Acres, FL | 3.0 | 2.5 | 1600 | $2,600 | $1.62 | 14d | 1 | 0.35mi |
| 4021 28th St SW Lehigh Acres, FL | 3.0 | 2.0 | 1529 | $1,800 | $1.18 | 24d | 1 | 0.39mi |
| 1578 Gretchen Ave S Lehigh Acres, FL | 3.0 | 2.0 | 1728 | $2,000 | $1.16 | 24d | 1 | 0.48mi |
| 4401 22nd St SW Lehigh Acres, FL | 3.0 | 2.0 | 1109 | $1,345 | $1.21 | 24d | 1 | 0.51mi |
| 4412 25th St SW Lehigh Acres, FL | 3.0 | 2.0 | 1205 | $1,700 | $1.41 | 21d | 1 | 0.52mi |
| 1544 Gretchen Ave S Lehigh Acres, FL | 2.0 | 2.0 | 1221 | $1,800 | $1.47 | 24d | 1 | 0.53mi |
| 4421 25th St SW Lehigh Acres, FL | 3.0 | 2.0 | 1253 | $1,250 | $1.00 | 10d | 1 | 0.58mi |
| 4507 20th St SW Lehigh Acres, FL | 2.0 | 2.0 | 1135 | $1,400 | $1.23 | 24d | 1 | 0.63mi |
| 1502 Gretchen Ave S Lehigh Acres, FL | 3.0 | 2.0 | 1270 | $2,000 | $1.57 | 3d | 1 | 0.65mi |
| 4101 33rd St SW Lehigh Acres, FL | 3.0 | 2.0 | 1698 | $2,200 | $1.30 | 14d | 1 | 0.65mi |
| 3714 17th St SW Lehigh Acres, FL | 4.0 | 2.0 | 1833 | $1,890 | $1.03 | 24d | 1 | 0.68mi |
| 4512 Leonard Blvd S Lehigh Acres, FL | 2.0 | 2.0 | 1048 | $1,300 | $1.24 | 3d | 1 | 0.69mi |
| 4512 Leonard Blvd S Lehigh Acres, FL | 2.0 | 2.0 | 1048 | $1,350 | $1.29 | 24d | 1 | 0.69mi |
| 4514 Leonard Blvd S Lehigh Acres, FL | 2.0 | 2.0 | 1048 | $1,300 | $1.24 | 3d | 1 | 0.70mi |
| 4514 Leonard Blvd S Lehigh Acres, FL | 2.0 | 2.0 | 1048 | $1,350 | $1.29 | 24d | 1 | 0.70mi |
| 4005 12th St SW Lehigh Acres, FL | 3.0 | 2.0 | 1122 | $1,610 | $1.43 | 19d | 1 | 0.70mi |
| 4523 22nd St SW Lehigh Acres, FL | 3.0 | 2.0 | 1125 | $1,700 | $1.51 | 24d | 1 | 0.72mi |
| 1504 Gary Ln Lehigh Acres, FL | 3.0 | 2.0 | 1198 | $1,660 | $1.39 | 24d | 1 | 0.72mi |
| 1506 Gary Ln Lehigh Acres, FL | 3.0 | 2.0 | 1198 | $1,660 | $1.39 | 24d | 1 | 0.73mi |
| 4435 27th St SW Lehigh Acres, FL | 3.0 | 2.0 | 1158 | $1,250 | $1.08 | 19d | 1 | 0.73mi |
| 4503 15th St SW Lehigh Acres, FL | 3.0 | 2.0 | 1200 | $1,800 | $1.50 | 24d | 1 | 0.74mi |
| 4440 28th St SW Lehigh Acres, FL | 3.0 | 2.0 | 1200 | $1,495 | $1.25 | 12d | 1 | 0.76mi |
| 2904 Wanda Ave S Lehigh Acres, FL | 3.0 | 2.0 | 1501 | $1,900 | $1.27 | 24d | 1 | 0.78mi |
| 2504 Vera Ave S Lehigh Acres, FL | 3.0 | 3.0 | 1643 | $2,400 | $1.46 | 24d | 1 | 0.79mi |
| 4541 20th St SW Lehigh Acres, FL | 2.0 | 1.0 | 924 | $1,195 | $1.29 | 24d | 1 | 0.79mi |
| 4543 21st St SW Lehigh Acres, FL | 3.0 | 2.0 | 1228 | $1,600 | $1.30 | 3d | 1 | 0.79mi |
| 4543 21st St SW Lehigh Acres, FL | 3.0 | 2.0 | 1228 | $1,600 | $1.30 | 3d | 1 | 0.79mi |
| 4545 21st St SW Lehigh Acres, FL | 3.0 | 2.0 | 1200 | $1,500 | $1.25 | 24d | 1 | 0.80mi |
| 4020 36th St SW Lehigh Acres, FL | 3.0 | 2.0 | 1354 | $2,050 | $1.51 | 24d | 1 | 0.81mi |
| 4528 24th St SW Lehigh Acres, FL | 3.0 | 2.0 | 1200 | $2,300 | $1.92 | 16d | 1 | 0.82mi |
| 1101 Meadow Rd Lehigh Acres, FL | 2.0 | 2.0 | 1024 | $2,027 | $1.98 | 24d | 1 | 0.82mi |
| 1103 Meadow Rd Lehigh Acres, FL | 2.0 | 2.0 | 1024 | $2,027 | $1.98 | 24d | 1 | 0.82mi |
| 1511 Haviland Ave S Lehigh Acres, FL | 3.0 | 2.0 | 1200 | $1,550 | $1.29 | 24d | 1 | 0.83mi |
| 1509 Haviland Ave S Lehigh Acres, FL | 3.0 | 2.0 | 1200 | $1,550 | $1.29 | 24d | 1 | 0.83mi |
| 4458 29th St SW Lehigh Acres, FL | 2.0 | 2.0 | 1024 | $2,027 | $1.98 | 24d | 1 | 0.85mi |
| 4460 29th St SW Lehigh Acres, FL | 2.0 | 2.0 | 1024 | $1,500 | $1.46 | 24d | 1 | 0.86mi |
| 4453 29th St SW Lehigh Acres, FL | 3.0 | 2.0 | 1198 | $1,660 | $1.39 | 24d | 1 | 0.86mi |
| 4455 29th St SW Lehigh Acres, FL | 3.0 | 2.0 | 1198 | $1,660 | $1.39 | 24d | 1 | 0.86mi |
Listing history 6 events
-
2026-05-08status Pending
-
2026-04-29$265,097 Active
-
2025-10-06soldstatus $224,000
-
2022-07-06soldstatus $244,000
-
2016-01-08soldstatus $2,000,000
-
2005-02-11soldstatus $24,400
ⓘ Source: listings_history table (triggers on properties + properties_extension) + one-shot
backfill from property_details.listing_events for pre-trigger history.
Climate risk First Street
- Flood 5/10 Major FEMA zone X (unshaded) · 66% chance over 30 yrs
- Wildfire 5/10 Major
- Heat 10/10 Extreme 7 d/yr ≥107°F today · 31 d/yr by 30 yrs out
- Wind 10/10 Extreme 99% chance of damaging wind over 30 yrs
- Air quality 2/10 Low 1 unhealthy d/yr today · 1 by 30 yrs out
Nearby sold comps map
Loading sold comps map…
Walkable amenities ~0.75 mi
Loading nearby amenities…
Taxation est. · year 1
- Rental income
- $23,418
- − Mortgage interest
- −$14,850
- − Property taxes
- −$3,976
- − Insurance
- −$1,325
- − Repairs & maintenance
- −$1,873
- − Management
- −$1,873
- − Depreciation
- −$7,712
- Taxable loss
- −$8,192
- Est. tax savings @ 24.0%
- +$1,966
- After-tax cash flow
- $-1,518/yr
For passive investors: Depreciation is non-cash, so a rental often shows a tax loss while cash-flowing — sheltering income. Rental losses are passive: they offset passive income freely, and up to $25,000/yr can offset ordinary (W-2) income if you actively participate and your MAGI is under $100k (phasing out to $0 by $150k); unused losses carry forward. On sale, claimed depreciation is recaptured at up to 25%, and gains may owe capital-gains tax (a 1031 exchange can defer both). Figures are a year-1 estimate at your 24.0% rate — not tax advice; consult a CPA.
Schools (NCES district)
- District
- Lee
- NCES district ID
- 1201080
- Math proficiency
- 47% ▼ -11.00%
- Reading proficiency
- 50% ▼ -4.00%
- Median HH income
- $49,518
- Composite
- 41.49/100
- National rank
- #3458
- State rank
- #42 of 73 in FL
Livability — Lehigh Acres
- Score
- 59/100
- State rank
- #826
- US rank
- #20055
Category grades
Schools grade is shown separately in the Schools card above.
Census & demographics
- Census place
- Lehigh Acres, FL
- County
- Lee County · 788,662 people
- City population
- 130,638
- Metro
- Cape Coral-Fort Myers, FL
- Population (ZIP)
- 20,277
- Household income
- $72,679
- Rent vs Own
- Severe rent burden
- 574.0
Population outlook (Lee County) Hauer SSP2
- Today (2025)
- 871,946 people
- By 2030
- 955,468 · +9.6%
- By 2040
- 1,113,587 · +27.7%
- By 2050
- 1,256,891 · +44.1%
- By 2075
- 1,560,270 · +78.9%
- By 2100
- 1,726,848 · +98.0%
Race, ethnicity, and origin ACS 2023
- Neighborhood character
- Diverse neighborhood (Simpson 0.65)
- Race & ethnicity
- Hispanic / Latino 50% Two or more races 30% White 24% Black 20% Asian 3%
- Hispanic origin (detail)
- Mexican 8% Puerto Rican 8% Cuban 18% Dominican 4%
- Common ancestry
- Hispanic 8% Slovak 1% Lithuanian 1%
- Foreign-born
- 35% · Canada, Jamaica, Vietnam
- Languages at home
- 46% English-only · Spanish 43% French/Haitian/Cajun 8% Vietnamese 1%
Political lean MEDSL · Lee
- 2024 margin
- Strong R (+28.4) · D 35.5% · R 63.9%
- 2008→2024 swing
- -18.0pp toward R · 2008: -10.4pp · 2024: -28.4pp
- All cycles
- 2024: R+28.4 2020: R+19.2 2016: R+20.4 2012: R+16.6 2008: R+10.4
Not yet ingested
- Civics
- —
Market trends
- HPI YoY
- ▲ 21.77%
- Current HPI
- 340.4255
- Rent YoY
- ▼ -1.54%
- Metro
- Cape Coral-Fort Myers, FL
- State GDP YoY
- ▲ 3.28%
- F500 in state
- 36
Industry mix (Fortune 500 HQ in FL)
| Industry | F500 HQs | Revenue |
|---|---|---|
| Industrial Technology | 2 | $29B |
|
||
| Insurance | 2 | $17B |
|
||
| Retail | 1 | $60B |
|
||
| Technology Distribution | 1 | $58B |
|
||
| Homebuilding | 1 | $35B |
|
||
| Technology Manufacturing | 1 | $35B |
|
||
Price history
+986.5% since first listed6 events — show timeline
- 2026-05-08 Pending — NAPLESMLS
- 2026-04-29 Listed $265,097 NAPLESMLS
- 2025-10-06 Sold (Public Records) $224,000 Public Records
- 2022-07-06 Sold (Public Records) $244,000 Public Records
- 2016-01-08 Sold (Public Records) $2,000,000 Public Records
- 2005-02-11 Sold (Public Records) $24,400 Public Records
Property tax history
+19.1%/yrLatest (2025): $497 · +11.9% YoY. Source: county tax records.
Cash-flow waterfall
monthlySold comps — $/sqft
last 12 mo · ≤1 miLoading sold comps…