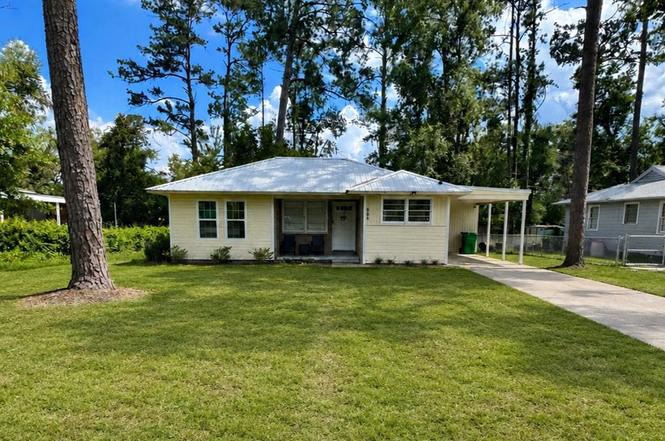
803 Ridgeway Dr · Valdosta, GA
Flood risk 1/10 · Minimal
- FEMA flood zone
- X (unshaded)
- Chance of flooding over 30 yrs
- 0.0%
- Est. flood insurance / yr
- $507 – $1,088
Fire risk 3/10 · Minor
- Est. fire insurance / yr
- $963 – $1,789
Heat risk 8/10 · Major
- Hot days now (above 108°F)
- 7 days/yr
- Hot days in 30 yrs
- 19 days/yr
Wind risk 8/10 · Major
- Chance of severe wind over 30 yrs
- 99.0%
Air-quality risk 6/10 · Moderate
- Unhealthy air days now
- 11 days/yr
- Unhealthy air days in 30 yrs
- 12 days/yr
Risk factors via First Street. Map © Google.
Why this score? — see what drove the D+ grade
The composite is a weighted blend of 9 inputs, each scored 0–100. Each bar is that input's sub-score; the figure is the points it added to the 100-point composite (weight × sub-score).
- ARV discount +14.7/15.0
- Cash flow +14.5/30.0
- Rent growth +4.6/5.0
- DSCR +4.4/10.0
- 1% rule +3.1/10.0
- Livability +3.0/5.0
- Condition / age +2.5/5.0
- Schools +1.5/10.0
- Appreciation +0.0/10.0
$119,900
🖨 Deal sheet 📄 Offer letter ✓ Due diligence
Listing remarks
Newly renovated 2 bedroom, 1 bathroom home within walking distance of VSU! This move-in ready home features new flooring throughout, an updated kitchen with new cabinets, countertops, and a tile backsplash, plus a renovated bathroom with a custom tile shower surround. Additional features include washer and dryer hookups, a covered carport, and a spacious backyard with mature shade trees, providing plenty of room to relax, entertain, or enjoy the outdoors. Whether you're a first-time homebuyer, a VSU parent looking for student housing, or an investor seeking a turnkey rental property, this home is an excellent opportunity.
Key facts
- Spacious backyard
- Covered carport
- New flooring
Tags
Property features AI
Exterior
- Utilities: Public water; Public sewer
- Home design: Single-family residence; One story; Residential property
- Exterior features: Approximately 0.24-acre lot; Zoned R-6
Interior
- Bathrooms: 1 full bathroom
- Interior features: Dishwasher; Refrigerator
Neighborhood map
What this means for you Summary
Snapshot
- This is a 2-bed/1.0-bath single-family listed at $120k.
Deal economics
- At list price, monthly cash flow is $26 ($311/yr) — positive.
- The deal already cash-flows at list — no discount required.
- To meet the 1% rule (rent ≥ 1% of price), the offer needs to be $97k (19.3% below list).
- Recommended offer: $97k (19.3% below list) — sets the bar for 1% rule.
- Cap rate 6.6% vs local median 4.3% in Valdosta — top-decile yield for the area; either an underpriced asset or a hidden risk that comps aren't pricing in. Stress-test before assuming the spread holds.
Location & tenants
- Location reads 60/100 on livability (#392 in GA) — a middle-class / working-renter tenant base. Strengths: cost of living A+, health & safety A+, housing A-; Watch: schools F, crime F, amenities F.
- Valdosta City (urban): math 15% / reading 22% proficiency, ranked #149 of 174 in GA (top 86%) — low school quality limits family demand, transient renter base, plan for 1-2y turnover; 74% free/reduced lunch — lower-income household profile, screen leases tightly.
- Market conditions: Rents rising fast (+8.3%/yr); 198 active listings in the ZIP; 32 comparable units currently listed for rent nearby; rentals at typical pace (median 21d on market — plan ~3-4 weeks tenant-placement turnaround); lower-income renter base — watch delinquency; 896 units permitted in Lowndes County in 2024 (0 in 5+ unit buildings).
- This rent runs 32% of the median local income ($36k/yr) — at the standard rent-burdened threshold; future hikes will face affordability resistance.
Forward outlook
- Local home prices are declining (-3.0%/yr); year-one equity from $829 of loan paydown is wiped out by about $4k of value loss. Plan a longer hold.
- Lowndes County population projected at +10% by 2050 — modest demand growth; plan on rents tracking national, not racing it.
Negotiation context
- Only 2 days on market — expect competitive offers; lowballing is unlikely to land.
- 2 sale attempts with the ask held roughly flat each time — persistent listings suggest the price (not the market) is what's stuck; bring a comps-based counter.
- Current owner paid $80k; 50% above their basis — modest negotiation headroom, anchor on the comps not their cost.
Risks & watch-outs
- Climate carrying-cost: severe wind risk, 99% chance of damaging wind over 30y; extreme-heat days projected 7→19/yr by 2055 (HVAC capex compounding) — expect insurance premiums to compound above CPI over the hold.
Questions for the listing agent
- Built in 1973 — when were the roof, HVAC, electrical panel, plumbing, and water heater last replaced?
- Is there a deadline driving the sale (1031 exchange, divorce, estate, relocation)? That informs how much negotiation room exists.
- Schools are F-rated, which usually means shorter tenancies and higher turnover. Who's the typical renter profile here, and what's been the actual vacancy rate?
- Crime grade is F in this area — have there been break-ins, vandalism, or insurance claims at this property in the last 3 years? What carrier currently insures it and at what premium?
- The area grade is low — what's the realistic commute time and amenity access for the typical tenant pool here? Any planned neighborhood developments (good or bad) we should know about?
- What's the average days-on-market for RENTAL listings here right now (not sales)? A rising rental-DOM trend means longer vacancies and softer asking-rent achievability than the comps imply.
- What's the recent tenant-quality profile in this submarket — average credit score on applications, eviction rate, late-payment / NSF rate, and stable-employment percentage? A property-management company in the area should have these aggregated.
- How much new for-sale + rental construction is in the pipeline within 1–3 miles? Heavy new supply typically softens prices + rents 12–24 months out; constrained supply supports both.
Investment metrics
- 1% rule
- 0.81% ✗
- Cap rate
- 6.55%
- Cash-on-cash
- 0.93%
- DSCR
- 1.04
- GRM
- 10.3
CMA / ARV
- ARV (on-the-fly)
- $142,912
- Comps found
- 12
Show comp detail 12 sales within ~0.75 mi
| Address | Dist | Beds/Ba | Sqft | Sold | Price | $/sf | Match |
|---|---|---|---|---|---|---|---|
| 1811 Canterbury Dr | 0.33mi | 3/1.0 (+1) | 922 (-1%) | 6mo | $191,900 | $208 | 74 |
| 812 Poplar Dr | 0.07mi | 3/1.0 (+1) | 1,042 (+12%) | 10mo | $79,900 | $77 | 63 |
| 507 Pinetree Rd | 0.28mi | 3/2.0 (+1) | 951 (+2%) | 13mo | $146,900 | $154 | 63 |
| 931 Ridgewood Dr | 0.35mi | 2/1.0 | 836 (-10%) | 6mo | $60,000 | $72 | 62 |
| 1115 Albert Rd | 0.41mi | 2/1.0 | 1,008 (+9%) | 11mo | $100,000 | $99 | 58 |
| 1108 W Alden Ave | 0.38mi | 3/2.0 (+1) | 1,009 (+9%) | 4mo | $70,000 | $69 | 56 |
| 1116 Albert Rd | 0.41mi | 2/1.0 | 997 (+7%) | 18mo | $50,000 | $50 | 53 |
| 1331 B Edgewood Dr Unit B | 0.34mi | 2/2.5 | 1,064 (+15%) | 4mo | $315,000 | $296 | 51 |
| 1813 Canterbury Dr | 0.34mi | 3/1.0 (+1) | 1,058 (+14%) | 18mo | $165,000 | $156 | 41 |
| 1215 Melissa Dr | 0.69mi | 3/1.5 (+1) | 1,014 (+9%) | 10mo | $80,000 | $79 | 37 |
| 2014 Delvid Ave | 0.69mi | 3/2.0 (+1) | 1,050 (+13%) | 8mo | $210,000 | $200 | 30 |
| 701 Azalea Cir | 0.66mi | 3/2.0 (+1) | 1,066 (+15%) | 14mo | $174,900 | $164 | 24 |
Match score weights: distance 35% · size 25% · config 20% · recency 20%. Top-matched comps best support the ARV.
Projected returns pro-forma
-3.0% appreciation · 8.0% rent growth · sell at horizon
- IRR
- -9.9%
- Equity multiple
- 0.62×
- Total profit
- $-12,704
- Equity at exit
- $17,877
- IRR
- 4.8%
- Equity multiple
- 1.42×
- Total profit
- $14,182
- Equity at exit
- $10,367
Cash invested: $33,572 (down + closing). Projections, not guarantees.
Landlord ↔ Tenant lean methodology
- Overall (STATE)
- 90 Strongly Landlord-Friendly
- State Georgia
- 90 Strongly Landlord-Friendly · R+3
- County
- — inherits STATE
- City
- — inherits STATE
ZIP-level market 31601
- Home prices YoY
- -31.2%
- Rents YoY
- 8.3%
- Active inventory
- 198
- Price-to-rent
- 10.3×
Monthly cashflow live
- Estimated rent
- $968 high interval (Pro) →
- Mortgage (P&I)
- −$629
- Tax from tax record
- −$60 /mo · $722/yr
- Insurance
- −$50
- HOA
- −$0
- Vacancy / Maint / Mgmt
- −$203
- Net cashflow
- $26
Break-even live
UW: 25.0% down · 7.5% · 30yr · 1.5% tax · 5.0% vac · 8.0% maint · 8.0% mgmt
Financing live
Cash to close
- Down payment
- $29,975
- Closing costs
- $3,597
- Reserves months
- —
- Total cash needed
- —
Loan-product check · same deal, 3 products live
Conventional
25% down · 7.5% · 30yr
- Down + closing
- —
- Monthly P&I
- —
- Monthly cashflow
- —
- DSCR
- —
- Eligible?
- —
Personal DTI + credit; lowest rate.
DSCR
20% down · 8.5% · 30yr
- Down + closing
- —
- Monthly P&I
- —
- Monthly cashflow
- —
- DSCR
- —
- Eligible?
- —
No personal income docs; deal must DSCR.
Hard money
10% down · 12.0% · 12mo
- Down + closing
- —
- Monthly P&I
- —
- Monthly cashflow
- —
- DSCR
- —
- Eligible?
- —
Short-term bridge; refi at stabilization.
Rent comps 32 comps
| Address | Beds | Baths | Sqft | Rent | $/sqft | DOM | Units | Dist |
|---|---|---|---|---|---|---|---|---|
| 1400 Baytree Dr Valdosta, GA | 2.0–4.0 | 2.0–4.0 | 1277 | $549 | $0.43 | 43d | 1 | 0.08mi |
| 1307 Melody Ln Valdosta, GA | 2.0 | 1.0 | 1025 | $1,050 | $1.02 | 21d | 1 | 0.19mi |
| 1314 Hastings Dr Apt A2 Valdosta, GA | 2.0 | 2.5 | 1100 | $995 | $0.90 | 21d | 1 | 0.31mi |
| 1455 Green St Unit A Valdosta, GA | 2.0 | 1.5 | 1048 | $900 | $0.86 | 21d | 1 | 0.37mi |
| 1537 Woodard St Unit B Valdosta, GA | 2.0 | 1.5 | 1020 | $900 | $0.88 | 21d | 1 | 0.39mi |
| 1531 Woodard St Apt C3 Valdosta, GA | 2.0 | 2.5 | 900 | $995 | $1.11 | 21d | 1 | 0.41mi |
| 1602 Victory St Unit 1602 C Valdosta, GA | 2.0 | 2.0 | 865 | $795 | $0.92 | 21d | 1 | 0.41mi |
| 1603 Victory St Valdosta, GA | 2.0 | 2.0 | 874 | $795 | $0.91 | 21d | 6 | 0.42mi |
| 1709 Azalea Dr Apt B Valdosta, GA | 2.0 | 1.0 | 775 | $1,250 | $1.61 | 21d | 1 | 0.43mi |
| 1509 Pine St Valdosta, GA | 2.0 | 1.0–1.5 | 950 | $1,140 | $1.20 | 21d | 2 | 0.51mi |
| 1755 Poplar St Unit B Valdosta, GA | 2.0 | 1.0 | 840 | $950 | $1.13 | 21d | 1 | 0.55mi |
| 808 Lilly St Apt B Valdosta, GA | 3.0 | 1.0 | 872 | $895 | $1.03 | 43d | 1 | 0.60mi |
| 507 Roberts St Apt B Valdosta, GA | 2.0 | 2.0 | 1114 | $1,200 | $1.08 | 21d | 1 | 0.66mi |
| 2219 White Oak Dr Valdosta, GA | 2.0 | 1.0 | 1100 | $2,250 | $2.05 | 43d | 1 | 0.72mi |
| 1505 Lankford Dr Valdosta, GA | 2.0–3.0 | 2.0–3.0 | 1166 | $1,137 | $0.97 | 21d | 1 | 0.81mi |
| 805 Harmon Dr Valdosta, GA | 2.0–3.0 | 2.0–3.0 | 1100 | $1,425 | $1.30 | 21d | 6 | 0.84mi |
| 114 High St Valdosta, GA | 1.0 | 1.0 | 609 | $650 | $1.07 | 43d | 1 | 0.84mi |
| 1704 N Patterson St Unit 4 Valdosta, GA | 2.0 | 2.0 | 1100 | $950 | $0.86 | 43d | 1 | 0.87mi |
| 1029 Johnson St Valdosta, GA | 2.0 | 1.0 | 986 | $900 | $0.91 | 43d | 1 | 0.88mi |
| 200 W Cranford Ave Valdosta, GA | 2.0 | 2.0 | 950 | $1,225 | $1.29 | 21d | 3 | 0.90mi |
| 1506 Slater St Unit 7 Valdosta, GA | 2.0 | 1.5 | 1037 | $695 | $0.67 | 43d | 1 | 0.91mi |
| 1004 N Oak St Valdosta, GA | 1.0–2.0 | 1.0 | 866 | $750 | $0.87 | 21d | 3 | 0.92mi |
| 1005 N Oak St Valdosta, GA | 3.0 | 1.0 | 1087 | $795 | $0.73 | 43d | 1 | 0.95mi |
| 1010 N Toombs St Valdosta, GA | 2.0 | 1.5 | 1056 | $1,000 | $0.95 | 21d | 3 | 0.96mi |
| 207 E Moore St Unit L Valdosta, GA | 1.0 | 1.0 | 850 | $700 | $0.82 | 21d | 1 | 1.02mi |
| 207 E Moore St Unit J Valdosta, GA | 1.0 | 1.0 | 850 | $700 | $0.82 | 43d | 1 | 1.02mi |
| 200 W Adair St Unit A9 Valdosta, GA | 1.0 | 1.0 | 900 | $895 | $0.99 | 21d | 1 | 1.11mi |
| 304 E Cranford Ave Valdosta, GA | 2.0 | 1.0 | 980 | $850 | $0.87 | 43d | 1 | 1.24mi |
| 205 E Adair St Unit 4 Valdosta, GA | 1.0 | 1.0 | 700 | $550 | $0.79 | 43d | 1 | 1.31mi |
| 1609 Marion St Unit B Valdosta, GA | 2.0 | 1.0 | 945 | $895 | $0.95 | 21d | 1 | 1.35mi |
| 604 E Brookwood Dr Valdosta, GA | 2.0 | 1.0 | 720 | $995 | $1.38 | 43d | 1 | 1.40mi |
| 615 Vallotton Dr Unit A3 Valdosta, GA | 1.0 | 1.0 | 568 | $550 | $0.97 | 21d | 1 | 1.48mi |
Listing history 3 events
-
2026-06-19days on market $119,900 Active 2 DOM
-
2026-06-17remarks 629-char remark
-
2026-06-17$119,900 Active 1 DOM
ⓘ Source: listings_history table (triggers on properties + properties_extension) + one-shot
backfill from property_details.listing_events for pre-trigger history.
Tax reassessment forecast GA · Resets to sale price
- Current annual tax
- $722 · $60/mo
- Projected year-2 tax
- $1,103 · $92/mo
- Expected delta
- +$381/yr (+$32/mo · 52.8%)
ⓘ Screening estimate from a state-policy table — verify with the county assessor before closing.
Climate risk First Street
- Flood 1/10 Low FEMA zone X (unshaded) · 0% chance over 30 yrs
- Wildfire 3/10 Moderate
- Heat 8/10 Severe 7 d/yr ≥108°F today · 19 d/yr by 30 yrs out
- Wind 8/10 Severe 99% chance of damaging wind over 30 yrs
- Air quality 6/10 Major 11 unhealthy d/yr today · 12 by 30 yrs out
Nearby sold comps map
Loading sold comps map…
Walkable amenities ~0.75 mi
Loading nearby amenities…
Taxation est. · year 1
- Rental income
- $11,617
- − Mortgage interest
- −$6,716
- − Property taxes
- −$722
- − Insurance
- −$600
- − Repairs & maintenance
- −$929
- − Management
- −$929
- − Depreciation
- −$3,488
- Taxable loss
- −$1,767
- Est. tax savings @ 24.0%
- +$424
- After-tax cash flow
- $735/yr
For passive investors: Depreciation is non-cash, so a rental often shows a tax loss while cash-flowing — sheltering income. Rental losses are passive: they offset passive income freely, and up to $25,000/yr can offset ordinary (W-2) income if you actively participate and your MAGI is under $100k (phasing out to $0 by $150k); unused losses carry forward. On sale, claimed depreciation is recaptured at up to 25%, and gains may owe capital-gains tax (a 1031 exchange can defer both). Figures are a year-1 estimate at your 24.0% rate — not tax advice; consult a CPA.
Schools (NCES district)
- District
- Valdosta City
- NCES district ID
- 1305310
- Math proficiency
- 15% ▼ -12.00%
- Reading proficiency
- 22% ▼ -7.00%
- Median HH income
- $30,634
- Composite
- 14.79/100
- National rank
- #9388
- State rank
- #149 of 174 in GA
Livability — Valdosta
- Score
- 60/100
- State rank
- #392
- US rank
- #19544
Category grades
Schools grade is shown separately in the Schools card above.
Census & demographics
- Census place
- Valdosta, GA
- County
- Lowndes County · 107,801 people
- City population
- 91,859
- Metro
- Valdosta, GA
- Population (ZIP)
- 31,302
- Household income
- $36,111
- Rent vs Own
- Severe rent burden
- 2016.0
Population outlook (Lowndes County) Hauer SSP2
- Today (2025)
- 120,348 people
- By 2030
- 123,469 · +2.6%
- By 2040
- 128,482 · +6.8%
- By 2050
- 131,907 · +9.6%
- By 2075
- 139,080 · +15.6%
- By 2100
- 133,649 · +11.1%
Race, ethnicity, and origin ACS 2023
- Neighborhood character
- Diverse neighborhood (Simpson 0.57)
- Race & ethnicity
- Black 57% White 31% Hispanic / Latino 8% Two or more races 4% Asian 1%
- Hispanic origin (detail)
- Mexican 4%
- Common ancestry
- Slovak 1% Italian 1%
- Foreign-born
- 4% · Canada, South Korea
- Languages at home
- 92% English-only · Spanish 7% Korean 1%
Political lean MEDSL · Lowndes
- 2024 margin
- R (+18.0) · D 40.8% · R 58.8%
- 2008→2024 swing
- -8.6pp toward R · 2008: -9.4pp · 2024: -18.0pp
- All cycles
- 2024: R+18.0 2020: R+12.0 2016: R+18.2 2012: R+10.5 2008: R+9.4
Not yet ingested
- Civics
- —
Market trends
- HPI YoY
- ▼ -55.12%
- Current HPI
- 121.5948
- Rent YoY
- ▲ 8.34%
- Metro
- Valdosta, GA
- State GDP YoY
- ▲ 2.66%
- F500 in state
- 28
Industry mix (Fortune 500 HQ in GA)
| Industry | F500 HQs | Revenue |
|---|---|---|
| Paper / Packaging | 2 | $29B |
|
||
| Retail | 1 | $160B |
|
||
| Transportation / Logistics | 1 | $91B |
|
||
| Airlines | 1 | $62B |
|
||
| Consumer Goods | 1 | $47B |
|
||
| Utilities | 1 | $25B |
|
||
Price history
+1498.7% since first listed7 events — show timeline
- 2026-06-12 Listed $119,900 SGMLS
- 2025-09-18 Rental Removed $995 APPFOLIO
- 2025-08-20 Price Changed $995 APPFOLIO
- 2025-07-17 Listed for Rent $1,050 APPFOLIO
- 2025-06-10 Sold (Public Records) $80,000 Public Records
- 1998-11-23 Sold (Public Records) $34,000 Public Records
- 1988-08-31 Sold (Public Records) $7,500 Public Records
Property tax history
+0.9%/yrLatest (2025): $722 · +3.2% YoY. Source: county tax records.
Cash-flow waterfall
monthlySold comps — $/sqft
last 12 mo · ≤1 miLoading sold comps…