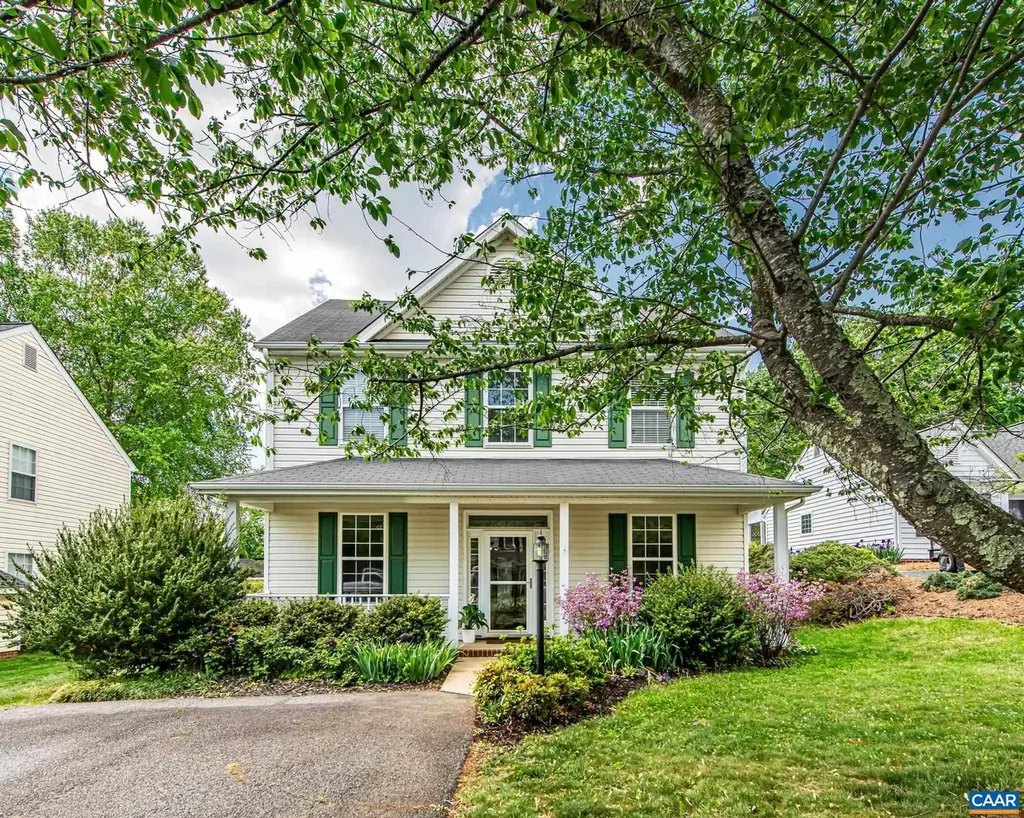
3244 Timberwood Pkwy · Hollymead, VA
Flood risk 1/10 · Minimal
- FEMA flood zone
- X (unshaded)
- Chance of flooding over 30 yrs
- 0.0%
- Est. flood insurance / yr
- $473 – $860
Fire risk 4/10 · Minor
- Est. fire insurance / yr
- $666 – $1,236
Heat risk 6/10 · Moderate
- Hot days now (above 103°F)
- 7 days/yr
- Hot days in 30 yrs
- 17 days/yr
Wind risk 2/10 · Minimal
- Chance of severe wind over 30 yrs
- 2.0%
Air-quality risk 1/10 · Minimal
- Unhealthy air days now
- 0 days/yr
- Unhealthy air days in 30 yrs
- 0 days/yr
Risk factors via First Street. Map © Google.
Why this score? — see what drove the D- grade
The composite is a weighted blend of 9 inputs, each scored 0–100. Each bar is that input's sub-score; the figure is the points it added to the 100-point composite (weight × sub-score).
- ARV discount +15.0/15.0
- Cash flow +6.6/30.0
- Schools +6.2/10.0
- Rent growth +3.5/5.0
- Livability +3.4/5.0
- Condition / age +2.5/5.0
- 1% rule +1.5/10.0
- DSCR +0.9/10.0
- Appreciation +0.0/10.0
$413,000
🖨 Deal sheet 📄 Offer letter ✓ Due diligence
Listing remarks
Welcome to this well-maintained single-family home in the desirable Forest Lakes subdivision. The main level features an open floor plan with abundant natural light. A walk-out patio and covered pergola extend the living space to the outdoors, providing an ideal setting for relaxation and gatherings. Upstairs, the primary bedroom offers double doors, cathedral ceilings, a generous en-suite bath, and a walk-in closet. This property is competitively priced and move-in ready. Residents of Forest Lakes benefit from amenities such as a swimming pool, tennis courts, and numerous walking trails. https://forestlakes.net/
Key facts
- 6,098 sq ft lot
- 2 parking spots
- Community pool
Property features AI
Finance
- HOA & community: Homeowners association with quarterly fee; Association fee $348 quarterly; Association amenities include boat dock, clubhouse, sport court, fitness center, playground, pool, sports fields, tennis courts, trails, and water access
Exterior
- Parking: Carport with 2 spaces
- Security: Surveillance system
- Utilities: Public water; Public sewer; Cable available; Fiber optic available
- Home design: Detached property; Two-story home; Located on a cul-de-sac
- Construction: Stick built construction; Block foundation
- Exterior features: Community pool; Community dock; Association amenities: clubhouse, sport court, fitness center, playground, sports fields, tennis courts, trails, water access
Interior
- Kitchen: Kitchen on first level
- Bedrooms: Primary bedroom on second level; Additional bedrooms on second level
- Bathrooms: Two full bathrooms; One half bathroom (main/first level)
- Heating & cooling: Heat pump heating; Heat pump cooling
- Interior features: Entrance foyer; Home office; Gas log fireplace
Neighborhood map
What this means for you Summary
Snapshot
- This is a 3-bed/2.5-bath single-family listed at $413k.
Deal economics
- At list price, monthly cash flow is $-680 ($-8k/yr) — negative.
- To cash-flow at today's rent, offer at most $293k (29.1% below list).
- To meet the 1% rule (rent ≥ 1% of price), the offer needs to be $267k (35.4% below list).
- Recommended offer: $267k (35.4% below list) — sets the bar for 1% rule.
- Cap rate 4.3% vs local median 2.8% in Hollymead — top-decile yield for the area; either an underpriced asset or a hidden risk that comps aren't pricing in. Stress-test before assuming the spread holds.
Location & tenants
- Location reads 68/100 on livability (#271 in VA) — a middle-class / working-renter tenant base. Strengths: employment A+, housing A+, crime A; Watch: amenities F, commute F, cost of living D-.
- Albemarle County Public School District (rural): math 66% / reading 77% proficiency, ranked #14 of 131 in VA (top 11%) — strong family-tenant draw, lease renewals of 3-5y typical.
- Zoned schools: Baker-Butler Elem (math 67% / reading 78%, grade A, #267 of 1,108 statewide, top 24%, 740 students, 28% FRL); Lakeside Middle (math 76% / reading 84%, grade A+, #24 of 342 statewide, top 8%, 513 students, 23% FRL); Albemarle High (math 70% / reading 85%, grade A-, #83 of 319 statewide, top 28%, 1,987 students, 34% FRL).
- Market conditions: Rents rising fast (+4.0%/yr); 303 active listings in the ZIP; 11 comparable units currently listed for rent nearby; rentals at typical pace (median 21d on market — plan ~3-4 weeks tenant-placement turnaround); high-income renter base; 810 units permitted in Albemarle County in 2024 (188 in 5+ unit buildings).
Forward outlook
- Local home prices are declining (-3.0%/yr); year-one equity from $3k of loan paydown is wiped out by about $12k of value loss. Plan a longer hold.
- Albemarle County population projected at +24% by 2050 — long-run rental-demand tailwind backs the buy-and-hold thesis.
Negotiation context
- Only 1 days on market — expect competitive offers; lowballing is unlikely to land.
- 3 sale attempts since 14y ago with the ask held roughly flat each time — persistent listings suggest the price (not the market) is what's stuck; bring a comps-based counter.
Risks & watch-outs
- Climate carrying-cost: extreme-heat days projected 7→17/yr by 2055 (HVAC capex compounding) — expect insurance premiums to compound above CPI over the hold.
Questions for the listing agent
- What do current leases actually rent for vs. the listed asking? Can we see a recent rent roll and the last 12 months of T-12 income?
- What does the HOA fee cover, when was the last increase, and are there any pending special assessments or reserve-fund shortfalls?
- Is there a deadline driving the sale (1031 exchange, divorce, estate, relocation)? That informs how much negotiation room exists.
- Schools are D-rated, which usually means shorter tenancies and higher turnover. Who's the typical renter profile here, and what's been the actual vacancy rate?
- The area grade is low — what's the realistic commute time and amenity access for the typical tenant pool here? Any planned neighborhood developments (good or bad) we should know about?
- What's the average days-on-market for RENTAL listings here right now (not sales)? A rising rental-DOM trend means longer vacancies and softer asking-rent achievability than the comps imply.
- What's the recent tenant-quality profile in this submarket — average credit score on applications, eviction rate, late-payment / NSF rate, and stable-employment percentage? A property-management company in the area should have these aggregated.
- How much new for-sale + rental construction is in the pipeline within 1–3 miles? Heavy new supply typically softens prices + rents 12–24 months out; constrained supply supports both.
Investment metrics
- 1% rule
- 0.65% ✗
- Cap rate
- 4.32%
- Cash-on-cash
- -7.06%
- DSCR
- 0.69
- GRM
- 12.9
CMA / ARV
- ARV (median comp)
- $501,234
- List price
- $413,000
- Delta
- -17.60%
- Verdict
- UNDERPRICED
- Comps
- 20 within 1.0 mi
Show comp detail 12 sales within ~0.75 mi
| Address | Dist | Beds/Ba | Sqft | Sold | Price | $/sf | Match |
|---|---|---|---|---|---|---|---|
| 3244 Timberwood Pkwy | 0.00mi | 3/2.5 | 1,738 (0%) | 1mo | $413,000 | $238 | 100 |
| 3260 Timberwood Pkwy | 0.04mi | 3/2.5 | 1,620 (-7%) | 2mo | $408,000 | $252 | 86 |
| 2090 Tavernor Ln | 0.33mi | 3/2.0 | 1,752 (+1%) | 10mo | $519,000 | $296 | 73 |
| 3256 Timberwood Pkwy | 0.02mi | 4/2.5 (+1) | 1,993 (+15%) | 0mo | $544,000 | $273 | 69 |
| 2006 Jefferson Ct | 0.44mi | 3/2.0 | 1,821 (+5%) | 12mo | $430,000 | $236 | 60 |
| 2040 Whispering Woods Dr | 0.30mi | 4/2.5 (+1) | 1,962 (+13%) | 7mo | $569,900 | $290 | 54 |
| 1889 Steeplechase Run | 0.69mi | 4/2.5 (+1) | 1,666 (-4%) | 3mo | $420,000 | $252 | 53 |
| 3200 Malbon Dr | 0.52mi | 4/2.5 (+1) | 1,936 (+11%) | 4mo | $505,000 | $261 | 49 |
| 2017 Locke Ln | 0.45mi | 4/2.5 (+1) | 1,814 (+4%) | 22mo | $453,000 | $250 | 48 |
| 2067 Winterfield Cir | 0.66mi | 3/2.0 | 1,564 (-10%) | 5mo | $549,000 | $351 | 47 |
| 3152 Saddlebrook Ln | 0.71mi | 4/2.5 (+1) | 1,758 (+1%) | 17mo | $515,000 | $293 | 46 |
| 3104 Mollifield Ln | 0.68mi | 3/2.5 | 1,545 (-11%) | 12mo | $410,000 | $265 | 40 |
Match score weights: distance 35% · size 25% · config 20% · recency 20%. Top-matched comps best support the ARV.
Projected returns pro-forma
-3.0% appreciation · 4.04% rent growth · sell at horizon
- IRR
- -27.5%
- Equity multiple
- 0.07×
- Total profit
- $-107,432
- Equity at exit
- $61,580
- IRR
- -22.4%
- Equity multiple
- -0.19×
- Total profit
- $-137,527
- Equity at exit
- $35,709
Cash invested: $115,640 (down + closing). Projections, not guarantees.
Landlord ↔ Tenant lean methodology
- Overall (STATE)
- 55 Moderately Landlord-Leaning
- State Virginia
- 55 Moderately Landlord-Leaning · D+2
- County
- — inherits STATE
- City
- — inherits STATE
ZIP-level market 22911
- Rents YoY
- 4.0%
- Active inventory
- 303
- Price-to-rent
- 12.9×
Monthly cashflow live
- Estimated rent
- $2,667 high interval (Pro) →
- Mortgage (P&I)
- −$2,166
- Tax from tax record
- −$333 /mo · $3,996/yr
- Insurance
- −$172
- HOA
- −$116
- Vacancy / Maint / Mgmt
- −$560
- Net cashflow
- $-680
Break-even live
UW: 25.0% down · 7.5% · 30yr · 1.5% tax · 5.0% vac · 8.0% maint · 8.0% mgmt
Financing live
Cash to close
- Down payment
- $103,250
- Closing costs
- $12,390
- Reserves months
- —
- Total cash needed
- —
Loan-product check · same deal, 3 products live
Conventional
25% down · 7.5% · 30yr
- Down + closing
- —
- Monthly P&I
- —
- Monthly cashflow
- —
- DSCR
- —
- Eligible?
- —
Personal DTI + credit; lowest rate.
DSCR
20% down · 8.5% · 30yr
- Down + closing
- —
- Monthly P&I
- —
- Monthly cashflow
- —
- DSCR
- —
- Eligible?
- —
No personal income docs; deal must DSCR.
Hard money
10% down · 12.0% · 12mo
- Down + closing
- —
- Monthly P&I
- —
- Monthly cashflow
- —
- DSCR
- —
- Eligible?
- —
Short-term bridge; refi at stabilization.
Rent comps 11 comps
| Address | Beds | Baths | Sqft | Rent | $/sqft | DOM | Units | Dist |
|---|---|---|---|---|---|---|---|---|
| 2217 Brindle Ln Charlottesville, VA | 4.0 | 3.5 | 2182 | $2,900 | $1.33 | 13d | 1 | 0.19mi |
| 3279 Arbor Trce Charlottesville, VA | 2.0 | 2.5 | 1641 | $2,100 | $1.28 | 43d | 1 | 0.29mi |
| 2132 Northside Dr Charlottesville, VA | 3.0 | 2.5 | 2075 | $3,550 | $1.71 | 13d | 1 | 0.63mi |
| 5025 Huntly Ridge St Charlottesville, VA | 1.0–3.0 | 1.0–2.0 | 1064 | $2,785 | $2.62 | 13d | 70 | 0.70mi |
| 2061 Lockwood Dr Charlottesville, VA | 3.0 | 2.5 | 1741 | $2,975 | $1.71 | 21d | 1 | 0.85mi |
| 1100 Monacan Ln Unit 00 1065005 Earlysville, VA | 2.0 | 2.0 | 1187 | $1,874 | $1.58 | 13d | 1 | 1.30mi |
| 1100 Monacan Ln Unit 00 1090207 Earlysville, VA | 2.0 | 2.0 | 1187 | $2,124 | $1.79 | 21d | 1 | 1.30mi |
| 1100 Monacan Ln Unit 00 1065101 Earlysville, VA | 3.0 | 2.0 | 1447 | $2,275 | $1.57 | 43d | 1 | 1.30mi |
| 1100 Monacan Ln Earlysville, VA | 3.0 | 2.0 | 1447 | $2,450 | $1.69 | 43d | 1 | 1.30mi |
| 1100 Monacan Ln Unit 00 1070308 Earlysville, VA | 3.0 | 2.0 | 1447 | $2,212 | $1.53 | 43d | 1 | 1.30mi |
| 1100 Monacan Ln Unit 00 1065308 Earlysville, VA | 3.0 | 2.0 | 1447 | $2,212 | $1.53 | 13d | 1 | 1.30mi |
HOA detail
- Monthly dues
- $116 · $1,392/yr
- Likely covers
- pool
Listing history 7 events
-
2026-05-03status Pending 620-char remark
-
2026-05-01$413,000 Active 620-char remark
-
2026-04-28historical $413,000 620-char remark
-
2012-11-19soldstatus $274,500
-
2012-09-24$275,000
-
2012-04-30soldstatus $269,000
-
2012-02-01$274,900
ⓘ Source: listings_history table (triggers on properties + properties_extension) + one-shot
backfill from property_details.listing_events for pre-trigger history.
Tax reassessment forecast VA · Resets to sale price
- Current annual tax
- $3,996 · $333/mo
- Projected year-2 tax
- $3,996 · $333/mo
- Expected delta
- $0/yr ($0/mo · -0.0%)
ⓘ Screening estimate from a state-policy table — verify with the county assessor before closing.
Climate risk First Street
- Flood 1/10 Low FEMA zone X (unshaded) · 0% chance over 30 yrs
- Wildfire 4/10 Moderate
- Heat 6/10 Major 7 d/yr ≥103°F today · 17 d/yr by 30 yrs out
- Wind 2/10 Low 2% chance of damaging wind over 30 yrs
- Air quality 1/10 Low 0 unhealthy d/yr today · 0 by 30 yrs out
Nearby sold comps map
Loading sold comps map…
Walkable amenities ~0.75 mi
Loading nearby amenities…
Taxation est. · year 1
- Rental income
- $32,000
- − Mortgage interest
- −$23,134
- − Property taxes
- −$3,996
- − Insurance
- −$2,065
- − Repairs & maintenance
- −$2,560
- − Management
- −$2,560
- − HOA
- −$1,392
- − Depreciation
- −$12,015
- Taxable loss
- −$15,722
- Est. tax savings @ 24.0%
- +$3,773
- After-tax cash flow
- $-4,390/yr
For passive investors: Depreciation is non-cash, so a rental often shows a tax loss while cash-flowing — sheltering income. Rental losses are passive: they offset passive income freely, and up to $25,000/yr can offset ordinary (W-2) income if you actively participate and your MAGI is under $100k (phasing out to $0 by $150k); unused losses carry forward. On sale, claimed depreciation is recaptured at up to 25%, and gains may owe capital-gains tax (a 1031 exchange can defer both). Figures are a year-1 estimate at your 24.0% rate — not tax advice; consult a CPA.
Schools (NCES district)
- District
- Albemarle County Public School District
- NCES district ID
- 5100090
- Math proficiency
- 66% ▼ -16.00%
- Reading proficiency
- 77% ▼ -2.00%
- Median HH income
- $67,851
- Composite
- 62.28/100
- National rank
- #698
- State rank
- #14 of 131 in VA
Livability — Hollymead
- Score
- 68/100
- State rank
- #271
- US rank
- #9656
Category grades
Schools grade is shown separately in the Schools card above.
Census & demographics
- Census place
- Hollymead, VA
- County
- Albemarle County · 129,350 people
- Metro
- Charlottesville, VA
- Population (ZIP)
- 19,107
- Household income
- $128,235
- Rent vs Own
- Severe rent burden
- 532.0
Population outlook (Albemarle County) Hauer SSP2
- Today (2025)
- 119,403 people
- By 2030
- 125,829 · +5.4%
- By 2040
- 137,705 · +15.3%
- By 2050
- 148,058 · +24.0%
- By 2075
- 172,223 · +44.2%
- By 2100
- 185,628 · +55.5%
Race, ethnicity, and origin ACS 2023
- Neighborhood character
- Predominantly White (74%)
- Race & ethnicity
- White 74% Two or more races 8% Black 7% Asian 7% Hispanic / Latino 6%
- Hispanic origin (detail)
- Mexican 1% Puerto Rican 1%
- Common ancestry
- Slovak 3% Romanian 3% Lithuanian 2%
- Foreign-born
- 10% · Canada, China, South Korea
- Languages at home
- 88% English-only · Other Indo-European 3% Spanish 3% Russian/Polish/Slavic 1%
Political lean MEDSL · Albemarle
- 2024 margin
- Solid D (+34.1) · D 66.3% · R 32.2% · Other 1.4%
- 2008→2024 swing
- +16.1pp toward D · 2008: 18.0pp · 2024: 34.1pp
- All cycles
- 2024: D+34.1 2020: D+33.5 2016: D+25.1 2012: D+12.0 2008: D+18.0
Not yet ingested
- Civics
- —
Market trends
- HPI YoY
- ▼ -236.54%
- Current HPI
- 220.3768
- Rent YoY
- ▲ 4.04%
- Metro
- Charlottesville, VA
- State GDP YoY
- ▲ 2.40%
- F500 in state
- 50
Industry mix (Fortune 500 HQ in VA)
| Industry | F500 HQs | Revenue |
|---|---|---|
| Aerospace / Defense | 4 | $236B |
|
||
| Technology / Defense | 3 | $32B |
|
||
| Financial Services | 2 | $176B |
|
||
| Utilities | 2 | $27B |
|
||
| Insurance | 2 | $25B |
|
||
| Technology | 2 | $15B |
|
||
Price history
+50.2% since first listed8 events — show timeline
- 2026-06-01 Sold (MLS) $413,000 CAAR
- 2026-05-03 Pending — CAAR
- 2026-05-01 Listed $413,000 CAAR
- 2026-04-28 Coming Soon $413,000 CAAR
- 2012-11-19 Sold (Public Records) $274,500 Public Records
- 2012-09-24 Listed $275,000 CAAR
- 2012-04-30 Sold (Public Records) $269,000 Public Records
- 2012-02-01 Listed $274,900 CAAR
Property tax history
+5.2%/yrLatest (2026): $3,996 · +3.0% YoY. Source: county tax records.
Cash-flow waterfall
monthlySold comps — $/sqft
last 12 mo · ≤1 miLoading sold comps…