6222 Saints Delight Rd · Georgetown, SC
Flood risk 1/10 · Minimal
- FEMA flood zone
- X (unshaded)
- Chance of flooding over 30 yrs
- 0.0%
- Est. flood insurance / yr
- $507 – $1,088
Fire risk 7/10 · Major
- Est. fire insurance / yr
- $783 – $1,453
Heat risk 9/10 · Severe
- Hot days now (above 111°F)
- 7 days/yr
- Hot days in 30 yrs
- 17 days/yr
Wind risk 8/10 · Major
- Chance of severe wind over 30 yrs
- 98.0%
Air-quality risk 2/10 · Minimal
- Unhealthy air days now
- 1 days/yr
- Unhealthy air days in 30 yrs
- 2 days/yr
Risk factors via First Street. Map © Google.
Why this score? — see what drove the D grade
The composite is a weighted blend of 9 inputs, each scored 0–100. Each bar is that input's sub-score; the figure is the points it added to the 100-point composite (weight × sub-score).
- Cash flow +15.0/30.0
- ARV discount +7.5/15.0
- 1% rule +5.0/10.0
- DSCR +5.0/10.0
- Livability +3.2/5.0
- Schools +2.7/10.0
- Rent growth +2.5/5.0
- Condition / age +2.5/5.0
- Appreciation +0.0/10.0
$35,000
🖨 Deal sheet (PDF) 📄 Offer letter ✓ Due diligence
Listing remarks MLS
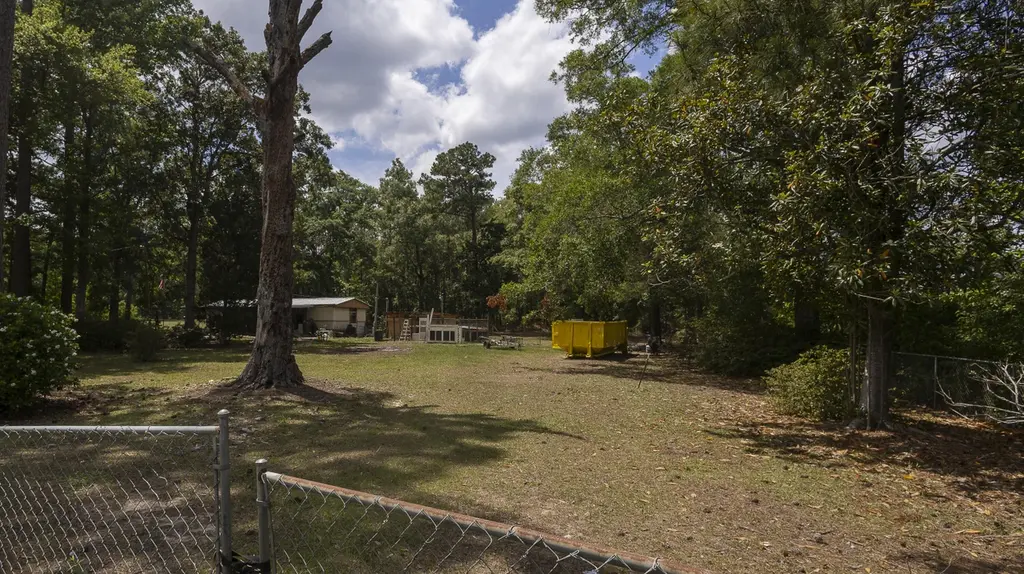
Situated on 2 acres with mature trees and a fenced yard, this 2-bedroom, 2-bath mobile home offers a peaceful country setting with plenty of outdoor space to enjoy. The home features a covered front porch and rear porch, providing the perfect spots for relaxing and taking in the natural surroundings. Conveniently located just 9 miles from downtown Andrews and 14 miles from Georgetown, you'll enjoy rural living with easy access to shopping, dining, and local amenities. The home is in good condition for its age but could benefit from some updates and is being sold strictly AS-IS. This property is Lot #1 of a three-parcel offering that must be purchased together. Included tax map numbers are TMS #01-0423-005-00-00, #01-0423-022-00-00, and #01-0423-021-00-00. The seller will not subdivide the parcels due to access consideration.
Key facts
- Covered front porch
- Rural living
- Fenced yard
Tags
Property features AI
Exterior
- Parking: Off-street parking
- Utilities: Septic tank; Dominion Energy service
- Home design: Manufactured/mobile home (single wide); One story; Residential property
- Construction: Metal roof; Fee simple ownership
- Exterior features: Chain link and metal enclosure fencing; Wire fencing; Workshop on property; Wooded lot with 2–5 acres
Interior
- Kitchen: Electric range
- Bedrooms: 2 bedrooms (master bedroom on lower level)
- Flooring: Carpet; Vinyl
- Bathrooms: 2 bathrooms
- Heating & cooling: Heat pump heating; Electric heating; Central air conditioning
- Interior features: Blown ceiling insulation; Eat-in kitchen; Family room
- Laundry & utility: Washer hookup; Electric dryer hookup
Neighborhood map
What this means for you Summary
Snapshot
- This is a 2-bed/2.0-bath manufactured listed at $35k.
Deal economics
- At list price, monthly cash flow is $1k ($17k/yr) — positive.
- The deal already cash-flows at list — no discount required.
- Meets the 1% rule at list price ($2k rent vs $35k).
- Recommended offer: $34k (1.5% below list) — sets the bar for market timing.
- Cap rate 55.3% vs local median 4.7% in Georgetown — top-decile yield for the area; either an underpriced asset or a hidden risk that comps aren't pricing in. Stress-test before assuming the spread holds.
Location & tenants
- Location reads 65/100 on livability (#141 in SC) — a middle-class / working-renter tenant base. Strengths: cost of living A+, housing A+, health & safety A+; Watch: amenities D, crime F, commute F.
- Georgetown 01 (town): math 26% / reading 38% proficiency, ranked #51 of 80 in SC (top 64%) — families likely to look elsewhere, expect single-tenant / working-renter base with shorter leases.
- Zoned schools: Pleasant Hill Elementary (math 42% / reading 42%, grade F, #256 of 597 statewide, top 45%, 288 students, 100% FRL); Waccamaw Middle (math 39% / reading 55%, grade D+, #43 of 229 statewide, top 18%, 343 students, 42% FRL); Andrews High (math 27% / reading 77%, grade D+, #142 of 196 statewide, top 74%, 519 students, 100% FRL) — zoned schools average 81% FRL vs 59% district-wide (22 pts higher); higher-poverty schools than district average — tighter screening recommended.
- Zoned-school proficiency averages 47% at this address vs 32% district-wide (+15 pts) — the actual schools serving this property are materially stronger than the Georgetown 01 average implies; a family-tenant draw the district grade alone would hide.
- Market conditions: 409 active listings in the ZIP; 323 units permitted in Georgetown County in 2024 (0 in 5+ unit buildings).
Forward outlook
- Local home prices are declining (-3.0%/yr); year-one equity from $242 of loan paydown is wiped out by about $1k of value loss. Plan a longer hold.
- At projected returns (-3.0% appreciation + 3.0% rent growth), your $10k cash investment doubles in ~1 year — after that, you're playing with house money.
Negotiation context
- It's been on market 15 days — a 2% lower offer ($34k) is reasonable based on typical stale-listing flexibility.
- 3 sale attempts since 6y ago with the ask held roughly flat each time — persistent listings suggest the price (not the market) is what's stuck; bring a comps-based counter.
- Current owner paid $30k; 17% above their basis — modest negotiation headroom, anchor on the comps not their cost.
Risks & watch-outs
- Climate carrying-cost: severe wind risk, 98% chance of damaging wind over 30y; major wildfire risk; extreme-heat days projected 7→17/yr by 2055 (HVAC capex compounding) — expect insurance premiums to compound above CPI over the hold.
Questions for the listing agent
- Is there a deadline driving the sale (1031 exchange, divorce, estate, relocation)? That informs how much negotiation room exists.
- Schools are F-rated, which usually means shorter tenancies and higher turnover. Who's the typical renter profile here, and what's been the actual vacancy rate?
- Crime grade is F in this area — have there been break-ins, vandalism, or insurance claims at this property in the last 3 years? What carrier currently insures it and at what premium?
- The area grade is low — what's the realistic commute time and amenity access for the typical tenant pool here? Any planned neighborhood developments (good or bad) we should know about?
- What's the average days-on-market for RENTAL listings here right now (not sales)? A rising rental-DOM trend means longer vacancies and softer asking-rent achievability than the comps imply.
- What's the recent tenant-quality profile in this submarket — average credit score on applications, eviction rate, late-payment / NSF rate, and stable-employment percentage? A property-management company in the area should have these aggregated.
- How much new for-sale + rental construction is in the pipeline within 1–3 miles? Heavy new supply typically softens prices + rents 12–24 months out; constrained supply supports both.
Investment metrics
- 1% rule
- 5.99% ✓
- Cap rate
- 55.26%
- Cash-on-cash
- 174.89%
- DSCR
- 8.78
- GRM
- 1.4
CMA / ARV
No comps found within radius.
Projected returns pro-forma
-3.0% appreciation · 3.0% rent growth · sell at horizon
- IRR
- —
- Equity multiple
- 9.71×
- Total profit
- $85,318
- Equity at exit
- $5,219
- IRR
- —
- Equity multiple
- 20.54×
- Total profit
- $191,521
- Equity at exit
- $3,026
Cash invested: $9,800 (down + closing). Projections, not guarantees.
Landlord ↔ Tenant lean methodology
- Overall (STATE)
- 90 Strongly Landlord-Friendly
- State South Carolina
- 90 Strongly Landlord-Friendly · R+6
- County
- — inherits STATE
- City
- — inherits STATE
ZIP-level market 29440
- Home prices YoY
- -34.9%
- Active inventory
- 409
- Price-to-rent
- 1.4×
Monthly cashflow live
- Estimated rent
- $2,097 medium interval (Pro) →
- Mortgage (P&I)
- −$184
- Tax from tax record
- −$30 /mo · $361/yr
- Insurance
- −$15
- HOA
- −$0
- Vacancy / Maint / Mgmt
- −$440
- Net cashflow
- $1,428
Break-even live
Sensitivity live
| Price | -10% $1,448 | -5% $1,438 | +0% $1,428 | +5% $1,418 | +10% $1,408 |
|---|---|---|---|---|---|
| Rent | -10% $1,263 | -5% $1,345 | +0% $1,428 | +5% $1,511 | +10% $1,594 |
| Rate | -1.0pp $1,446 | -0.5pp $1,437 | base $1,428 | +0.5pp $1,419 | +1.0pp $1,410 |
UW: 25.0% down · 7.5% · 30yr · 1.5% tax · 5.0% vac · 8.0% maint · 8.0% mgmt
Financing live
Cash to close
- Down payment
- $8,750
- Closing costs
- $1,050
- Reserves months
- —
- Total cash needed
- —
Loan-product check · same deal, 3 products live
Conventional
25% down · 7.5% · 30yr
- Down + closing
- —
- Monthly P&I
- —
- Monthly cashflow
- —
- DSCR
- —
- Eligible?
- —
Personal DTI + credit; lowest rate.
DSCR
20% down · 8.5% · 30yr
- Down + closing
- —
- Monthly P&I
- —
- Monthly cashflow
- —
- DSCR
- —
- Eligible?
- —
No personal income docs; deal must DSCR.
Hard money
10% down · 12.0% · 12mo
- Down + closing
- —
- Monthly P&I
- —
- Monthly cashflow
- —
- DSCR
- —
- Eligible?
- —
Short-term bridge; refi at stabilization.
Listing history 11 events
-
2026-06-19status $35,000 Active 15 DOM
-
2026-06-18days on market $35,000 Active Under Contract 15 DOM
-
2026-06-17days on market $35,000 Active Under Contract 14 DOM
-
2026-06-16days on market $35,000 Active Under Contract 13 DOM
-
2026-06-15days on market $35,000 Active Under Contract 12 DOM
-
2026-06-14statusdays on market $35,000 Active Under Contract 10 DOM
-
2026-06-10days on market $35,000 Active 7 DOM
-
2026-06-09days on market $35,000 Active 6 DOM
-
2026-06-08days on market $35,000 Active 5 DOM
-
2026-06-07remarks 699-char remark
-
2026-06-07$35,000 Active 4 DOM
ⓘ Source: listings_history table (triggers on properties + properties_extension) + one-shot
backfill from property_details.listing_events for pre-trigger history.
Tax reassessment forecast SC · Resets to sale price
- Current annual tax
- $361 · $30/mo
- Projected year-2 tax
- $361 · $30/mo
- Expected delta
- $0/yr ($0/mo · 0.0%)
ⓘ Screening estimate from a state-policy table — verify with the county assessor before closing.
Climate risk First Street
- Flood 1/10 Low FEMA zone X (unshaded) · 0% chance over 30 yrs
- Wildfire 7/10 Severe
- Heat 9/10 Extreme 7 d/yr ≥111°F today · 17 d/yr by 30 yrs out
- Wind 8/10 Severe 98% chance of damaging wind over 30 yrs
- Air quality 2/10 Low 1 unhealthy d/yr today · 2 by 30 yrs out
Nearby sold comps map
Loading sold comps map…
Walkable amenities ~0.75 mi
Loading nearby amenities…
Taxation est. · year 1
- Rental income
- $25,161
- − Mortgage interest
- −$1,961
- − Property taxes
- −$361
- − Insurance
- −$175
- − Repairs & maintenance
- −$2,013
- − Management
- −$2,013
- − Depreciation
- −$1,018
- Taxable income
- $17,621
- Est. tax owed @ 24.0%
- −$4,229
- After-tax cash flow
- $12,910/yr
For passive investors: Depreciation is non-cash, so a rental often shows a tax loss while cash-flowing — sheltering income. Rental losses are passive: they offset passive income freely, and up to $25,000/yr can offset ordinary (W-2) income if you actively participate and your MAGI is under $100k (phasing out to $0 by $150k); unused losses carry forward. On sale, claimed depreciation is recaptured at up to 25%, and gains may owe capital-gains tax (a 1031 exchange can defer both). Figures are a year-1 estimate at your 24.0% rate — not tax advice; consult a CPA.
Schools (NCES district)
- District
- Georgetown 01
- NCES district ID
- 4502280
- Math proficiency
- 26% ▼ -11.00%
- Reading proficiency
- 38% ▼ -5.00%
- Median HH income
- $43,045
- Composite
- 27.15/100
- National rank
- #7030
- State rank
- #51 of 80 in SC
Livability — Georgetown
- Score
- 65/100
- State rank
- #141
- US rank
- #13446
Category grades
Schools grade is shown separately in the Schools card above.
Census & demographics
- Population (ZIP)
- 26,419
Population outlook (Georgetown County) Hauer SSP2
- Today (2025)
- 63,275 people
- By 2030
- 63,630 · +0.6%
- By 2040
- 63,130 · -0.2%
- By 2050
- 61,904 · -2.2%
- By 2075
- 59,305 · -6.3%
- By 2100
- 53,852 · -14.9%
Race, ethnicity, and origin ACS 2023
- Neighborhood character
- Majority White (52%)
- Race & ethnicity
- White 52% Black 45% Hispanic / Latino 2%
- Common ancestry
- Italian 3% Lithuanian 2% Slovak 1%
- Foreign-born
- 3% · Canada
- Languages at home
- 97% English-only · Spanish 2%
Political lean MEDSL · Georgetown
- 2024 margin
- R (+19.5) · D 39.6% · R 59.1% · Other 1.2%
- 2008→2024 swing
- -14.2pp toward R · 2008: -5.2pp · 2024: -19.5pp
- All cycles
- 2024: R+19.5 2020: R+12.7 2016: R+13.0 2012: R+7.6 2008: R+5.2
Not yet ingested
- Civics
- —
Market trends
- HPI YoY
- ▼ -111.84%
- Current HPI
- 208.6792
- Rent YoY
- —
- Metro
- —
- State GDP YoY
- ▲ 4.51%
- F500 in state
- 2
Industry mix (Fortune 500 HQ in SC)
| Industry | F500 HQs | Revenue |
|---|---|---|
| Packaging | 1 | $7B |
|
||
Price history
+0.0% since first listed5 events — show timeline
- 2026-06-03 Listed $35,000 CCAR
- 2026-06-03 Listed $35,000 Charleston Trident MLS
- 2020-12-11 Sold (MLS) $30,000 Charleston Trident MLS
- 2020-11-01 Contingent — Charleston Trident MLS
- 2020-10-27 Listed $35,000 Charleston Trident MLS
Property tax history
+11.6%/yrLatest (2025): $361 · -5.7% YoY. Source: county tax records.
Cash-flow waterfall
monthlySold comps — $/sqft
last 12 mo · ≤1 miLoading sold comps…