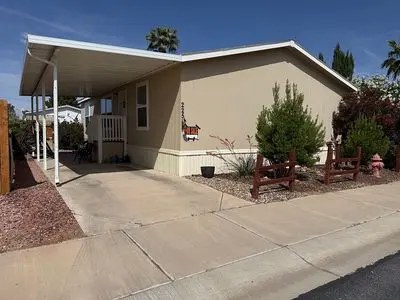
225 Topaz Ln · Mesquite, NV
Flood risk 1/10 · Minimal
- FEMA flood zone
- X (unshaded)
- Chance of flooding over 30 yrs
- 0.0%
- Est. flood insurance / yr
- $507 – $1,088
Fire risk 5/10 · Moderate
- Est. fire insurance / yr
- $490 – $910
Heat risk 8/10 · Major
- Hot days now (above 108°F)
- 7 days/yr
- Hot days in 30 yrs
- 18 days/yr
Wind risk 1/10 · Minimal
- Chance of severe wind over 30 yrs
- —
Air-quality risk 1/10 · Minimal
- Unhealthy air days now
- 0 days/yr
- Unhealthy air days in 30 yrs
- 0 days/yr
Risk factors via First Street. Map © Google.
Why this score? — see what drove the B- grade
The composite is a weighted blend of 9 inputs, each scored 0–100. Each bar is that input's sub-score; the figure is the points it added to the 100-point composite (weight × sub-score).
- Cash flow +30.0/30.0
- DSCR +10.0/10.0
- 1% rule +8.8/10.0
- ARV discount +7.5/15.0
- Livability +3.9/5.0
- Condition / age +3.8/5.0
- Schools +2.6/10.0
- Rent growth +2.5/5.0
- Appreciation +0.0/10.0
$130,000
🖨 Deal sheet 📄 Offer letter ✓ Due diligence
Listing remarks
Beautiful, Modern Living in Mesquite! | 2019 Champion Home Welcome to 225 Topaz Ln! This exceptionally well-maintained 2019 Champion (Model SR2844F) offers the perfect blend of modern comfort and peaceful desert living. Located on one of the most desirable corner lots in the community, this home provides a rare level of space and privacy that is hard to find! Home Highlights: Spacious Living: Approx 1,200 sq. ft. of bright, open-concept living space featuring 3 bedrooms and 2 full bathrooms. Modern Kitchen: Large island, updated appliances, and plenty of cabinetry & acirc; & euro; & rdquo; perfect for entertaining. Pristine Condition: This home has been meticulously cared for a
Key facts
- Friendly community
- Modern kitchen
- Corner lot
Tags
Neighborhood map
What this means for you Summary
Snapshot
- This is a 3-bed/2.0-bath other listed at $130k. Condition is rated good.
Deal economics
- At list price, monthly cash flow is $523 ($6k/yr) — positive.
- The deal already cash-flows at list — no discount required.
- Meets the 1% rule at list price ($2k rent vs $130k).
- Recommended offer: $126k (3.0% below list) — sets the bar for market timing.
Location & tenants
- Location reads 77/100 on livability (#5 in NV, #2,968 nationally) — a middle-class / working-renter tenant base. Strengths: crime A+, housing A+, health & safety A+; Watch: schools D-, commute F.
- Clark County School District (urban): math 21% / reading 39% proficiency, ranked #11 of 17 in NV (top 65%) — families likely to look elsewhere, expect single-tenant / working-renter base with shorter leases.
- Market conditions: 102 active listings in the ZIP; 8 comparable units currently listed for rent nearby; rentals at typical pace (median 15d on market — plan ~3-4 weeks tenant-placement turnaround); 14,754 units permitted in Clark County in 2024 (2,301 in 5+ unit buildings).
- This rent runs 30% of the median local income ($72k/yr) — at the standard rent-burdened threshold; future hikes will face affordability resistance.
Forward outlook
- Local home prices are declining (-3.0%/yr); year-one equity from $899 of loan paydown is wiped out by about $4k of value loss. Plan a longer hold.
- Clark County population projected at +36% by 2050 — long-run rental-demand tailwind backs the buy-and-hold thesis.
- At projected returns (-3.0% appreciation + 3.0% rent growth), your $36k cash investment doubles in ~7 years — after that, you're playing with house money.
Negotiation context
- It's been on market 37 days — a 3% lower offer ($126k) is reasonable based on typical stale-listing flexibility.
Risks & watch-outs
- Climate carrying-cost: moderate wildfire risk; extreme-heat days projected 7→18/yr by 2055 (HVAC capex compounding) — expect insurance premiums to compound above CPI over the hold.
Questions for the listing agent
- It's been on market 37 days. Have you received any prior offers? Is the seller open to a 3% concession, seller financing, or rate buy-down credit?
- Is there a deadline driving the sale (1031 exchange, divorce, estate, relocation)? That informs how much negotiation room exists.
- Schools are D-rated, which usually means shorter tenancies and higher turnover. Who's the typical renter profile here, and what's been the actual vacancy rate?
- What's the average days-on-market for RENTAL listings here right now (not sales)? A rising rental-DOM trend means longer vacancies and softer asking-rent achievability than the comps imply.
- What's the recent tenant-quality profile in this submarket — average credit score on applications, eviction rate, late-payment / NSF rate, and stable-employment percentage? A property-management company in the area should have these aggregated.
- How much new for-sale + rental construction is in the pipeline within 1–3 miles? Heavy new supply typically softens prices + rents 12–24 months out; constrained supply supports both.
Investment metrics
- 1% rule
- 1.38% ✓
- Cap rate
- 11.12%
- Cash-on-cash
- 17.24%
- DSCR
- 1.77
- GRM
- 6.0
CMA / ARV
No comps found within radius.
Projected returns pro-forma
-3.0% appreciation · 3.0% rent growth · sell at horizon
- IRR
- 8.6%
- Equity multiple
- 1.34×
- Total profit
- $12,264
- Equity at exit
- $19,383
- IRR
- 17.8%
- Equity multiple
- 2.47×
- Total profit
- $53,671
- Equity at exit
- $11,240
Cash invested: $36,400 (down + closing). Projections, not guarantees.
Landlord ↔ Tenant lean methodology
- Overall (STATE)
- 71 Landlord-Friendly
- State Nevada
- 71 Landlord-Friendly · R+1
- County
- — inherits STATE
- City
- — inherits STATE
ZIP-level market 89027
- Home prices YoY
- -18.3%
- Active inventory
- 102
- Price-to-rent
- 6.0×
Monthly cashflow live
- Estimated rent
- $1,799 high interval (Pro) →
- Mortgage (P&I)
- −$682
- Tax est. 1.5%
- −$162 /mo · $1,950/yr
- Insurance
- −$54
- HOA
- −$0
- Vacancy / Maint / Mgmt
- −$378
- Net cashflow
- $523
Break-even live
UW: 25.0% down · 7.5% · 30yr · 1.5% tax · 5.0% vac · 8.0% maint · 8.0% mgmt
Financing live
Cash to close
- Down payment
- $32,500
- Closing costs
- $3,900
- Reserves months
- —
- Total cash needed
- —
Loan-product check · same deal, 3 products live
Conventional
25% down · 7.5% · 30yr
- Down + closing
- —
- Monthly P&I
- —
- Monthly cashflow
- —
- DSCR
- —
- Eligible?
- —
Personal DTI + credit; lowest rate.
DSCR
20% down · 8.5% · 30yr
- Down + closing
- —
- Monthly P&I
- —
- Monthly cashflow
- —
- DSCR
- —
- Eligible?
- —
No personal income docs; deal must DSCR.
Hard money
10% down · 12.0% · 12mo
- Down + closing
- —
- Monthly P&I
- —
- Monthly cashflow
- —
- DSCR
- —
- Eligible?
- —
Short-term bridge; refi at stabilization.
Rent comps 8 comps
| Address | Beds | Baths | Sqft | Rent | $/sqft | DOM | Units | Dist |
|---|---|---|---|---|---|---|---|---|
| 101 Desert Winds Way Mesquite, NV | 2.0–3.0 | 2.0 | 1123 | $1,755 | $1.56 | 1d | 1 | 0.17mi |
| 717 Hafen Ln Unit 2A Mesquite, NV | 3.0 | 2.5 | 1340 | $1,625 | $1.21 | 23d | 1 | 0.30mi |
| 717 Hafen Ln Unit 9A Mesquite, NV | 3.0 | 2.5 | 1340 | $1,625 | $1.21 | 43d | 1 | 0.30mi |
| 280 Riverside Rd Mesquite, NV | 2.0–3.0 | 2.0 | 912 | $1,295 | $1.42 | 14d | 6 | 0.36mi |
| 261 Sunvalley Dr Mesquite, NV | 1.0–2.0 | 1.0–2.0 | 730 | $1,250 | $1.71 | 1d | 10 | 0.48mi |
| 520 Turtleback Rd Unit B Mesquite, NV | 2.0 | 2.0 | 970 | $1,375 | $1.42 | 7d | 1 | 1.21mi |
| 378 Colleen Ct Unit F Mesquite, NV | 2.0 | 2.0 | 970 | $1,325 | $1.37 | 43d | 1 | 1.23mi |
| 151 Dairy Ln Apt 4 Mesquite, NV | 3.0 | 1.5 | 972 | $1,225 | $1.26 | 12d | 1 | 1.37mi |
Listing history 13 events
-
2026-06-18days on market $130,000 Active 37 DOM
-
2026-06-17days on market $130,000 Active 36 DOM
-
2026-06-16pricedays on market $130,000 Active 35 DOM
-
2026-06-15days on market $135,000 Active 34 DOM
-
2026-06-13days on market $135,000 Active 32 DOM
-
2026-06-09days on market $135,000 Active 28 DOM
-
2026-06-08days on market $135,000 Active 27 DOM
-
2026-06-08days on market $135,000 Active 26 DOM
-
2026-06-03days on market $135,000 Active 22 DOM
-
2026-06-02days on market $135,000 Active 21 DOM
-
2026-06-01days on market $135,000 Active 20 DOM
-
2026-05-31days on market $135,000 Active 19 DOM
-
2026-05-12$135,000 Active 1891-char remark
ⓘ Source: listings_history table (triggers on properties + properties_extension) + one-shot
backfill from property_details.listing_events for pre-trigger history.
Climate risk First Street
- Flood 1/10 Low FEMA zone X (unshaded) · 0% chance over 30 yrs
- Wildfire 5/10 Major
- Heat 8/10 Severe 7 d/yr ≥108°F today · 18 d/yr by 30 yrs out
- Wind 1/10 Low
- Air quality 1/10 Low 0 unhealthy d/yr today · 0 by 30 yrs out
Nearby sold comps map
Loading sold comps map…
Walkable amenities ~0.75 mi
Loading nearby amenities…
Taxation est. · year 1
- Rental income
- $21,589
- − Mortgage interest
- −$7,282
- − Property taxes
- −$1,950
- − Insurance
- −$650
- − Repairs & maintenance
- −$1,727
- − Management
- −$1,727
- − Depreciation
- −$3,782
- Taxable income
- $4,471
- Est. tax owed @ 24.0%
- −$1,073
- After-tax cash flow
- $5,201/yr
For passive investors: Depreciation is non-cash, so a rental often shows a tax loss while cash-flowing — sheltering income. Rental losses are passive: they offset passive income freely, and up to $25,000/yr can offset ordinary (W-2) income if you actively participate and your MAGI is under $100k (phasing out to $0 by $150k); unused losses carry forward. On sale, claimed depreciation is recaptured at up to 25%, and gains may owe capital-gains tax (a 1031 exchange can defer both). Figures are a year-1 estimate at your 24.0% rate — not tax advice; consult a CPA.
Condition & rehab AI · 1 photo
This 2019 Champion home in Mesquite, NV, is in excellent condition with a good condition score of 75. It offers a modern kitchen, two full bathrooms, and a well-maintained exterior. The home is ready for a new owner and can be enhanced with minor cosmetic updates to boost its value.
Value-add opportunities
- Both Painting the exterior — Enhances curb appeal and can increase both resale and rental value.
- Both Landscaping improvements — Enhances curb appeal and can increase both resale and rental value.
- Resale New flooring in bathrooms — Improves the aesthetic and functionality of the bathrooms, which are a key selling point for potential buyers.
- Resale New kitchen appliances — Modernizes the kitchen and can attract more buyers who are looking for updated appliances.
Renovation cost estimate screening
Value-add ROI direction
- Both Painting the exterior — Enhances curb appeal and can increase both resale and rental value. ↑
- Both Landscaping improvements — Enhances curb appeal and can increase both resale and rental value. ↑
- Resale New flooring in bathrooms — Improves the aesthetic and functionality of the bathrooms, which are a key selling point for potential buyers. ↑
- Resale New kitchen appliances — Modernizes the kitchen and can attract more buyers who are looking for updated appliances. ↑
ⓘ Cost ranges are severity-bucket heuristics (US national rule-of-thumb). Get contractor quotes + a written scope before underwriting a rehab budget.
Schools (NCES district)
- District
- Clark County School District
- NCES district ID
- 3200060
- Math proficiency
- 21% ▼ -13.00%
- Reading proficiency
- 39% ▼ -8.00%
- Median HH income
- $53,611
- Composite
- 26.48/100
- National rank
- #7211
- State rank
- #11 of 17 in NV
Livability — Mesquite
- Score
- 77/100
- State rank
- #5
- US rank
- #2968
Category grades
Schools grade is shown separately in the Schools card above.
Census & demographics
- Census place
- Mesquite, NV
- County
- Clark County · 2,306,105 people
- City population
- 18,967
- Metro
- Las Vegas-Henderson-Paradise, NV
- Population (ZIP)
- 18,967
- Household income
- $71,574
- Rent vs Own
- Severe rent burden
- 410.0
Population outlook (Clark County) Hauer SSP2
- Today (2025)
- 2,504,101 people
- By 2030
- 2,693,770 · +7.6%
- By 2040
- 3,061,208 · +22.2%
- By 2050
- 3,400,072 · +35.8%
- By 2075
- 4,139,522 · +65.3%
- By 2100
- 4,596,916 · +83.6%
Race, ethnicity, and origin ACS 2023
- Neighborhood character
- Predominantly White (68%)
- Race & ethnicity
- White 68% Hispanic / Latino 27% Two or more races 13% Asian 2% Native American 1%
- Hispanic origin (detail)
- Mexican 24%
- Common ancestry
- Slovak 3% Portuguese 3% Lithuanian 2%
- Foreign-born
- 14% · Canada
- Languages at home
- 77% English-only · Spanish 20% Tagalog/Filipino 1%
Political lean MEDSL · Clark
- 2024 margin
- Toss-up / Even · D 50.4% · R 47.8% · Other 1.7%
- 2008→2024 swing
- -16.5pp toward R · 2008: 19.1pp · 2024: 2.6pp
- All cycles
- 2024: D+2.6 2020: D+9.3 2016: D+10.7 2012: D+14.5 2008: D+19.1
Not yet ingested
- Civics
- —
Market trends
- HPI YoY
- ▼ -50.54%
- Current HPI
- 225.3137
- Rent YoY
- —
- Metro
- Las Vegas-Henderson-Paradise, NV
- State GDP YoY
- ▲ 3.08%
- F500 in state
- 6
Industry mix (Fortune 500 HQ in NV)
| Industry | F500 HQs | Revenue |
|---|---|---|
| Hotels / Casinos | 3 | $36B |
|
||
Price history
-3.7% since first listed2 events — show timeline
- 2026-06-16 Price Changed $130,000 FSBO.com
- 2026-05-12 Listed $135,000 FSBO.com
Cash-flow waterfall
monthlySold comps — $/sqft
last 12 mo · ≤1 miLoading sold comps…