17625 W Oatman Rd · Avra Valley, AZ
Flood risk 1/10 · Minimal
- FEMA flood zone
- X (unshaded)
- Chance of flooding over 30 yrs
- 0.0%
- Est. flood insurance / yr
- $507 – $1,088
Fire risk 6/10 · Moderate
- Est. fire insurance / yr
- $610 – $1,132
Heat risk 8/10 · Major
- Hot days now (above 110°F)
- 7 days/yr
- Hot days in 30 yrs
- 19 days/yr
Wind risk 1/10 · Minimal
- Chance of severe wind over 30 yrs
- —
Air-quality risk 1/10 · Minimal
- Unhealthy air days now
- 0 days/yr
- Unhealthy air days in 30 yrs
- 0 days/yr
Risk factors via First Street. Map © Google.
Why this score? — see what drove the B+ grade
The composite is a weighted blend of 9 inputs, each scored 0–100. Each bar is that input's sub-score; the figure is the points it added to the 100-point composite (weight × sub-score).
- Cash flow +30.0/30.0
- ARV discount +15.0/15.0
- 1% rule +10.0/10.0
- DSCR +10.0/10.0
- Rent growth +3.4/5.0
- Schools +3.1/10.0
- Livability +2.7/5.0
- Condition / age +2.5/5.0
- Appreciation +0.0/10.0
$88,000
🖨 Deal sheet 📄 Offer letter ✓ Due diligence
Listing remarks
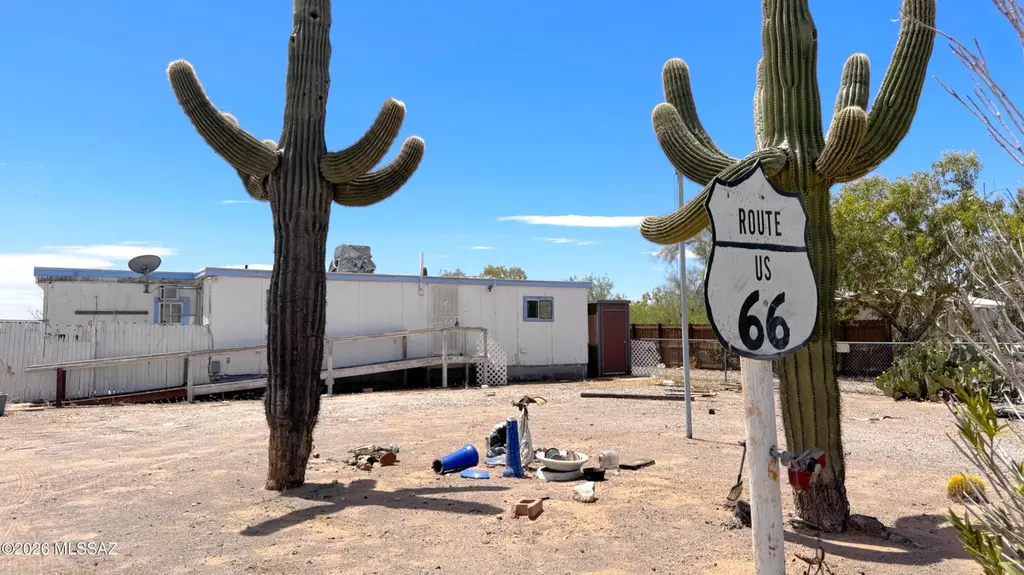
SELLER CARRYBACK FINANCING MAY BE AVAILABLE WITH A MINIMUM 50% DOWN PAYMENT, SUBJECT TO SELLER APPROVAL AND MUTUALLY ACCEPTABLE TERMS. Bring your horses, toys, and vision to this private Blanco Estates property in Marana's Avra Valley area. Set on just over an acre with SH -- Suburban Homestead -- zoning, this property offers the space and flexibility many buyers are looking for in rural Pima County. The lot is mostly fenced and includes a vehicle gate at the frontage, a small metal corral, four saguaros, and fully paved road access to the home. BLM land is just down the road, adding to the appeal for those seeking open desert surroundings and room to breathe. The manufactured/mobile home h
Key facts
- 1.02 acre lot
- Built 1960
- Listed 47 days
Property features AI
Finance
- Other: Lot dimensions approximately 145 x 309; Lot zoning: Marana - SH; Lot size approximately 44,300 sq ft; Road surface: Chip and seal (county maintained)
- HOA & community: Horses allowed; Paved street
Exterior
- Security: Wrought iron security door
- Utilities: Water provided by a water company; Septic tank
- Home design: Mobile home; Single-story; Property faces north
- Construction: Metal roof
- Exterior features: Chain link fencing; Shed(s); North/South exposure; Paved street access
Interior
- Kitchen: Refrigerator; Gas range
- Flooring: Vinyl flooring; Laminate flooring
- Bathrooms: 2 full bathrooms
- Heating & cooling: Natural gas heating; Evaporative cooling
- Interior features: Wrought iron security door; Gas hookup available
Neighborhood map
What this means for you Summary
Snapshot
- This is a 2-bed/2.0-bath manufactured listed at $88k.
Deal economics
- At list price, monthly cash flow is $585 ($7k/yr) — positive.
- The deal already cash-flows at list — no discount required.
- Meets the 1% rule at list price ($1k rent vs $88k).
- Recommended offer: $85k (3.0% below list) — sets the bar for market timing.
- Cap rate 14.3% vs local median 5.9% in Avra Valley — top-decile yield for the area; either an underpriced asset or a hidden risk that comps aren't pricing in. Stress-test before assuming the spread holds.
Location & tenants
- Location reads 54/100 on livability (#275 in AZ) — a working-class tenant base; expect higher turnover. Strengths: cost of living A+, housing A+; Watch: crime D-, amenities F, commute F.
- Marana Unified District (4404) (suburban): math 31% / reading 37% proficiency, ranked #83 of 249 in AZ (top 33%) — families likely to look elsewhere, expect single-tenant / working-renter base with shorter leases.
- Zoned schools: Roadrunner Elementary School (math 12% / reading 22%, grade F, #814 of 1,109 statewide, top 76%, 374 students, 73% FRL); Marana Middle School (math 24% / reading 30%, grade F, #97 of 218 statewide, top 45%, 907 students, 44% FRL); Marana High School (math 21% / reading 24%, grade F, #210 of 381 statewide, top 55%, 2,379 students, 36% FRL) — zoned schools average 51% FRL vs 35% district-wide (16 pts higher); higher-poverty schools than district average — tighter screening recommended.
- Market conditions: Rents rising (+3.4%/yr); 412 active listings in the ZIP; solid renter incomes; 5,268 units permitted in Pima County in 2024 (996 in 5+ unit buildings).
Forward outlook
- Local home prices are declining (-3.0%/yr); year-one equity from $608 of loan paydown is wiped out by about $3k of value loss. Plan a longer hold.
- Pima County population projected at +8% by 2050 — modest demand growth; plan on rents tracking national, not racing it.
- At projected returns (-3.0% appreciation + 3.4% rent growth), your $25k cash investment doubles in ~5 years — after that, you're playing with house money.
Negotiation context
- It's been on market 47 days — a 3% lower offer ($85k) is reasonable based on typical stale-listing flexibility.
- 4 sale attempts since 32y ago; this cycle's ask has dropped $12k (12%) from the opening price — seller is motivated, your offer sets the floor, not the list.
Risks & watch-outs
- Climate carrying-cost: major wildfire risk; extreme-heat days projected 7→19/yr by 2055 (HVAC capex compounding) — expect insurance premiums to compound above CPI over the hold.
Questions for the listing agent
- It's been on market 47 days. Have you received any prior offers? Is the seller open to a 3% concession, seller financing, or rate buy-down credit?
- Built in 1960 — when were the roof, HVAC, electrical panel, plumbing, and water heater last replaced?
- Is there a deadline driving the sale (1031 exchange, divorce, estate, relocation)? That informs how much negotiation room exists.
- Schools are F-rated, which usually means shorter tenancies and higher turnover. Who's the typical renter profile here, and what's been the actual vacancy rate?
- Crime grade is D in this area — have there been break-ins, vandalism, or insurance claims at this property in the last 3 years? What carrier currently insures it and at what premium?
- What's the average days-on-market for RENTAL listings here right now (not sales)? A rising rental-DOM trend means longer vacancies and softer asking-rent achievability than the comps imply.
- What's the recent tenant-quality profile in this submarket — average credit score on applications, eviction rate, late-payment / NSF rate, and stable-employment percentage? A property-management company in the area should have these aggregated.
- How much new for-sale + rental construction is in the pipeline within 1–3 miles? Heavy new supply typically softens prices + rents 12–24 months out; constrained supply supports both.
Investment metrics
- 1% rule
- 1.64% ✓
- Cap rate
- 14.27%
- Cash-on-cash
- 28.49%
- DSCR
- 2.27
- GRM
- 5.1
CMA / ARV
- ARV (median comp)
- $125,191
- List price
- $88,000
- Delta
- -29.71%
- Verdict
- UNDERPRICED
- Comps
- 7 within 2.0 mi
Projected returns pro-forma
-3.0% appreciation · 3.43% rent growth · sell at horizon
- IRR
- 23.2%
- Equity multiple
- 1.96×
- Total profit
- $23,620
- Equity at exit
- $13,121
- IRR
- 31.4%
- Equity multiple
- 3.89×
- Total profit
- $71,107
- Equity at exit
- $7,609
Cash invested: $24,640 (down + closing). Projections, not guarantees.
Landlord ↔ Tenant lean methodology
- Overall (STATE)
- 87 Strongly Landlord-Friendly
- State Arizona
- 87 Strongly Landlord-Friendly · R+3
- County
- — inherits STATE
- City
- — inherits STATE
ZIP-level market 85653
- Home prices YoY
- -21.8%
- Rents YoY
- 3.4%
- Active inventory
- 412
- Price-to-rent
- 5.1×
Monthly cashflow live
- Estimated rent
- $1,445 medium interval (Pro) →
- Mortgage (P&I)
- −$461
- Tax from tax record
- −$58 /mo · $701/yr
- Insurance
- −$37
- HOA
- −$0
- Vacancy / Maint / Mgmt
- −$303
- Net cashflow
- $585
Break-even live
UW: 25.0% down · 7.5% · 30yr · 1.5% tax · 5.0% vac · 8.0% maint · 8.0% mgmt
Financing live
Cash to close
- Down payment
- $22,000
- Closing costs
- $2,640
- Reserves months
- —
- Total cash needed
- —
Loan-product check · same deal, 3 products live
Conventional
25% down · 7.5% · 30yr
- Down + closing
- —
- Monthly P&I
- —
- Monthly cashflow
- —
- DSCR
- —
- Eligible?
- —
Personal DTI + credit; lowest rate.
DSCR
20% down · 8.5% · 30yr
- Down + closing
- —
- Monthly P&I
- —
- Monthly cashflow
- —
- DSCR
- —
- Eligible?
- —
No personal income docs; deal must DSCR.
Hard money
10% down · 12.0% · 12mo
- Down + closing
- —
- Monthly P&I
- —
- Monthly cashflow
- —
- DSCR
- —
- Eligible?
- —
Short-term bridge; refi at stabilization.
Listing history 25 events
-
2026-06-18days on market $88,000 Active 47 DOM
-
2026-06-17price $88,000 Active 46 DOM
-
2026-06-17days on market $89,000 Active 46 DOM
-
2026-06-16days on market $89,000 Active 45 DOM
-
2026-06-15days on market $89,000 Active 44 DOM
-
2026-06-13days on market $89,000 Active 42 DOM
-
2026-06-13remarks 699-char remark
-
2026-06-13days on market $89,000 Active 41 DOM
-
2026-06-10days on market $89,000 Active 39 DOM
-
2026-06-09days on market $89,000 Active 38 DOM
-
2026-06-08days on market $89,000 Active 37 DOM
-
2026-06-07days on market $89,000 Active 36 DOM
-
2026-06-05days on market $89,000 Active 33 DOM
-
2026-06-03days on market $89,000 Active 32 DOM
-
2026-06-02days on market $89,000 Active 31 DOM
-
2026-06-01days on market $89,000 Active 30 DOM
-
2026-05-31days on market $89,000 Active 29 DOM
-
2026-05-02$100,000 Active 696-char remark
-
2023-05-08soldstatus $82,000
-
2002-02-01historical
-
2000-08-06historical
-
2000-02-04$53,900
-
2000-01-22historical
-
1999-09-22$53,900
-
1994-11-30$33,000
ⓘ Source: listings_history table (triggers on properties + properties_extension) + one-shot
backfill from property_details.listing_events for pre-trigger history.
Tax reassessment forecast AZ · Resets to sale price
- Current annual tax
- $701 · $58/mo
- Projected year-2 tax
- $701 · $58/mo
- Expected delta
- $0/yr ($0/mo · 0.0%)
ⓘ Screening estimate from a state-policy table — verify with the county assessor before closing.
Climate risk First Street
- Flood 1/10 Low FEMA zone X (unshaded) · 0% chance over 30 yrs
- Wildfire 6/10 Major
- Heat 8/10 Severe 7 d/yr ≥110°F today · 19 d/yr by 30 yrs out
- Wind 1/10 Low
- Air quality 1/10 Low 0 unhealthy d/yr today · 0 by 30 yrs out
Nearby sold comps map
Loading sold comps map…
Walkable amenities ~0.75 mi
Loading nearby amenities…
Taxation est. · year 1
- Rental income
- $17,341
- − Mortgage interest
- −$4,929
- − Property taxes
- −$701
- − Insurance
- −$440
- − Repairs & maintenance
- −$1,387
- − Management
- −$1,387
- − Depreciation
- −$2,560
- Taxable income
- $5,936
- Est. tax owed @ 24.0%
- −$1,425
- After-tax cash flow
- $5,596/yr
For passive investors: Depreciation is non-cash, so a rental often shows a tax loss while cash-flowing — sheltering income. Rental losses are passive: they offset passive income freely, and up to $25,000/yr can offset ordinary (W-2) income if you actively participate and your MAGI is under $100k (phasing out to $0 by $150k); unused losses carry forward. On sale, claimed depreciation is recaptured at up to 25%, and gains may owe capital-gains tax (a 1031 exchange can defer both). Figures are a year-1 estimate at your 24.0% rate — not tax advice; consult a CPA.
Schools (NCES district)
- District
- Marana Unified District (4404)
- NCES district ID
- 0404630
- Math proficiency
- 31% ▼ -11.00%
- Reading proficiency
- 37% ▼ -5.00%
- Median HH income
- $65,282
- Composite
- 30.96/100
- National rank
- #6103
- State rank
- #83 of 249 in AZ
Livability — Avra Valley
- Score
- 54/100
- State rank
- #275
- US rank
- #23869
Category grades
Schools grade is shown separately in the Schools card above.
Census & demographics
- Census place
- Avra Valley, AZ
- County
- Pima County · 1,012,107 people
- Metro
- Tucson, AZ
- Population (ZIP)
- 23,574
- Household income
- $86,154
- Rent vs Own
- Severe rent burden
- 181.0
Population outlook (Pima County) Hauer SSP2
- Today (2025)
- 1,066,056 people
- By 2030
- 1,086,684 · +1.9%
- By 2040
- 1,117,160 · +4.8%
- By 2050
- 1,149,778 · +7.9%
- By 2075
- 1,271,480 · +19.3%
- By 2100
- 1,321,160 · +23.9%
Race, ethnicity, and origin ACS 2023
- Neighborhood character
- Diverse neighborhood (Simpson 0.55)
- Race & ethnicity
- White 61% Hispanic / Latino 27% Two or more races 15% Black 3% Native American 2% Asian 1%
- Hispanic origin (detail)
- Mexican 22% Puerto Rican 2%
- Common ancestry
- Romanian 4% Lithuanian 2% Slovak 2%
- Foreign-born
- 6% · Canada
- Languages at home
- 88% English-only · Spanish 9% Other Asian/Pacific 1%
Political lean MEDSL · Pima
- 2024 margin
- D (+15.2) · D 57.0% · R 41.8% · Other 1.2%
- 2008→2024 swing
- +9.1pp toward D · 2008: 6.1pp · 2024: 15.2pp
- All cycles
- 2024: D+15.2 2020: D+18.7 2016: D+13.5 2012: D+5.8 2008: D+6.1
Not yet ingested
- Civics
- —
Market trends
- HPI YoY
- ▼ -69.29%
- Current HPI
- 249.3403
- Rent YoY
- ▲ 3.43%
- Metro
- Tucson, AZ
- State GDP YoY
- ▲ 4.54%
- F500 in state
- 20
Industry mix (Fortune 500 HQ in AZ)
| Industry | F500 HQs | Revenue |
|---|---|---|
| Technology | 2 | $13B |
|
||
| Mining / Metals | 1 | $23B |
|
||
| Environmental Services | 1 | $16B |
|
||
| Metals / Steel | 1 | $14B |
|
||
| Technology Distribution | 1 | $9B |
|
||
| Homebuilding | 1 | $8B |
|
||
Price history
+166.7% since first listed10 events — show timeline
- 2026-06-17 Price Changed $88,000 MLSSAZ
- 2026-05-22 Price Changed $89,000 MLSSAZ
- 2026-05-02 Listed $100,000 MLSSAZ
- 2023-05-08 Sold (Public Records) $82,000 Public Records
- 2002-02-01 Listing Removed — MLSSAZ
- 2000-08-06 Listing Removed — MLSSAZ
- 2000-02-04 Listed $53,900 MLSSAZ
- 2000-01-22 Listing Removed — MLSSAZ
- 1999-09-22 Listed $53,900 MLSSAZ
- 1994-11-30 Listed $33,000 MLSSAZ
Property tax history
+56.7%/yrLatest (2025): $701 · +4.9% YoY. Source: county tax records.
Cash-flow waterfall
monthlySold comps — $/sqft
last 12 mo · ≤1 miLoading sold comps…