 Multi-family
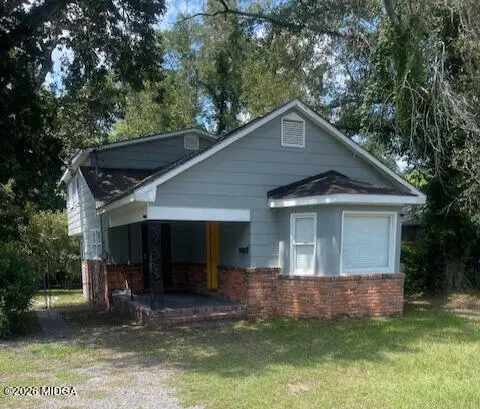
856 Center St · Macon-Bibb County, GA
Flood risk 1/10 · Minimal
- FEMA flood zone
- X (unshaded)
- Chance of flooding over 30 yrs
- 0.0%
- Est. flood insurance / yr
- $507 – $1,088
Fire risk 3/10 · Minor
- Est. fire insurance / yr
- $963 – $1,789
Heat risk 7/10 · Major
- Hot days now (above 108°F)
- 7 days/yr
- Hot days in 30 yrs
- 17 days/yr
Wind risk 6/10 · Moderate
- Chance of severe wind over 30 yrs
- 66.0%
Air-quality risk 4/10 · Minor
- Unhealthy air days now
- 4 days/yr
- Unhealthy air days in 30 yrs
- 4 days/yr
Risk factors via First Street. Map © Google.
Why this score? — see what drove the C- grade
The composite is a weighted blend of 9 inputs, each scored 0–100. Each bar is that input's sub-score; the figure is the points it added to the 100-point composite (weight × sub-score).
- Cash flow +18.4/30.0
- ARV discount +7.5/15.0
- Appreciation +7.2/10.0
- DSCR +5.8/10.0
- Rent growth +5.0/5.0
- 1% rule +4.3/10.0
- Livability +2.5/5.0
- Condition / age +2.5/5.0
- Schools +1.2/10.0
$169,900
🖨 Deal sheet 📄 Offer letter ✓ Due diligence
Multi-family units
County records classify this as Multi-Family (2-4 Unit). Listing-text estimate: 1 unit. estimate disagrees with records
Listing remarks
This single-family home has been configured as a tri-plex, offering three separate units ideal for investors or owner-occupants. Each unit provides private living space, creating flexibility for long-term rentals, short-term income, or multi-generational living. Unit A 1 bedroom studio ; Unit B 2br/1ba; Unit C 1br/1ba. Contact Agent for more information!
Key facts
- Private living space
- Short-term income
- Long-term rentals
Tags
Property features AI
Exterior
- Parking: Driveway parking
- Utilities: Public water; Public sewer
- Home design: Residential income property; Triplex
- Exterior features: No notable exterior features listed
Interior
- Bathrooms: Three full bathrooms
- Heating & cooling: Has heating; Has cooling
- Interior features: Central heating and cooling (listed as 'Other' systems)
Neighborhood map
What this means for you Summary
Snapshot
- This is a 3-bed/3.0-bath multifamily listed at $170k.
Deal economics
- At list price, monthly cash flow is $159 ($2k/yr) — positive.
- The deal already cash-flows at list — no discount required.
- To meet the 1% rule (rent ≥ 1% of price), the offer needs to be $159k (6.6% below list).
- Recommended offer: $150k (12.0% below list) — sets the bar for market timing.
- Cap rate 7.4% vs local median 5.4% in Macon-Bibb County — top-decile yield for the area; either an underpriced asset or a hidden risk that comps aren't pricing in. Stress-test before assuming the spread holds.
Location & tenants
- Location reads: area grade C — affects rentability + tenant quality, not the cash-flow math above.
- Bibb County (urban): math 11% / reading 18% proficiency, ranked #161 of 174 in GA (top 92%) — low school quality limits family demand, transient renter base, plan for 1-2y turnover; 75% free/reduced lunch — lower-income household profile, screen leases tightly.
- Market conditions: Rents rising fast (+10.8%/yr); 122 active listings in the ZIP; 14 comparable units currently listed for rent nearby; rentals at typical pace (median 21d on market — plan ~3-4 weeks tenant-placement turnaround); 43% of comp listings sitting > 30 days — soft ceiling on asking rent; lower-income renter base — watch delinquency; 154 units permitted in Bibb County in 2024 (0 in 5+ unit buildings).
- This rent runs 42% of the median local income ($45k/yr) — at the standard rent-burdened threshold; future hikes will face affordability resistance.
Forward outlook
- In year one you build about $9k of equity ($1k loan paydown + $7k appreciation (4.3% local appreciation)).
- Bibb County population projected at -12% by 2050 — secular population decline; favor cash flow + early exit over multi-decade hold.
- At projected returns (4.3% appreciation + 8.0% rent growth), your $48k cash investment doubles in ~4 years — after that, you're playing with house money.
- By year 5, paydown + projected appreciation supports a ~$37k cash-out refi (75% LTV) — recoverable capital for the next deal without selling this one.
Negotiation context
- It's been on market 147 days — a 12% lower offer ($150k) is reasonable based on typical stale-listing flexibility.
- 9 sale attempts since 4y ago; this cycle's ask has dropped $30k (15%) from the opening price — seller is motivated, your offer sets the floor, not the list.
Risks & watch-outs
- Watch-outs: built in 1950 — expect roof / HVAC / electrical / plumbing capex.
- Climate carrying-cost: major wind risk, 66% chance of damaging wind over 30y; extreme-heat days projected 7→17/yr by 2055 (HVAC capex compounding) — expect insurance premiums to compound above CPI over the hold.
Questions for the listing agent
- It's been on market 147 days. Have you received any prior offers? Is the seller open to a 12% concession, seller financing, or rate buy-down credit?
- Built in 1950 — when were the roof, HVAC, electrical panel, plumbing, and water heater last replaced?
- Why hasn't it sold? Are there any deal-killer items the seller is aware of (foundation, flood, title, zoning, code violations)?
- Is there a deadline driving the sale (1031 exchange, divorce, estate, relocation)? That informs how much negotiation room exists.
- What's the average days-on-market for RENTAL listings here right now (not sales)? A rising rental-DOM trend means longer vacancies and softer asking-rent achievability than the comps imply.
- What's the recent tenant-quality profile in this submarket — average credit score on applications, eviction rate, late-payment / NSF rate, and stable-employment percentage? A property-management company in the area should have these aggregated.
- How much new apartment / multifamily construction is in the pipeline within 1–3 miles? Heavy new supply (>2% of stock underway) typically softens rents 12–24 months out; light construction supports rent growth.
Investment metrics
- 1% rule
- 0.93% ✗
- Cap rate
- 7.41%
- Cash-on-cash
- 4.00%
- DSCR
- 1.18
- GRM
- 8.9
CMA / ARV
No comps found within radius.
Projected returns pro-forma
4.31% appreciation · 8.0% rent growth · sell at horizon
- IRR
- 17.1%
- Equity multiple
- 2.07×
- Total profit
- $51,023
- Equity at exit
- $89,259
- IRR
- 19.9%
- Equity multiple
- 4.55×
- Total profit
- $168,997
- Equity at exit
- $148,535
Cash invested: $47,572 (down + closing). Projections, not guarantees.
Landlord ↔ Tenant lean methodology
- Overall (STATE)
- 90 Strongly Landlord-Friendly
- State Georgia
- 90 Strongly Landlord-Friendly · R+3
- County
- — inherits STATE
- City
- — inherits STATE
ZIP-level market 31217
- Home prices YoY
- 2.1%
- Rents YoY
- 10.8%
- Active inventory
- 122
- Price-to-rent
- 8.9×
Monthly cashflow live
- Estimated rent
- $1,587 high interval (Pro) →
- Mortgage (P&I)
- −$891
- Tax from tax record
- −$133 /mo · $1,600/yr
- Insurance
- −$71
- HOA
- −$0
- Vacancy / Maint / Mgmt
- −$333
- Net cashflow
- $159
Break-even live
UW: 25.0% down · 7.5% · 30yr · 1.5% tax · 5.0% vac · 8.0% maint · 8.0% mgmt
Financing live
Cash to close
- Down payment
- $42,475
- Closing costs
- $5,097
- Reserves months
- —
- Total cash needed
- —
Loan-product check · same deal, 3 products live
Conventional
25% down · 7.5% · 30yr
- Down + closing
- —
- Monthly P&I
- —
- Monthly cashflow
- —
- DSCR
- —
- Eligible?
- —
Personal DTI + credit; lowest rate.
DSCR
20% down · 8.5% · 30yr
- Down + closing
- —
- Monthly P&I
- —
- Monthly cashflow
- —
- DSCR
- —
- Eligible?
- —
No personal income docs; deal must DSCR.
Hard money
10% down · 12.0% · 12mo
- Down + closing
- —
- Monthly P&I
- —
- Monthly cashflow
- —
- DSCR
- —
- Eligible?
- —
Short-term bridge; refi at stabilization.
Rent comps 14 comps
| Address | Beds | Baths | Sqft | Rent | $/sqft | DOM | Units | Dist |
|---|---|---|---|---|---|---|---|---|
| 490 Hall St Macon, GA | 4.0 | 2.0 | 1596 | $1,850 | $1.16 | 43d | 1 | 0.05mi |
| 1105 Boulevard Macon, GA | 3.0 | 1.0 | 1592 | $1,350 | $0.85 | 21d | 1 | 0.51mi |
| 1126 Boulevard Macon, GA | 4.0 | 1.5 | 1228 | $1,260 | $1.03 | 21d | 1 | 0.51mi |
| 870 Laurel Ave Macon, GA | 3.0 | 2.0 | 2205 | $1,300 | $0.59 | 43d | 1 | 0.59mi |
| 892 Applewood St Macon, GA | 4.0 | 2.0 | 1250 | $850 | $0.68 | 43d | 1 | 0.69mi |
| 879 Nottingham Dr Macon, GA | 3.0 | 2.5 | 2147 | $1,700 | $0.79 | 13d | 1 | 0.75mi |
| 850 Parkview Ct Macon, GA | 3.0 | 2.5 | 1520 | $1,700 | $1.12 | 21d | 1 | 0.78mi |
| 850 Parkview Ct Macon, GA | 3.0 | 2.5 | 1520 | $1,700 | $1.12 | 43d | 1 | 0.78mi |
| 854 Trinity Pl Macon, GA | 2.0 | 1.0 | 1260 | $875 | $0.69 | 43d | 1 | 0.80mi |
| 147 Orange St Macon, GA | 3.0 | 2.0 | 1500 | $1,695 | $1.13 | 13d | 1 | 1.21mi |
| 462 Cherry St Macon, GA | 2.0 | 1.0–2.0 | 988 | $3,000 | $3.03 | 13d | 25 | 1.33mi |
| 370 Cherry St Macon, GA | 2.0 | 2.0 | 1500 | $1,400 | $0.93 | 43d | 1 | 1.35mi |
| 484 1st St #300 Macon, GA | 2.0 | 1.0 | 1400 | $1,625 | $1.16 | 13d | 1 | 1.39mi |
| 476 3rd St Macon, GA | 2.0 | 1.0 | 942 | $1,850 | $1.96 | 13d | 8 | 1.40mi |
Listing history 42 events
-
2026-06-19days on market $169,900 Active 147 DOM
-
2026-06-18days on market $169,900 Active 146 DOM
-
2026-06-17days on market $169,900 Active 145 DOM
-
2026-06-16days on market $169,900 Active 144 DOM
-
2026-06-15days on market $169,900 Active 143 DOM
-
2026-06-14days on market $169,900 Active 141 DOM
-
2026-06-13pricedays on market $169,900 Active 140 DOM
-
2026-06-10days on market $159,900 Active 138 DOM
-
2026-06-09pricedays on market $159,900 Active 137 DOM
-
2026-06-09days on market $199,900 Active 136 DOM
-
2026-06-07days on market $199,900 Active 135 DOM
-
2026-06-03days on market $199,900 Active 131 DOM
-
2026-06-02days on market $199,900 Active 130 DOM
-
2026-06-01days on market $199,900 Active 129 DOM
-
2026-05-31days on market $199,900 Active 128 DOM
-
2026-05-30days on market $199,900 Active 127 DOM
-
2026-05-22status Active
-
2026-04-24historical Active Under Contract
-
2026-01-23$199,900 Active
-
2025-01-31historical
-
2025-01-31historical
-
2025-01-23price $159,000
-
2025-01-23price $159,000
-
2025-01-16price $173,000
-
2025-01-16price $173,000
-
2024-12-28price $175,900
-
2024-12-28price $175,900
-
2024-11-11$185,900 Active
-
2024-11-11$185,900 New
-
2024-08-10historical
-
2024-08-09historical
-
2024-06-09$185,000 New
-
2024-06-09$185,000 Active
-
2024-02-23soldstatus $173,000
-
2022-09-06soldstatus $140,000
-
2022-09-01soldstatus $140,000 Sold
-
2022-09-01soldstatus $140,000
-
2022-08-19status Under Contract
-
2022-08-16status Back On Market
-
2022-08-05status Under Contract
-
2022-08-04$140,000 New
-
2022-08-04$140,000
ⓘ Source: listings_history table (triggers on properties + properties_extension) + one-shot
backfill from property_details.listing_events for pre-trigger history.
Tax reassessment forecast GA · Resets to sale price
- Current annual tax
- $1,600 · $133/mo
- Projected year-2 tax
- $1,600 · $133/mo
- Expected delta
- $0/yr ($0/mo · 0.0%)
ⓘ Screening estimate from a state-policy table — verify with the county assessor before closing.
Climate risk First Street
- Flood 1/10 Low FEMA zone X (unshaded) · 0% chance over 30 yrs
- Wildfire 3/10 Moderate
- Heat 7/10 Severe 7 d/yr ≥108°F today · 17 d/yr by 30 yrs out
- Wind 6/10 Major 66% chance of damaging wind over 30 yrs
- Air quality 4/10 Moderate 4 unhealthy d/yr today · 4 by 30 yrs out
Nearby sold comps map
Loading sold comps map…
Walkable amenities ~0.75 mi
Loading nearby amenities…
Taxation est. · year 1
- Rental income
- $19,044
- − Mortgage interest
- −$9,517
- − Property taxes
- −$1,600
- − Insurance
- −$850
- − Repairs & maintenance
- −$1,523
- − Management
- −$1,523
- − Depreciation
- −$4,943
- Taxable loss
- −$913
- Est. tax savings @ 24.0%
- +$219
- After-tax cash flow
- $2,122/yr
For passive investors: Depreciation is non-cash, so a rental often shows a tax loss while cash-flowing — sheltering income. Rental losses are passive: they offset passive income freely, and up to $25,000/yr can offset ordinary (W-2) income if you actively participate and your MAGI is under $100k (phasing out to $0 by $150k); unused losses carry forward. On sale, claimed depreciation is recaptured at up to 25%, and gains may owe capital-gains tax (a 1031 exchange can defer both). Figures are a year-1 estimate at your 24.0% rate — not tax advice; consult a CPA.
Schools (NCES district)
- District
- Bibb County
- NCES district ID
- 1300420
- Math proficiency
- 11% ▼ -14.00%
- Reading proficiency
- 18% ▼ -11.00%
- Median HH income
- $37,426
- Composite
- 12.13/100
- National rank
- #9654
- State rank
- #161 of 174 in GA
Livability — Macon-Bibb County
No livability data for this city. (Only ~50 U.S. cities are tracked.)
Census & demographics
- Census place
- Macon-Bibb County, GA
- County
- Bibb County · 164,332 people
- City population
- 143,186
- Metro
- Macon-Bibb County, GA
- Population (ZIP)
- 17,732
- Household income
- $44,809
- Rent vs Own
- Severe rent burden
- 391.0
Population outlook (Bibb County) Hauer SSP2
- Today (2025)
- 148,772 people
- By 2030
- 145,904 · -1.9%
- By 2040
- 139,404 · -6.3%
- By 2050
- 131,603 · -11.5%
- By 2075
- 111,050 · -25.4%
- By 2100
- 83,346 · -44.0%
Race, ethnicity, and origin ACS 2023
- Neighborhood character
- Majority Black (57%)
- Race & ethnicity
- Black 57% White 38% Two or more races 4% Hispanic / Latino 2%
- Common ancestry
- Slovak 1% Italian 1%
- Foreign-born
- 1% · Canada
- Languages at home
- 98% English-only · Spanish 1%
Political lean MEDSL · Bibb
- 2024 margin
- Strong D (+22.4) · D 61.0% · R 38.5%
- 2008→2024 swing
- +4.4pp toward D · 2008: 18.0pp · 2024: 22.4pp
- All cycles
- 2024: D+22.4 2020: D+23.8 2016: D+20.2 2012: D+20.0 2008: D+18.0
Not yet ingested
- Civics
- —
Market trends
- HPI YoY
- ▲ 4.31%
- Current HPI
- 209.9166
- Rent YoY
- ▲ 10.85%
- Metro
- Macon-Bibb County, GA
- State GDP YoY
- ▲ 2.66%
- F500 in state
- 28
Industry mix (Fortune 500 HQ in GA)
| Industry | F500 HQs | Revenue |
|---|---|---|
| Paper / Packaging | 2 | $29B |
|
||
| Retail | 1 | $160B |
|
||
| Transportation / Logistics | 1 | $91B |
|
||
| Airlines | 1 | $62B |
|
||
| Consumer Goods | 1 | $47B |
|
||
| Utilities | 1 | $25B |
|
||
Price history
+42.8% since first listed26 events — show timeline
- 2026-05-22 Relisted — MGMLS
- 2026-04-24 Contingent — MGMLS
- 2026-01-23 Listed $199,900 MGMLS
- 2025-01-31 Listing Removed — GAMLS
- 2025-01-31 Listing Removed — FMLS
- 2025-01-23 Price Changed $159,000 GAMLS
- 2025-01-23 Price Changed $159,000 FMLS
- 2025-01-16 Price Changed $173,000 GAMLS
- 2025-01-16 Price Changed $173,000 FMLS
- 2024-12-28 Price Changed $175,900 GAMLS
- 2024-12-28 Price Changed $175,900 FMLS
- 2024-11-11 Listed $185,900 GAMLS
- 2024-11-11 Listed $185,900 FMLS
- 2024-08-10 Listing Removed — GAMLS
- 2024-08-09 Listing Removed — FMLS
- 2024-06-09 Listed $185,000 FMLS
- 2024-06-09 Listed $185,000 GAMLS
- 2024-02-23 Sold (Public Records) $173,000 Public Records
- 2022-09-06 Sold (Public Records) $140,000 Public Records
- 2022-09-01 Sold (MLS) $140,000 MGMLS
- 2022-09-01 Sold (MLS) $140,000 GAMLS
- 2022-08-19 Pending — GAMLS
- 2022-08-16 Relisted — GAMLS
- 2022-08-05 Pending — GAMLS
- 2022-08-04 Listed $140,000 MGMLS
- 2022-08-04 Listed $140,000 GAMLS
Property tax history
+21.1%/yrLatest (2025): $1,600 · +50.6% YoY. Source: county tax records.
Cash-flow waterfall
monthlySold comps — $/sqft
last 12 mo · ≤1 miLoading sold comps…