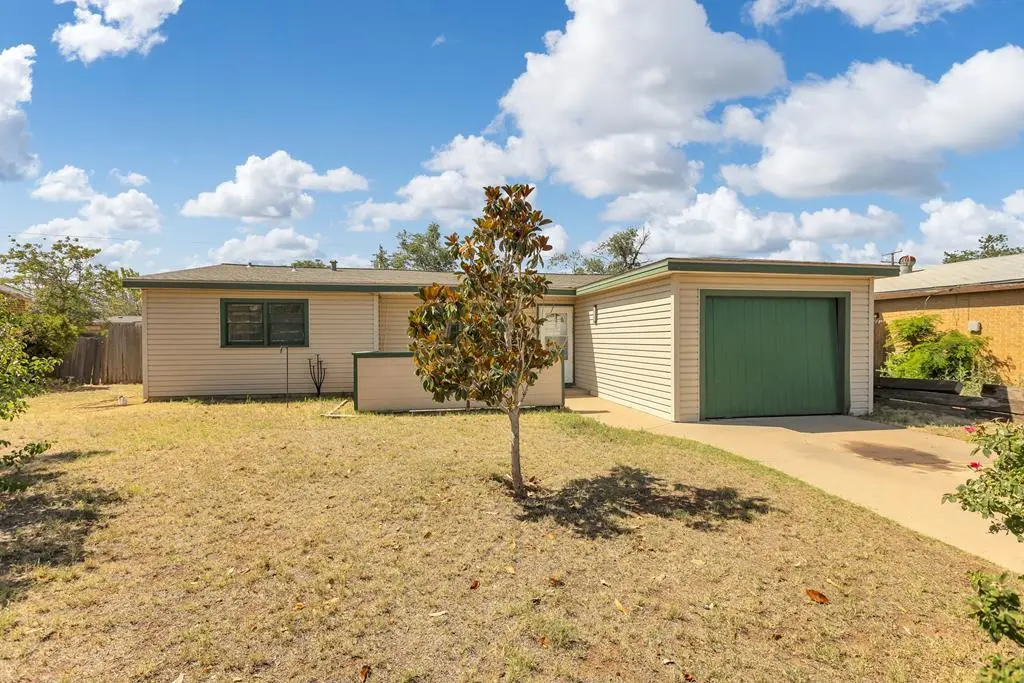
1800 E 14th St · Odessa, TX
Flood risk 1/10 · Minimal
- FEMA flood zone
- X (unshaded)
- Chance of flooding over 30 yrs
- 0.0%
- Est. flood insurance / yr
- $507 – $1,088
Fire risk 1/10 · Minimal
- Est. fire insurance / yr
- $1,222 – $2,270
Heat risk 6/10 · Moderate
- Hot days now (above 101°F)
- 7 days/yr
- Hot days in 30 yrs
- 22 days/yr
Wind risk 2/10 · Minimal
- Chance of severe wind over 30 yrs
- 3.0%
Air-quality risk 1/10 · Minimal
- Unhealthy air days now
- 0 days/yr
- Unhealthy air days in 30 yrs
- 0 days/yr
Risk factors via First Street. Map © Google.
Why this score? — see what drove the B- grade
The composite is a weighted blend of 9 inputs, each scored 0–100. Each bar is that input's sub-score; the figure is the points it added to the 100-point composite (weight × sub-score).
- Cash flow +25.8/30.0
- ARV discount +15.0/15.0
- DSCR +8.6/10.0
- 1% rule +6.3/10.0
- Livability +3.8/5.0
- Condition / age +2.5/5.0
- Rent growth +2.3/5.0
- Schools +2.2/10.0
- Appreciation +0.0/10.0
$195,000
🖨 Deal sheet 📄 Offer letter ✓ Due diligence
Listing remarks MLS
Super cute four bedroom two bath home! Located on the east side of Odessa close to shopping schools and entertainment. . perfect home for the growing family who needs a little more room. . WELCOME HOME! ??
Key facts
- 7,579 sq ft lot
- Garage
- Built 1955
Property features AI
Exterior
- Parking: Detached garage with 1 covered parking space (1 total parking space)
- Utilities: Public water; Public sewer; Propane service
- Home design: Single-family residence; Residential property
- Construction: Wood siding; Composition roof; Slab foundation; Built with wood siding
- Exterior features: Wood fencing; Landscaped yard; Paved road access; Solar panels
Interior
- Kitchen: Gas range
- Flooring: Carpet; Vinyl; Tile
- Bathrooms: 2 full bathrooms
- Heating & cooling: Central heating (natural gas); Central electric cooling
- Interior features: Gas water heater; Gas range
Neighborhood map
What this means for you Summary
Snapshot
- This is a 4-bed/2.0-bath single-family listed at $195k.
Deal economics
- At list price, monthly cash flow is $472 ($6k/yr) — positive.
- The deal already cash-flows at list — no discount required.
- Meets the 1% rule at list price ($2k rent vs $195k).
- Recommended offer: $192k (1.5% below list) — sets the bar for market timing.
Location & tenants
- Location reads 75/100 on livability (#132 in TX, #3,928 nationally) — a middle-class / working-renter tenant base. Strengths: cost of living A+, housing A+, health & safety A+; Watch: commute D+, amenities D.
- Ector County ISD (urban): math 22% / reading 27% proficiency, ranked #707 of 826 in TX (top 86%) — low school quality limits family demand, transient renter base, plan for 1-2y turnover.
- Zoned schools: Dowling El (math 22% / reading 22%, grade F, #3,333 of 4,322 statewide, top 80%, 440 students, 88% FRL); Bonham Middle (math 9% / reading 16%, grade F, #1,616 of 1,662 statewide, top 97%, 867 students, 65% FRL); Permian H S (math 19% / reading 29%, grade F, #1,333 of 1,632 statewide, top 82%, 3,978 students, 51% FRL).
- Market conditions: Rents soft (-0.7%/yr); 93 active listings in the ZIP; 20 comparable units currently listed for rent nearby; rentals at typical pace (median 21d on market — plan ~3-4 weeks tenant-placement turnaround); 1,004 units permitted in Ector County in 2024 (0 in 5+ unit buildings).
- This rent runs 39% of the median local income ($68k/yr) — at the standard rent-burdened threshold; future hikes will face affordability resistance.
Forward outlook
- Local home prices are declining (-3.0%/yr); year-one equity from $1k of loan paydown is wiped out by about $6k of value loss. Plan a longer hold.
- Ector County population projected at +78% by 2050 — long-run rental-demand tailwind backs the buy-and-hold thesis.
Negotiation context
- It's been on market 22 days — a 2% lower offer ($192k) is reasonable based on typical stale-listing flexibility.
- 3 sale attempts since 22y ago with the ask held roughly flat each time — persistent listings suggest the price (not the market) is what's stuck; bring a comps-based counter.
Risks & watch-outs
- Watch-outs: built in 1955 — expect roof / HVAC / electrical / plumbing capex.
- Climate carrying-cost: extreme-heat days projected 7→22/yr by 2055 (HVAC capex compounding) — expect insurance premiums to compound above CPI over the hold.
Questions for the listing agent
- Built in 1955 — when were the roof, HVAC, electrical panel, plumbing, and water heater last replaced?
- Is there a deadline driving the sale (1031 exchange, divorce, estate, relocation)? That informs how much negotiation room exists.
- Schools are F-rated, which usually means shorter tenancies and higher turnover. Who's the typical renter profile here, and what's been the actual vacancy rate?
- What's the average days-on-market for RENTAL listings here right now (not sales)? A rising rental-DOM trend means longer vacancies and softer asking-rent achievability than the comps imply.
- What's the recent tenant-quality profile in this submarket — average credit score on applications, eviction rate, late-payment / NSF rate, and stable-employment percentage? A property-management company in the area should have these aggregated.
- How much new for-sale + rental construction is in the pipeline within 1–3 miles? Heavy new supply typically softens prices + rents 12–24 months out; constrained supply supports both.
Investment metrics
- 1% rule
- 1.13% ✓
- Cap rate
- 9.20%
- Cash-on-cash
- 10.37%
- DSCR
- 1.46
- GRM
- 7.4
CMA / ARV
- ARV (on-the-fly)
- $239,324
- Comps found
- 1
Show comp detail 1 sale within ~0.75 mi
| Address | Dist | Beds/Ba | Sqft | Sold | Price | $/sf | Match |
|---|---|---|---|---|---|---|---|
| 1908 E 14th St | 0.11mi | 3/2.0 (-1) | 1,959 (+10%) | 1mo | $262,500 | $134 | 73 |
Match score weights: distance 35% · size 25% · config 20% · recency 20%. Top-matched comps best support the ARV.
Projected returns pro-forma
-3.0% appreciation · 0.0% rent growth · sell at horizon
- IRR
- -4.1%
- Equity multiple
- 0.85×
- Total profit
- $-8,034
- Equity at exit
- $29,075
- IRR
- 2.0%
- Equity multiple
- 1.12×
- Total profit
- $6,650
- Equity at exit
- $16,860
Cash invested: $54,600 (down + closing). Projections, not guarantees.
Landlord ↔ Tenant lean methodology
- Overall (STATE)
- 87 Strongly Landlord-Friendly
- State Texas
- 87 Strongly Landlord-Friendly · R+5
- County
- — inherits STATE
- City
- — inherits STATE
ZIP-level market 79761
- Home prices YoY
- -31.4%
- Rents YoY
- -0.7%
- Active inventory
- 93
- Price-to-rent
- 7.4×
Monthly cashflow live
- Estimated rent
- $2,206 high interval (Pro) →
- Mortgage (P&I)
- −$1,023
- Tax from tax record
- −$167 /mo · $2,005/yr
- Insurance
- −$81
- HOA
- −$0
- Vacancy / Maint / Mgmt
- −$463
- Net cashflow
- $472
Break-even live
UW: 25.0% down · 7.5% · 30yr · 1.5% tax · 5.0% vac · 8.0% maint · 8.0% mgmt
Financing live
Cash to close
- Down payment
- $48,750
- Closing costs
- $5,850
- Reserves months
- —
- Total cash needed
- —
Loan-product check · same deal, 3 products live
Conventional
25% down · 7.5% · 30yr
- Down + closing
- —
- Monthly P&I
- —
- Monthly cashflow
- —
- DSCR
- —
- Eligible?
- —
Personal DTI + credit; lowest rate.
DSCR
20% down · 8.5% · 30yr
- Down + closing
- —
- Monthly P&I
- —
- Monthly cashflow
- —
- DSCR
- —
- Eligible?
- —
No personal income docs; deal must DSCR.
Hard money
10% down · 12.0% · 12mo
- Down + closing
- —
- Monthly P&I
- —
- Monthly cashflow
- —
- DSCR
- —
- Eligible?
- —
Short-term bridge; refi at stabilization.
Rent comps 20 comps
| Address | Beds | Baths | Sqft | Rent | $/sqft | DOM | Units | Dist |
|---|---|---|---|---|---|---|---|---|
| 1513 E 11th St Odessa, TX | 3.0 | 2.0 | 1728 | $3,300 | $1.91 | 44d | 1 | 0.23mi |
| 1706 Emerald Ave Odessa, TX | 3.0 | 2.0 | 1992 | $2,500 | $1.26 | 44d | 1 | 0.35mi |
| 1709 Byron Ave Odessa, TX | 3.0 | 2.0 | 1981 | $1,975 | $1.00 | 44d | 1 | 0.38mi |
| 1401 E 18th St Odessa, TX | 3.0 | 2.0 | 1690 | $2,000 | $1.18 | 13d | 1 | 0.46mi |
| 701 Hillcrest Ave Odessa, TX | 3.0 | 2.0 | 1344 | $1,400 | $1.04 | 44d | 1 | 0.51mi |
| 2826 Hilltop Dr Odessa, TX | 4.0 | 2.0 | 1307 | $2,000 | $1.53 | 13d | 1 | 0.67mi |
| 2901 Nabors Ln Odessa, TX | 3.0 | 1.0 | 1508 | $1,800 | $1.19 | 13d | 1 | 0.76mi |
| 2901 Nabors Ln Odessa, TX | 3.0 | 1.0 | 1374 | $1,800 | $1.31 | 21d | 1 | 0.76mi |
| 2801 Redbud Ave Odessa, TX | 3.0 | 2.0 | 1558 | $1,800 | $1.16 | 13d | 1 | 0.81mi |
| 2905 Byron Ave Odessa, TX | 3.0 | 2.0 | 1816 | $2,400 | $1.32 | 13d | 1 | 0.84mi |
| 2511 Beechwood St Odessa, TX | 3.0 | 2.0 | 2200 | $2,595 | $1.18 | 13d | 1 | 0.89mi |
| 3009 N Century Ave Odessa, TX | 3.0 | 2.0 | 1909 | $2,600 | $1.36 | 44d | 1 | 0.90mi |
| 2702 S Colonial Dr Odessa, TX | 3.0 | 1.0 | 1490 | $1,500 | $1.01 | 13d | 1 | 1.05mi |
| 3420 Fairlane Ave Odessa, TX | 3.0 | 2.0 | 2164 | $2,100 | $0.97 | 21d | 1 | 1.09mi |
| 2620 Cambridge St Odessa, TX | 3.0 | 2.0 | 1595 | $1,950 | $1.22 | 21d | 1 | 1.12mi |
| 2705 Cambridge St Odessa, TX | 3.0 | 2.0 | 1456 | $2,400 | $1.65 | 21d | 1 | 1.19mi |
| 3616 E 30th St Odessa, TX | 3.0 | 2.0 | 1436 | $1,995 | $1.39 | 44d | 1 | 1.25mi |
| 1212 E Century Ave Odessa, TX | 3.0 | 1.0 | 1359 | $1,300 | $0.96 | 21d | 1 | 1.31mi |
| 3624 Walnut Ave Odessa, TX | 3.0 | 1.0 | 1488 | $1,950 | $1.31 | 44d | 1 | 1.44mi |
| 3812 E Everglade Ave Odessa, TX | 3.0 | 2.0 | 1861 | $2,500 | $1.34 | 21d | 1 | 1.45mi |
Listing history 22 events
-
2026-06-19days on market $195,000 Active 22 DOM
-
2026-06-18days on market $195,000 Active 21 DOM
-
2026-06-17days on market $195,000 Active 20 DOM
-
2026-06-16days on market $195,000 Active 19 DOM
-
2026-06-15days on market $195,000 Active 18 DOM
-
2026-06-14days on market $195,000 Active 16 DOM
-
2026-06-13days on market $195,000 Active 15 DOM
-
2026-06-10days on market $195,000 Active 13 DOM
-
2026-06-09days on market $195,000 Active 12 DOM
-
2026-06-09days on market $195,000 Active 11 DOM
-
2026-06-03days on market $195,000 Active 9 DOM
-
2026-06-01days on market $195,000 Active 8 DOM
-
2026-05-31days on market $195,000 Active 7 DOM
-
2026-05-30days on market $195,000 Active 6 DOM
-
2026-05-24$195,000 Active
-
2017-06-08soldstatus
-
2017-05-30soldstatus 206-char remark
Show marketing remark (206 chars)
Super cute four bedroom two bath home! Located on the east side of Odessa close to shopping schools and entertainment. . perfect home for the growing family who needs a little more room. . WELCOME HOME! ??
-
2017-02-06$144,900 206-char remark
Show marketing remark (206 chars)
Super cute four bedroom two bath home! Located on the east side of Odessa close to shopping schools and entertainment. . perfect home for the growing family who needs a little more room. . WELCOME HOME! ??
-
2008-10-03soldstatus
-
2005-01-07soldstatus
-
2004-08-18soldstatus 162-char remark
Show marketing remark (162 chars)
Call listing office for addendums, Sold "as is where is", with no repairs. Bids accepted until May 18th 2004 at midnight. Dept. of Veterns Affairs home.
-
2004-05-08$12,800 162-char remark
Show marketing remark (162 chars)
Call listing office for addendums, Sold "as is where is", with no repairs. Bids accepted until May 18th 2004 at midnight. Dept. of Veterns Affairs home.
ⓘ Source: listings_history table (triggers on properties + properties_extension) + one-shot
backfill from property_details.listing_events for pre-trigger history.
Tax reassessment forecast TX · Resets to sale price
- Current annual tax
- $2,005 · $167/mo
- Projected year-2 tax
- $3,568 · $297/mo
- Expected delta
- +$1,564/yr (+$130/mo · 78.0%)
ⓘ Screening estimate from a state-policy table — verify with the county assessor before closing.
Climate risk First Street
- Flood 1/10 Low FEMA zone X (unshaded) · 0% chance over 30 yrs
- Wildfire 1/10 Low
- Heat 6/10 Major 7 d/yr ≥101°F today · 22 d/yr by 30 yrs out
- Wind 2/10 Low 3% chance of damaging wind over 30 yrs
- Air quality 1/10 Low 0 unhealthy d/yr today · 0 by 30 yrs out
Nearby sold comps map
Loading sold comps map…
Walkable amenities ~0.75 mi
Loading nearby amenities…
Taxation est. · year 1
- Rental income
- $26,470
- − Mortgage interest
- −$10,923
- − Property taxes
- −$2,005
- − Insurance
- −$975
- − Repairs & maintenance
- −$2,118
- − Management
- −$2,118
- − Depreciation
- −$5,673
- Taxable income
- $2,659
- Est. tax owed @ 24.0%
- −$638
- After-tax cash flow
- $5,022/yr
For passive investors: Depreciation is non-cash, so a rental often shows a tax loss while cash-flowing — sheltering income. Rental losses are passive: they offset passive income freely, and up to $25,000/yr can offset ordinary (W-2) income if you actively participate and your MAGI is under $100k (phasing out to $0 by $150k); unused losses carry forward. On sale, claimed depreciation is recaptured at up to 25%, and gains may owe capital-gains tax (a 1031 exchange can defer both). Figures are a year-1 estimate at your 24.0% rate — not tax advice; consult a CPA.
Schools (NCES district)
- District
- Ector County ISD
- NCES district ID
- 4818000
- Math proficiency
- 22% ▼ -9.00%
- Reading proficiency
- 27% ▼ -4.00%
- Median HH income
- $52,740
- Composite
- 21.89/100
- National rank
- #8233
- State rank
- #707 of 826 in TX
Livability — Odessa
- Score
- 75/100
- State rank
- #132
- US rank
- #3928
Category grades
Schools grade is shown separately in the Schools card above.
Census & demographics
- Census place
- Odessa, TX
- County
- Ector County · 131,169 people
- City population
- 131,169
- Metro
- Odessa, TX
- Population (ZIP)
- 30,164
- Household income
- $68,228
- Rent vs Own
- Severe rent burden
- 1352.0
Population outlook (Ector County) Hauer SSP2
- Today (2025)
- 212,765 people
- By 2030
- 241,962 · +13.7%
- By 2040
- 306,582 · +44.1%
- By 2050
- 379,755 · +78.5%
- By 2075
- 568,991 · +167.4%
- By 2100
- 709,829 · +233.6%
Race, ethnicity, and origin ACS 2023
- Neighborhood character
- Predominantly Hispanic (67%)
- Race & ethnicity
- Hispanic / Latino 67% White 23% Two or more races 20% Black 8% Asian 1%
- Hispanic origin (detail)
- Mexican 61%
- Common ancestry
- Slovak 1%
- Foreign-born
- 18% · Canada
- Languages at home
- 50% English-only · Spanish 48%
Political lean MEDSL · Ector
- 2024 margin
- Solid R (+52.9) · D 23.2% · R 76.1%
- 2008→2024 swing
- -4.9pp toward R · 2008: -48.0pp · 2024: -52.9pp
- All cycles
- 2024: R+52.9 2020: R+47.8 2016: R+40.6 2012: R+48.9 2008: R+48.0
Not yet ingested
- Civics
- —
Market trends
- HPI YoY
- ▼ -116.66%
- Current HPI
- 254.9159
- Rent YoY
- ▼ -0.66%
- Metro
- Odessa, TX
- State GDP YoY
- ▲ 3.95%
- F500 in state
- 110
Industry mix (Fortune 500 HQ in TX)
| Industry | F500 HQs | Revenue |
|---|---|---|
| Energy | 16 | $1,198B |
|
||
| Technology | 5 | $198B |
|
||
| Engineering / Construction | 4 | $72B |
|
||
| Energy Services | 3 | $60B |
|
||
| Utilities | 3 | $41B |
|
||
| Healthcare | 2 | $330B |
|
||
Price history
+1423.4% since first listed8 events — show timeline
- 2026-05-24 Listed $195,000 ODMLS
- 2017-06-08 Sold (Public Records) — Public Records
- 2017-05-30 Sold (MLS) — ODMLS
- 2017-02-06 Listed $144,900 ODMLS
- 2008-10-03 Sold (Public Records) — Public Records
- 2005-01-07 Sold (Public Records) — Public Records
- 2004-08-18 Sold (MLS) — ODMLS
- 2004-05-08 Listed $12,800 ODMLS
Property tax history
-2.5%/yrLatest (2025): $2,005 · -42.9% YoY. Source: county tax records.
Cash-flow waterfall
monthlySold comps — $/sqft
last 12 mo · ≤1 miLoading sold comps…