 🏗️ New Construction
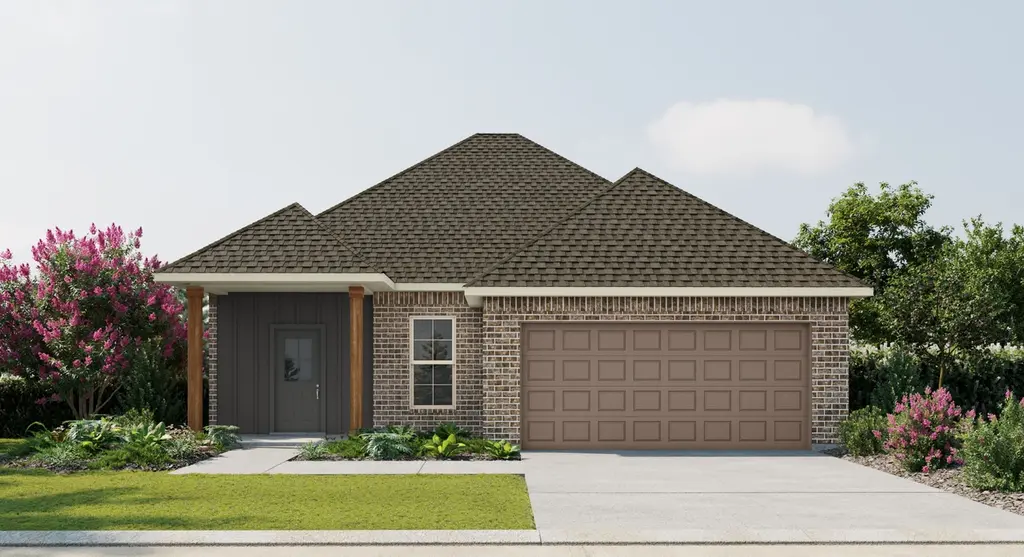
Biltmore II H Plan · Duson, LA
Flood risk No data
- FEMA flood zone
- —
- Chance of flooding over 30 yrs
- —
- Est. flood insurance / yr
- —
Fire risk No data
- Est. fire insurance / yr
- —
Heat risk No data
- Hot days now (above threshold)
- —
- Hot days in 30 yrs
- —
Wind risk No data
- Chance of severe wind over 30 yrs
- —
Air-quality risk No data
- Unhealthy air days now
- —
- Unhealthy air days in 30 yrs
- —
Risk factors via First Street. Map © Google.
Why this score? — see what drove the D grade
The composite is a weighted blend of 9 inputs, each scored 0–100. Each bar is that input's sub-score; the figure is the points it added to the 100-point composite (weight × sub-score).
- Cash flow +14.0/30.0
- ARV discount +7.5/15.0
- DSCR +4.3/10.0
- 1% rule +3.9/10.0
- Schools +3.6/10.0
- Livability +3.3/5.0
- Rent growth +2.5/5.0
- Condition / age +2.2/5.0
- Appreciation +0.0/10.0
$214,990
🖨 Deal sheet 📄 Offer letter ✓ Due diligence
Listing remarks MLS
The Biltmore II H Floor Plan by DSLD Homes is a beautifully designed new construction home offering 4 bedrooms, 2 bathrooms, and 1,465 square feet of well-utilized space. Perfect for first-time buyers or growing families, this energy-efficient layout delivers exceptional value and comfort in a thoughtfully compact design. The exterior features a timeless combination of brick and siding, along with a covered rear porch and a two-car garage-providing both curb appeal and everyday functionality. Inside, the open-concept layout is centered around a bright kitchen enhanced by recessed can lighting, creating a welcoming space for cooking, dining, and entertaining. The primary suite is a private retreat, featuring a relaxing garden tub, separate walk-in shower, and a spacious walk-in closet for added storage and convenience. Built with quality materials and attention to detail, the Biltmore II H is part of DSLD Homes' commitment to affordable, energy-efficient living in beautiful, family-friendly communities.
Key facts
- Brick exterior
- Siding exterior
- 2 garage spots
Tags
Neighborhood map
What this means for you Summary
Snapshot
- This is a 4-bed/2.0-bath single-family listed at $215k. Condition is rated fair.
Deal economics
- At list price, monthly cash flow is $29 ($344/yr) — positive.
- The deal already cash-flows at list — no discount required.
- To meet the 1% rule (rent ≥ 1% of price), the offer needs to be $190k (11.6% below list).
- Recommended offer: $189k (12.0% below list) — sets the bar for market timing.
Location & tenants
- Location reads 66/100 on livability (#134 in LA) — a middle-class / working-renter tenant base. Strengths: cost of living A+, housing A+, health & safety B+; Watch: amenities F, commute F, employment F.
- Lafayette Parish (urban): math 38% / reading 46% proficiency, ranked #19 of 98 in LA (top 19%) — families likely to look elsewhere, expect single-tenant / working-renter base with shorter leases.
- Market conditions: 196 active listings in the ZIP; 1 comparable units currently listed for rent nearby; 1,585 units permitted in Lafayette Parish in 2024 (10 in 5+ unit buildings).
Forward outlook
- Local home prices are declining (-3.0%/yr); year-one equity from $1k of loan paydown is wiped out by about $6k of value loss. Plan a longer hold.
- Lafayette County population projected at +34% by 2050 — long-run rental-demand tailwind backs the buy-and-hold thesis.
Negotiation context
- It's been on market 682 days — a 12% lower offer ($189k) is reasonable based on typical stale-listing flexibility.
Questions for the listing agent
- It's been on market 682 days. Have you received any prior offers? Is the seller open to a 12% concession, seller financing, or rate buy-down credit?
- Have any recent inspections been done? Can we get a copy of the seller's disclosures and any deferred-maintenance estimates?
- Why hasn't it sold? Are there any deal-killer items the seller is aware of (foundation, flood, title, zoning, code violations)?
- Is there a deadline driving the sale (1031 exchange, divorce, estate, relocation)? That informs how much negotiation room exists.
- The area grade is low — what's the realistic commute time and amenity access for the typical tenant pool here? Any planned neighborhood developments (good or bad) we should know about?
- What's the average days-on-market for RENTAL listings here right now (not sales)? A rising rental-DOM trend means longer vacancies and softer asking-rent achievability than the comps imply.
- What's the recent tenant-quality profile in this submarket — average credit score on applications, eviction rate, late-payment / NSF rate, and stable-employment percentage? A property-management company in the area should have these aggregated.
- How much new for-sale + rental construction is in the pipeline within 1–3 miles? Heavy new supply typically softens prices + rents 12–24 months out; constrained supply supports both.
Investment metrics
- 1% rule
- 0.89% ✗
- Cap rate
- 6.45%
- Cash-on-cash
- 0.58%
- DSCR
- 1.03
- GRM
- 9.3
CMA / ARV
- ARV (median comp)
- $213,048
- List price
- $214,990
- Delta
- 0.91%
- Verdict
- FAIR
- Comps
- 20 within 1.0 mi
Show comp detail 12 sales within ~0.75 mi
| Address | Dist | Beds/Ba | Sqft | Sold | Price | $/sf | Match |
|---|---|---|---|---|---|---|---|
| 305 Meadow Ridge Ln | 0.11mi | 3/2.0 (-1) | 1,482 (+1%) | 4mo | $217,946 | $147 | 85 |
| 409 Meadow Ridge Ln | 0.14mi | 3/2.0 (-1) | 1,498 (+2%) | 2mo | $221,370 | $148 | 83 |
| 118 Ember Ridge Ln | 0.15mi | 3/2.0 (-1) | 1,422 (-3%) | 2mo | $208,187 | $146 | 81 |
| 401 Meadow Ridge Ln | 0.14mi | 3/2.0 (-1) | 1,498 (+2%) | 4mo | $220,746 | $147 | 81 |
| 113 Ember Ridge Ln | 0.16mi | 3/2.0 (-1) | 1,498 (+2%) | 5mo | $217,910 | $145 | 79 |
| 111 Ember Ridge Ln | 0.14mi | 3/2.0 (-1) | 1,422 (-3%) | 6mo | $208,040 | $146 | 78 |
| 119 Rosebrook Ln | 0.21mi | 3/2.0 (-1) | 1,422 (-3%) | 4mo | $209,339 | $147 | 78 |
| 205 Meadow Ridge Ln | 0.03mi | 3/2.0 (-1) | 1,321 (-10%) | 1mo | $199,880 | $151 | 76 |
| 106 Rosebrook Ln | 0.10mi | 3/2.0 (-1) | 1,578 (+8%) | 5mo | $221,610 | $140 | 73 |
| 303 Ravensdale Ln | 0.20mi | 3/2.0 (-1) | 1,578 (+8%) | 2mo | $223,102 | $141 | 71 |
| 307 Meadow Ridge Ln | 0.13mi | 3/2.0 (-1) | 1,321 (-10%) | 2mo | $199,035 | $151 | 71 |
| 500 4th St | 0.42mi | 3/2.0 (-1) | 1,296 (-12%) | 3mo | $60,000 | $46 | 54 |
Match score weights: distance 35% · size 25% · config 20% · recency 20%. Top-matched comps best support the ARV.
Projected returns pro-forma
-3.0% appreciation · 3.0% rent growth · sell at horizon
- IRR
- -15.4%
- Equity multiple
- 0.45×
- Total profit
- $-32,668
- Equity at exit
- $31,766
- IRR
- -6.8%
- Equity multiple
- 0.56×
- Total profit
- $-25,979
- Equity at exit
- $18,421
Cash invested: $59,654 (down + closing). Projections, not guarantees.
Landlord ↔ Tenant lean methodology
- Overall (STATE)
- 90 Strongly Landlord-Friendly
- State Louisiana
- 90 Strongly Landlord-Friendly · R+12
- County
- — inherits STATE
- City
- — inherits STATE
ZIP-level market 70529
- Home prices YoY
- -11.1%
- Active inventory
- 196
- Price-to-rent
- 9.4×
Monthly cashflow live
- Estimated rent
- $1,900 medium interval (Pro) →
- Mortgage (P&I)
- −$1,117
- Tax est. 1.5%
- −$266 /mo · $3,196/yr
- Insurance
- −$89
- HOA
- −$0
- Vacancy / Maint / Mgmt
- −$399
- Net cashflow
- $29
Break-even live
UW: 25.0% down · 7.5% · 30yr · 1.5% tax · 5.0% vac · 8.0% maint · 8.0% mgmt
Financing live
Cash to close
- Down payment
- $53,262
- Closing costs
- $6,391
- Reserves months
- —
- Total cash needed
- —
Loan-product check · same deal, 3 products live
Conventional
25% down · 7.5% · 30yr
- Down + closing
- —
- Monthly P&I
- —
- Monthly cashflow
- —
- DSCR
- —
- Eligible?
- —
Personal DTI + credit; lowest rate.
DSCR
20% down · 8.5% · 30yr
- Down + closing
- —
- Monthly P&I
- —
- Monthly cashflow
- —
- DSCR
- —
- Eligible?
- —
No personal income docs; deal must DSCR.
Hard money
10% down · 12.0% · 12mo
- Down + closing
- —
- Monthly P&I
- —
- Monthly cashflow
- —
- DSCR
- —
- Eligible?
- —
Short-term bridge; refi at stabilization.
Rent comps 1 comps
| Address | Beds | Baths | Sqft | Rent | $/sqft | DOM | Units | Dist |
|---|---|---|---|---|---|---|---|---|
| 211 Winter Park PL Duson, LA | 2.0–3.0 | 2.0 | 1275 | $1,900 | $1.49 | 13d | 1 | 0.21mi |
Listing history 17 events
-
2026-06-18days on market $214,990 Active 682 DOM
-
2026-06-17days on market $214,990 Active 681 DOM
-
2026-06-16days on market $214,990 Active 680 DOM
-
2026-06-15days on market $214,990 Active 679 DOM
-
2026-06-14days on market $214,990 Active 677 DOM
-
2026-06-13days on market $214,990 Active 676 DOM
-
2026-06-10days on market $214,990 Active 674 DOM
-
2026-06-09days on market $214,990 Active 673 DOM
-
2026-06-08days on market $214,990 Active 672 DOM
-
2026-06-07days on market $214,990 Active 671 DOM
-
2026-06-05days on market $214,990 Active 668 DOM
-
2026-06-03days on market $214,990 Active 667 DOM
-
2026-06-02days on market $214,990 Active 666 DOM
-
2026-06-01days on market $214,990 Active 665 DOM
-
2026-05-31days on market $214,990 Active 664 DOM
-
2026-05-30days on market $214,990 Active 663 DOM
-
2024-08-05$214,990 Active 1017-char remark
Show marketing remark (1017 chars)
The Biltmore II H Floor Plan by DSLD Homes is a beautifully designed new construction home offering 4 bedrooms, 2 bathrooms, and 1,465 square feet of well-utilized space. Perfect for first-time buyers or growing families, this energy-efficient layout delivers exceptional value and comfort in a thoughtfully compact design. The exterior features a timeless combination of brick and siding, along with a covered rear porch and a two-car garage-providing both curb appeal and everyday functionality. Inside, the open-concept layout is centered around a bright kitchen enhanced by recessed can lighting, creating a welcoming space for cooking, dining, and entertaining. The primary suite is a private retreat, featuring a relaxing garden tub, separate walk-in shower, and a spacious walk-in closet for added storage and convenience. Built with quality materials and attention to detail, the Biltmore II H is part of DSLD Homes' commitment to affordable, energy-efficient living in beautiful, family-friendly communities.
ⓘ Source: listings_history table (triggers on properties + properties_extension) + one-shot
backfill from property_details.listing_events for pre-trigger history.
Nearby sold comps map
Loading sold comps map…
Walkable amenities ~0.75 mi
Loading nearby amenities…
Taxation est. · year 1
- Rental income
- $22,800
- − Mortgage interest
- −$11,934
- − Property taxes
- −$3,196
- − Insurance
- −$1,065
- − Repairs & maintenance
- −$1,824
- − Management
- −$1,824
- − Depreciation
- −$6,198
- Taxable loss
- −$3,241
- Est. tax savings @ 24.0%
- +$778
- After-tax cash flow
- $1,122/yr
For passive investors: Depreciation is non-cash, so a rental often shows a tax loss while cash-flowing — sheltering income. Rental losses are passive: they offset passive income freely, and up to $25,000/yr can offset ordinary (W-2) income if you actively participate and your MAGI is under $100k (phasing out to $0 by $150k); unused losses carry forward. On sale, claimed depreciation is recaptured at up to 25%, and gains may owe capital-gains tax (a 1031 exchange can defer both). Figures are a year-1 estimate at your 24.0% rate — not tax advice; consult a CPA.
Condition & rehab AI · 3 photos
The home requires significant exterior repairs and maintenance, including a new roof and repainting, to improve its condition and value.
Repairs flagged
- Major roof — Significant rust and wear
- Major exterior siding — Worn and faded appearance
Value-add opportunities
- Both Paint exterior siding — Enhances curb appeal and value
- Both Replace roof — Improves structural integrity and aesthetic appeal
Renovation cost estimate screening
| Repair item | Severity | Est. cost |
|---|---|---|
| roof · Significant rust and wear | Major | $15,000–50,000 |
| exterior siding · Worn and faded appearance | Major | $15,000–50,000 |
| Total estimated repair cost · 2 items | $30,000–100,000 |
Value-add ROI direction
- Both Paint exterior siding — Enhances curb appeal and value ↑
- Both Replace roof — Improves structural integrity and aesthetic appeal ↑
ⓘ Cost ranges are severity-bucket heuristics (US national rule-of-thumb). Get contractor quotes + a written scope before underwriting a rehab budget.
Schools (NCES district)
- District
- Lafayette Parish
- NCES district ID
- 2200870
- Math proficiency
- 38% ▼ -32.00%
- Reading proficiency
- 46% ▼ -24.00%
- Median HH income
- $50,238
- Composite
- 36.15/100
- National rank
- #4741
- State rank
- #19 of 98 in LA
Livability — Duson
- Score
- 66/100
- State rank
- #134
- US rank
- #12322
Category grades
Schools grade is shown separately in the Schools card above.
Census & demographics
- Census place
- Duson, LA
- Population (ZIP)
- 13,557
Population outlook (Lafayette County) Hauer SSP2
- Today (2025)
- 280,930 people
- By 2030
- 301,092 · +7.2%
- By 2040
- 339,456 · +20.8%
- By 2050
- 375,156 · +33.5%
- By 2075
- 451,672 · +60.8%
- By 2100
- 497,203 · +77.0%
Race, ethnicity, and origin ACS 2023
- Neighborhood character
- Diverse neighborhood (Simpson 0.55)
- Race & ethnicity
- White 62% Black 25% Hispanic / Latino 6% Two or more races 6%
- Hispanic origin (detail)
- Common ancestry
- Lithuanian 16% English 1% Iranian 1%
- Foreign-born
- 6% · Canada
- Languages at home
- 90% English-only · Spanish 5% French/Haitian/Cajun 4%
Political lean MEDSL · Lafayette
- 2024 margin
- Solid R (+31.4) · D 33.5% · R 64.8% · Other 1.7%
- 2008→2024 swing
- -0.1pp no change · 2008: -31.3pp · 2024: -31.4pp
- All cycles
- 2024: R+31.4 2020: R+28.7 2016: R+33.6 2012: R+33.7 2008: R+31.3
Not yet ingested
- Civics
- —
Market trends
- HPI YoY
- ▼ -23.96%
- Current HPI
- 192.2639
- Rent YoY
- —
- Metro
- —
- State GDP YoY
- ▲ 3.29%
- F500 in state
- 10
Industry mix (Fortune 500 HQ in LA)
| Industry | F500 HQs | Revenue |
|---|---|---|
| Telecommunications | 2 | $23B |
|
||
| Utilities | 1 | $12B |
|
||
| Wholesale / Distribution | 1 | $5B |
|
||
| Advertising | 1 | $2B |
|
||
Price history
1 event — show timeline
- 2024-08-05 Listed $214,990 Zillow
Cash-flow waterfall
monthlySold comps — $/sqft
last 12 mo · ≤1 miLoading sold comps…