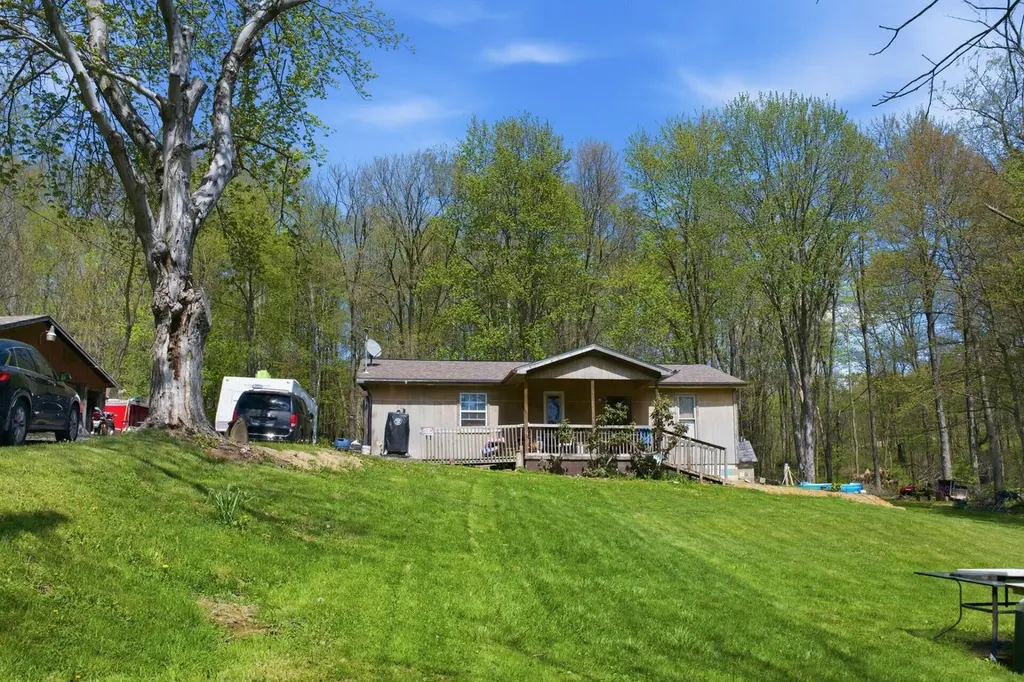
577 County Road 68 · Stratton, OH
Flood risk 1/10 · Minimal
- FEMA flood zone
- X (unshaded)
- Chance of flooding over 30 yrs
- 0.0%
- Est. flood insurance / yr
- $507 – $1,088
Fire risk 1/10 · Minimal
- Est. fire insurance / yr
- $713 – $1,323
Heat risk 2/10 · Minimal
- Hot days now (above 97°F)
- 7 days/yr
- Hot days in 30 yrs
- 17 days/yr
Wind risk 1/10 · Minimal
- Chance of severe wind over 30 yrs
- —
Air-quality risk 2/10 · Minimal
- Unhealthy air days now
- 1 days/yr
- Unhealthy air days in 30 yrs
- 2 days/yr
Risk factors via First Street. Map © Google.
Why this score? — see what drove the F grade
The composite is a weighted blend of 9 inputs, each scored 0–100. Each bar is that input's sub-score; the figure is the points it added to the 100-point composite (weight × sub-score).
- Cash flow +8.0/30.0
- ARV discount +7.5/15.0
- Schools +5.0/10.0
- Livability +3.1/5.0
- Rent growth +2.5/5.0
- Condition / age +2.5/5.0
- 1% rule +2.1/10.0
- DSCR +2.1/10.0
- Appreciation +0.0/10.0
$154,900
🖨 Deal sheet (PDF) 📄 Offer letter ✓ Due diligence
Listing remarks
Solid opportunity on a newer build! This home was rebuilt in 2019 following a fire and has no known issues. It's currently livable and offers a ton of space and flexibility. Features include: 5 bedrooms, 2 bathrooms Spacious living room, dining room, and full kitchen. Large basement with 3 separate areas--perfect for additional living space, storage, or customization2-car detached garage. Plenty of upside here with minimal work needed--don't miss it
Key facts
- 1 acre lot
- 2 garage spots
- Built 2018
Property features AI
Exterior
- Parking: 2 garage spaces; Common parking
- Utilities: Public water; Public sewer
- Home design: Single-family residence; One level; Built in 2018; No shared/common walls
- Construction: Block foundation
- Exterior features: Wooded lot
Interior
- Bedrooms: 5 main-level bedrooms
- Flooring: Laminate flooring; Carpet flooring
- Bathrooms: 2 full bathrooms
- Heating & cooling: Baseboard heating; Propane heating; Central air conditioning
- Interior features: Finished basement; Living area approximately 1512
Neighborhood map
What this means for you Summary
Snapshot
- This is a 2-bed/1.0-bath single-family listed at $155k.
Deal economics
- At list price, monthly cash flow is $-155 ($-2k/yr) — negative.
- To cash-flow at today's rent, offer at most $128k (17.7% below list).
- To meet the 1% rule (rent ≥ 1% of price), the offer needs to be $109k (29.4% below list).
- Recommended offer: $109k (29.4% below list) — sets the bar for 1% rule.
Location & tenants
- Location reads 61/100 on livability (#954 in OH) — a middle-class / working-renter tenant base. Strengths: cost of living A+, housing A+; Watch: health & safety C-, crime D, amenities F.
- Edison Local (rural): math 52% / reading 66% proficiency, ranked #312 of 656 in OH (top 48%) — acceptable for families but not a draw, mixed tenant base, ~2y average lease.
- Zoned schools: Stanton Elementary School (math 52% / reading 62%, grade C+, #729 of 1,584 statewide, top 48%, 396 students, 58% FRL); Edison Jr. High School (math 49% / reading 64%, grade B, #313 of 654 statewide, top 48%, 204 students, 0% FRL); Edison High School (math 32% / reading 72%, grade D+, #343 of 781 statewide, top 47%, 418 students, 74% FRL) — zoned schools at 44% FRL track the district average.
- Market conditions: 35 active listings in the ZIP; 2 units permitted in Jefferson County in 2024 (0 in 5+ unit buildings).
Forward outlook
- Local home prices are declining (-3.0%/yr); year-one equity from $1k of loan paydown is wiped out by about $5k of value loss. Plan a longer hold.
- Jefferson County population projected at -19% by 2050 — secular population decline; favor cash flow + early exit over multi-decade hold.
Negotiation context
- It's been on market 57 days — a 3% lower offer ($150k) is reasonable based on typical stale-listing flexibility.
- 2 sale attempts since 5y ago; this cycle's ask has dropped $20k (11%) from the opening price — seller is motivated, your offer sets the floor, not the list.
- Current owner paid $10k; list at $155k implies a 1449% gain — meaningful room to come down on a strong offer.
Questions for the listing agent
- What do current leases actually rent for vs. the listed asking? Can we see a recent rent roll and the last 12 months of T-12 income?
- It's been on market 57 days. Have you received any prior offers? Is the seller open to a 29% concession, seller financing, or rate buy-down credit?
- Is there a deadline driving the sale (1031 exchange, divorce, estate, relocation)? That informs how much negotiation room exists.
- Schools are D-rated, which usually means shorter tenancies and higher turnover. Who's the typical renter profile here, and what's been the actual vacancy rate?
- Crime grade is D in this area — have there been break-ins, vandalism, or insurance claims at this property in the last 3 years? What carrier currently insures it and at what premium?
- The area grade is low — what's the realistic commute time and amenity access for the typical tenant pool here? Any planned neighborhood developments (good or bad) we should know about?
- What's the average days-on-market for RENTAL listings here right now (not sales)? A rising rental-DOM trend means longer vacancies and softer asking-rent achievability than the comps imply.
- What's the recent tenant-quality profile in this submarket — average credit score on applications, eviction rate, late-payment / NSF rate, and stable-employment percentage? A property-management company in the area should have these aggregated.
- How much new for-sale + rental construction is in the pipeline within 1–3 miles? Heavy new supply typically softens prices + rents 12–24 months out; constrained supply supports both.
Investment metrics
- 1% rule
- 0.71% ✗
- Cap rate
- 5.09%
- Cash-on-cash
- -4.29%
- DSCR
- 0.81
- GRM
- 11.8
CMA / ARV
No comps found within radius.
Projected returns pro-forma
-3.0% appreciation · 3.0% rent growth · sell at horizon
- IRR
- -23.6%
- Equity multiple
- 0.19×
- Total profit
- $-34,983
- Equity at exit
- $23,096
- IRR
- -18.5%
- Equity multiple
- 0.00×
- Total profit
- $-43,230
- Equity at exit
- $13,393
Cash invested: $43,372 (down + closing). Projections, not guarantees.
Landlord ↔ Tenant lean methodology
- Overall (STATE)
- 73 Landlord-Friendly
- State Ohio
- 73 Landlord-Friendly · R+6
- County
- — inherits STATE
- City
- — inherits STATE
ZIP-level market 43964
- Home prices YoY
- -12.7%
- Active inventory
- 35
- Price-to-rent
- 11.8×
Monthly cashflow live
- Estimated rent
- $1,094 medium interval (Pro) →
- Mortgage (P&I)
- −$812
- Tax from tax record
- −$142 /mo · $1,705/yr
- Insurance
- −$65
- HOA
- −$0
- Vacancy / Maint / Mgmt
- −$230
- Net cashflow
- $-155
Break-even live
Sensitivity live
| Price | -10% $-67 | -5% $-111 | +0% $-155 | +5% $-199 | +10% $-243 |
|---|---|---|---|---|---|
| Rent | -10% $-241 | -5% $-198 | +0% $-155 | +5% $-112 | +10% $-69 |
| Rate | -1.0pp $-77 | -0.5pp $-116 | base $-155 | +0.5pp $-195 | +1.0pp $-236 |
UW: 25.0% down · 7.5% · 30yr · 1.5% tax · 5.0% vac · 8.0% maint · 8.0% mgmt
Financing live
Cash to close
- Down payment
- $38,725
- Closing costs
- $4,647
- Reserves months
- —
- Total cash needed
- —
Loan-product check · same deal, 3 products live
Conventional
25% down · 7.5% · 30yr
- Down + closing
- —
- Monthly P&I
- —
- Monthly cashflow
- —
- DSCR
- —
- Eligible?
- —
Personal DTI + credit; lowest rate.
DSCR
20% down · 8.5% · 30yr
- Down + closing
- —
- Monthly P&I
- —
- Monthly cashflow
- —
- DSCR
- —
- Eligible?
- —
No personal income docs; deal must DSCR.
Hard money
10% down · 12.0% · 12mo
- Down + closing
- —
- Monthly P&I
- —
- Monthly cashflow
- —
- DSCR
- —
- Eligible?
- —
Short-term bridge; refi at stabilization.
Listing history 22 events
-
2026-06-21days on market $154,900 Active 57 DOM
-
2026-06-19days on market $154,900 Active 55 DOM
-
2026-06-18days on market $154,900 Active 54 DOM
-
2026-06-17days on market $154,900 Active 53 DOM
-
2026-06-16days on market $154,900 Active 52 DOM
-
2026-06-15days on market $154,900 Active 51 DOM
-
2026-06-14days on market $154,900 Active 49 DOM
-
2026-06-12days on market $154,900 Active 48 DOM
-
2026-06-09days on market $154,900 Active 45 DOM
-
2026-06-08days on market $154,900 Active 44 DOM
-
2026-06-07days on market $154,900 Active 43 DOM
-
2026-06-07days on market $154,900 Active 42 DOM
-
2026-06-04days on market $154,900 Active 39 DOM
-
2026-06-02days on market $154,900 Active 38 DOM
-
2026-06-01days on market $154,900 Active 37 DOM
-
2026-05-31days on market $154,900 Active 36 DOM
-
2026-05-31days on market $154,900 Active 35 DOM
-
2026-05-08price $154,900 453-char remark
-
2026-04-25$174,900 Active 453-char remark
-
2021-03-05historical
-
2021-02-12$139,999
-
2014-03-14soldstatus $10,000
ⓘ Source: listings_history table (triggers on properties + properties_extension) + one-shot
backfill from property_details.listing_events for pre-trigger history.
Tax reassessment forecast OH · Partial reset (capped growth)
- Current annual tax
- $1,705 · $142/mo
- Projected year-2 tax
- $2,061 · $172/mo
- Expected delta
- +$356/yr (+$30/mo · 20.9%)
ⓘ Screening estimate from a state-policy table — verify with the county assessor before closing.
Climate risk First Street
- Flood 1/10 Low FEMA zone X (unshaded) · 0% chance over 30 yrs
- Wildfire 1/10 Low
- Heat 2/10 Low 7 d/yr ≥97°F today · 17 d/yr by 30 yrs out
- Wind 1/10 Low
- Air quality 2/10 Low 1 unhealthy d/yr today · 2 by 30 yrs out
Nearby sold comps map
Loading sold comps map…
Walkable amenities ~0.75 mi
Loading nearby amenities…
Taxation est. · year 1
- Rental income
- $13,124
- − Mortgage interest
- −$8,677
- − Property taxes
- −$1,705
- − Insurance
- −$774
- − Repairs & maintenance
- −$1,050
- − Management
- −$1,050
- − Depreciation
- −$4,506
- Taxable loss
- −$4,638
- Est. tax savings @ 24.0%
- +$1,113
- After-tax cash flow
- $-746/yr
For passive investors: Depreciation is non-cash, so a rental often shows a tax loss while cash-flowing — sheltering income. Rental losses are passive: they offset passive income freely, and up to $25,000/yr can offset ordinary (W-2) income if you actively participate and your MAGI is under $100k (phasing out to $0 by $150k); unused losses carry forward. On sale, claimed depreciation is recaptured at up to 25%, and gains may owe capital-gains tax (a 1031 exchange can defer both). Figures are a year-1 estimate at your 24.0% rate — not tax advice; consult a CPA.
Schools (NCES district)
- District
- Edison Local
- NCES district ID
- 3904779
- Math proficiency
- 52% ▼ -13.00%
- Reading proficiency
- 66% ▼ -7.00%
- Median HH income
- $45,717
- Composite
- 49.79/100
- National rank
- #1959
- State rank
- #312 of 656 in OH
Livability — Stratton
- Score
- 61/100
- State rank
- #954
- US rank
- #18393
Category grades
Schools grade is shown separately in the Schools card above.
Census & demographics
- County
- Jefferson · 64,369 people
- City population
- 230
- Metro
- Weirton-Steubenville, WV-OH
- Population (ZIP)
- 9,061
- Household income
- $53,321
- Rent vs Own
- Severe rent burden
- 5.7
Population outlook (Jefferson County) Hauer SSP2
- Today (2025)
- 63,481 people
- By 2030
- 61,067 · -3.8%
- By 2040
- 55,860 · -12.0%
- By 2050
- 51,236 · -19.3%
- By 2075
- 41,804 · -34.1%
- By 2100
- 32,344 · -49.0%
Race, ethnicity, and origin ACS 2023
- Neighborhood character
- Predominantly White (95%)
- Race & ethnicity
- White 95% Two or more races 3% Black 1%
- Common ancestry
- Romanian 4% Serbian 3% Slovak 1%
- Foreign-born
- 1% · China
Political lean MEDSL · Jefferson
- 2024 margin
- Solid R (+43.9) · D 27.5% · R 71.4% · Other 1.1%
- 2008→2024 swing
- -44.1pp toward R · 2008: 0.2pp · 2024: -43.9pp
- All cycles
- 2024: R+43.9 2020: R+38.4 2016: R+35.7 2012: R+5.5 2008: D+0.2
Not yet ingested
- Civics
- —
Market trends
- HPI YoY
- ▼ -26.09%
- Current HPI
- 178.6704
- Rent YoY
- —
- Metro
- —
- State GDP YoY
- ▲ 1.98%
- F500 in state
- 48
Industry mix (Fortune 500 HQ in OH)
| Industry | F500 HQs | Revenue |
|---|---|---|
| Insurance | 3 | $145B |
|
||
| Industrial Machinery | 3 | $49B |
|
||
| Financial Services | 3 | $24B |
|
||
| Consumer Goods | 2 | $93B |
|
||
| Aerospace / Defense | 2 | $47B |
|
||
| Utilities | 2 | $33B |
|
||
Price history
+1449.0% since first listed5 events — show timeline
- 2026-05-08 Price Changed $154,900 CBRMLS
- 2026-04-25 Listed $174,900 CBRMLS
- 2021-03-05 Listing Removed — MLSNOW
- 2021-02-12 Listed $139,999 MLSNOW
- 2014-03-14 Sold (Public Records) $10,000 Public Records
Property tax history
+13.8%/yrLatest (2025): $1,705 · +2.8% YoY. Source: county tax records.
Cash-flow waterfall
monthlySold comps — $/sqft
last 12 mo · ≤1 miLoading sold comps…