22804 American Kestrel Ct · Splendora, TX
Flood risk No data
- FEMA flood zone
- —
- Chance of flooding over 30 yrs
- —
- Est. flood insurance / yr
- —
Fire risk No data
- Est. fire insurance / yr
- —
Heat risk No data
- Hot days now (above threshold)
- —
- Hot days in 30 yrs
- —
Wind risk No data
- Chance of severe wind over 30 yrs
- —
Air-quality risk No data
- Unhealthy air days now
- —
- Unhealthy air days in 30 yrs
- —
Risk factors via First Street. Map © Google.
Why this score? — see what drove the D grade
The composite is a weighted blend of 9 inputs, each scored 0–100. Each bar is that input's sub-score; the figure is the points it added to the 100-point composite (weight × sub-score).
- Cash flow +16.3/30.0
- ARV discount +6.3/15.0
- DSCR +5.0/10.0
- 1% rule +3.7/10.0
- Livability +3.1/5.0
- Rent growth +2.5/5.0
- Schools +2.5/10.0
- Condition / age +2.5/5.0
- Appreciation +1.8/10.0
$209,850
🖨 Deal sheet 📄 Offer letter ✓ Due diligence
Listing remarks MLS
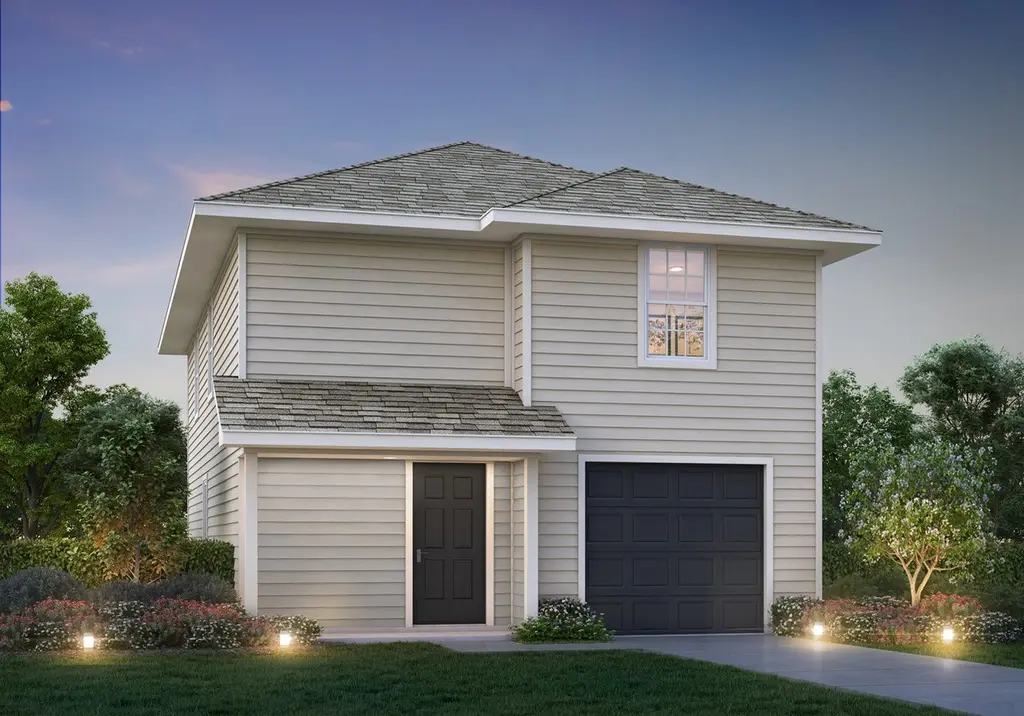
Love where you live in Townsend Reserve in Splendora, TX. Now featuring Legend’s NEW Smart Home package and Signature Design Collection! The Harper floorplan is a spacious 2-story home featuring 3 bedrooms, 2.5 bathrooms, flex space, and a 1-car garage! You'll love the open concept first floor! The gourmet kitchen is sure to please with 42" cabinetry, silestone countertops, and stainless-steel appliances! Washer, dryer, and refrigerator are included, too! Upstairs offers a private retreat for the Owner's Suite and secondary bedrooms! Retreat to the Owner's Suite featuring double sinks, a separate tub and shower, and a walk-in closet. Secondary bedrooms have walk-in closets, too! Enjoy the great outdoors with a sprinkler system and a covered patio! Don't miss your opportunity to call Townsend Reserve home, schedule a visit today!
Key facts
- Smart home package
- Gourmet kitchen
- Private retreat
Tags
Neighborhood map
What this means for you Summary
Snapshot
- This is a 3-bed/2.5-bath land listed at $210k.
Deal economics
- At list price, monthly cash flow is $114 ($1k/yr) — positive.
- The deal already cash-flows at list — no discount required.
- To meet the 1% rule (rent ≥ 1% of price), the offer needs to be $182k (13.4% below list).
- Recommended offer: $182k (13.4% below list) — sets the bar for 1% rule.
- Cap rate 6.9% vs local median 5.2% in Splendora — top-decile yield for the area; either an underpriced asset or a hidden risk that comps aren't pricing in. Stress-test before assuming the spread holds.
Location & tenants
- Location reads 62/100 on livability (#911 in TX) — a middle-class / working-renter tenant base. Strengths: cost of living A+, housing A+; Watch: schools F, amenities F, commute F.
- Splendora ISD (rural): math 25% / reading 31% proficiency, ranked #648 of 826 in TX (top 78%) — low school quality limits family demand, transient renter base, plan for 1-2y turnover.
- Market conditions: 542 active listings in the ZIP; solid renter incomes; 13,259 units permitted in Montgomery County in 2024 (1,402 in 5+ unit buildings).
Forward outlook
- Local home prices are declining (-3.0%/yr); year-one equity from $1k of loan paydown is wiped out by about $6k of value loss. Plan a longer hold.
- Montgomery County population projected at +65% by 2050 — long-run rental-demand tailwind backs the buy-and-hold thesis.
Negotiation context
- It's been on market 63 days — a 6% lower offer ($197k) is reasonable based on typical stale-listing flexibility.
- 2 sale attempts with the ask held roughly flat each time — persistent listings suggest the price (not the market) is what's stuck; bring a comps-based counter.
Questions for the listing agent
- It's been on market 63 days. Have you received any prior offers? Is the seller open to a 13% concession, seller financing, or rate buy-down credit?
- What does the HOA fee cover, when was the last increase, and are there any pending special assessments or reserve-fund shortfalls?
- Why hasn't it sold? Are there any deal-killer items the seller is aware of (foundation, flood, title, zoning, code violations)?
- Is there a deadline driving the sale (1031 exchange, divorce, estate, relocation)? That informs how much negotiation room exists.
- Schools are F-rated, which usually means shorter tenancies and higher turnover. Who's the typical renter profile here, and what's been the actual vacancy rate?
- The area grade is low — what's the realistic commute time and amenity access for the typical tenant pool here? Any planned neighborhood developments (good or bad) we should know about?
- What's the average days-on-market for RENTAL listings here right now (not sales)? A rising rental-DOM trend means longer vacancies and softer asking-rent achievability than the comps imply.
- What's the recent tenant-quality profile in this submarket — average credit score on applications, eviction rate, late-payment / NSF rate, and stable-employment percentage? A property-management company in the area should have these aggregated.
- How much new for-sale + rental construction is in the pipeline within 1–3 miles? Heavy new supply typically softens prices + rents 12–24 months out; constrained supply supports both.
Investment metrics
- 1% rule
- 0.87% ✗
- Cap rate
- 6.95%
- Cash-on-cash
- 2.33%
- DSCR
- 1.10
- GRM
- 9.6
CMA / ARV
- ARV (median comp)
- $204,304
- List price
- $209,850
- Delta
- 2.71%
- Verdict
- FAIR
- Comps
- 20 within 1.0 mi
Projected returns pro-forma
-3.0% appreciation · 3.0% rent growth · sell at horizon
- IRR
- -12.6%
- Equity multiple
- 0.54×
- Total profit
- $-26,778
- Equity at exit
- $31,289
- IRR
- -3.6%
- Equity multiple
- 0.76×
- Total profit
- $-14,156
- Equity at exit
- $18,144
Cash invested: $58,758 (down + closing). Projections, not guarantees.
Landlord ↔ Tenant lean methodology
- Overall (STATE)
- 87 Strongly Landlord-Friendly
- State Texas
- 87 Strongly Landlord-Friendly · R+5
- County
- — inherits STATE
- City
- — inherits STATE
ZIP-level market 77372
- Home prices YoY
- -2.1%
- Active inventory
- 542
- Price-to-rent
- 9.6×
Monthly cashflow live
- Estimated rent
- $1,818 medium interval (Pro) →
- Mortgage (P&I)
- −$1,100
- Tax from tax record
- −$84 /mo · $1,007/yr
- Insurance
- −$87
- HOA
- −$50
- Vacancy / Maint / Mgmt
- −$382
- Net cashflow
- $114
Break-even live
UW: 25.0% down · 7.5% · 30yr · 1.5% tax · 5.0% vac · 8.0% maint · 8.0% mgmt
Financing live
Cash to close
- Down payment
- $52,462
- Closing costs
- $6,296
- Reserves months
- —
- Total cash needed
- —
Loan-product check · same deal, 3 products live
Conventional
25% down · 7.5% · 30yr
- Down + closing
- —
- Monthly P&I
- —
- Monthly cashflow
- —
- DSCR
- —
- Eligible?
- —
Personal DTI + credit; lowest rate.
DSCR
20% down · 8.5% · 30yr
- Down + closing
- —
- Monthly P&I
- —
- Monthly cashflow
- —
- DSCR
- —
- Eligible?
- —
No personal income docs; deal must DSCR.
Hard money
10% down · 12.0% · 12mo
- Down + closing
- —
- Monthly P&I
- —
- Monthly cashflow
- —
- DSCR
- —
- Eligible?
- —
Short-term bridge; refi at stabilization.
HOA detail
- Monthly dues
- $50 · $600/yr
Listing history 16 events
-
2026-06-18days on market $209,850 Active 63 DOM
-
2026-06-17days on market $209,850 Active 62 DOM
-
2026-06-16days on market $209,850 Active 61 DOM
-
2026-06-15days on market $209,850 Active 60 DOM
-
2026-06-13days on market $209,850 Active 58 DOM
-
2026-06-13days on market $209,850 Active 57 DOM
-
2026-06-09days on market $209,850 Active 54 DOM
-
2026-06-08days on market $209,850 Active 53 DOM
-
2026-06-07days on market $209,850 Active 52 DOM
-
2026-06-04days on market $209,850 Active 49 DOM
-
2026-06-03days on market $209,850 Active 48 DOM
-
2026-06-02days on market $209,850 Active 47 DOM
-
2026-06-01days on market $209,850 Active 46 DOM
-
2026-05-31days on market $209,850 Active 45 DOM
-
2026-04-16$209,850 Active 856-char remark
Show marketing remark (856 chars)
Love where you live in Townsend Reserve in Splendora, TX. Now featuring Legend’s NEW Smart Home package and Signature Design Collection! The Harper floorplan is a spacious 2-story home featuring 3 bedrooms, 2.5 bathrooms, flex space, and a 1-car garage! You'll love the open concept first floor! The gourmet kitchen is sure to please with 42" cabinetry, silestone countertops, and stainless-steel appliances! Washer, dryer, and refrigerator are included, too! Upstairs offers a private retreat for the Owner's Suite and secondary bedrooms! Retreat to the Owner's Suite featuring double sinks, a separate tub and shower, and a walk-in closet. Secondary bedrooms have walk-in closets, too! Enjoy the great outdoors with a sprinkler system and a covered patio! Don't miss your opportunity to call Townsend Reserve home, schedule a visit today!
-
2026-04-11$209,850 Active 362-char remark
Show marketing remark (362 chars)
The Harper is a 2-story home from the Cottage Series Line. The plan conveniently offers 3 bedrooms upstairs with walk-in closets, 2.5 bathrooms, and a dedicated laundry room. Downstairs, homeowners love the Harper for its open-concept entry, family room, kitchen, dining, and additional flex room spaces, ideal for welcoming guests and getting work done at home.
ⓘ Source: listings_history table (triggers on properties + properties_extension) + one-shot
backfill from property_details.listing_events for pre-trigger history.
Tax reassessment forecast TX · Resets to sale price
- Current annual tax
- $1,007 · $84/mo
- Projected year-2 tax
- $3,840 · $320/mo
- Expected delta
- +$2,833/yr (+$236/mo · 281.3%)
ⓘ Screening estimate from a state-policy table — verify with the county assessor before closing.
Nearby sold comps map
Loading sold comps map…
Walkable amenities ~0.75 mi
Loading nearby amenities…
Taxation est. · year 1
- Rental income
- $21,814
- − Mortgage interest
- −$11,755
- − Property taxes
- −$1,007
- − Insurance
- −$1,049
- − Repairs & maintenance
- −$1,745
- − Management
- −$1,745
- − HOA
- −$600
- − Depreciation
- −$6,105
- Taxable loss
- −$2,192
- Est. tax savings @ 24.0%
- +$526
- After-tax cash flow
- $1,897/yr
For passive investors: Depreciation is non-cash, so a rental often shows a tax loss while cash-flowing — sheltering income. Rental losses are passive: they offset passive income freely, and up to $25,000/yr can offset ordinary (W-2) income if you actively participate and your MAGI is under $100k (phasing out to $0 by $150k); unused losses carry forward. On sale, claimed depreciation is recaptured at up to 25%, and gains may owe capital-gains tax (a 1031 exchange can defer both). Figures are a year-1 estimate at your 24.0% rate — not tax advice; consult a CPA.
Schools (NCES district)
- District
- Splendora ISD
- NCES district ID
- 4841070
- Math proficiency
- 25% ▼ -8.00%
- Reading proficiency
- 31% ▼ -1.00%
- Median HH income
- $54,166
- Composite
- 24.92/100
- National rank
- #7572
- State rank
- #648 of 826 in TX
Livability — Splendora
- Score
- 62/100
- State rank
- #911
- US rank
- #16335
Category grades
Schools grade is shown separately in the Schools card above.
Census & demographics
- County
- Montgomery County · 663,713 people
- City population
- 14,367
- Metro
- Houston-The Woodlands-Sugar Land, TX
- Population (ZIP)
- 14,367
- Household income
- $79,085
- Rent vs Own
- Severe rent burden
- 135.0
Population outlook (Montgomery County) Hauer SSP2
- Today (2025)
- 713,896 people
- By 2030
- 805,263 · +12.8%
- By 2040
- 992,708 · +39.1%
- By 2050
- 1,179,590 · +65.2%
- By 2075
- 1,628,084 · +128.1%
- By 2100
- 1,937,880 · +171.5%
Race, ethnicity, and origin ACS 2023
- Neighborhood character
- Majority White (61%)
- Race & ethnicity
- White 61% Hispanic / Latino 36% Two or more races 9% Native American 1%
- Hispanic origin (detail)
- Mexican 32%
- Common ancestry
- Lithuanian 4% Italian 2% Slovak 1%
- Foreign-born
- 9% · Canada
- Languages at home
- 71% English-only · Spanish 28%
Political lean MEDSL · Montgomery
- 2024 margin
- Solid R (+45.5) · D 26.8% · R 72.3%
- 2008→2024 swing
- +7.2pp toward D · 2008: -52.7pp · 2024: -45.5pp
- All cycles
- 2024: R+45.5 2020: R+43.8 2016: R+51.4 2012: R+60.7 2008: R+52.7
Not yet ingested
- Civics
- —
Market trends
- HPI YoY
- ▼ -6.47%
- Current HPI
- 306.9962
- Rent YoY
- —
- Metro
- Houston-The Woodlands-Sugar Land, TX
- State GDP YoY
- ▲ 3.95%
- F500 in state
- 110
Industry mix (Fortune 500 HQ in TX)
| Industry | F500 HQs | Revenue |
|---|---|---|
| Energy | 16 | $1,198B |
|
||
| Technology | 5 | $198B |
|
||
| Engineering / Construction | 4 | $72B |
|
||
| Energy Services | 3 | $60B |
|
||
| Utilities | 3 | $41B |
|
||
| Healthcare | 2 | $330B |
|
||
Price history
+0.0% since first listed2 events — show timeline
- 2026-04-16 Listed $209,850 HARMLS
- 2026-04-11 Listed $209,850 Zillow
Property tax history
+39.1%/yrLatest (2025): $1,007 · -0.1% YoY. Source: county tax records.
Cash-flow waterfall
monthlySold comps — $/sqft
last 12 mo · ≤1 miLoading sold comps…