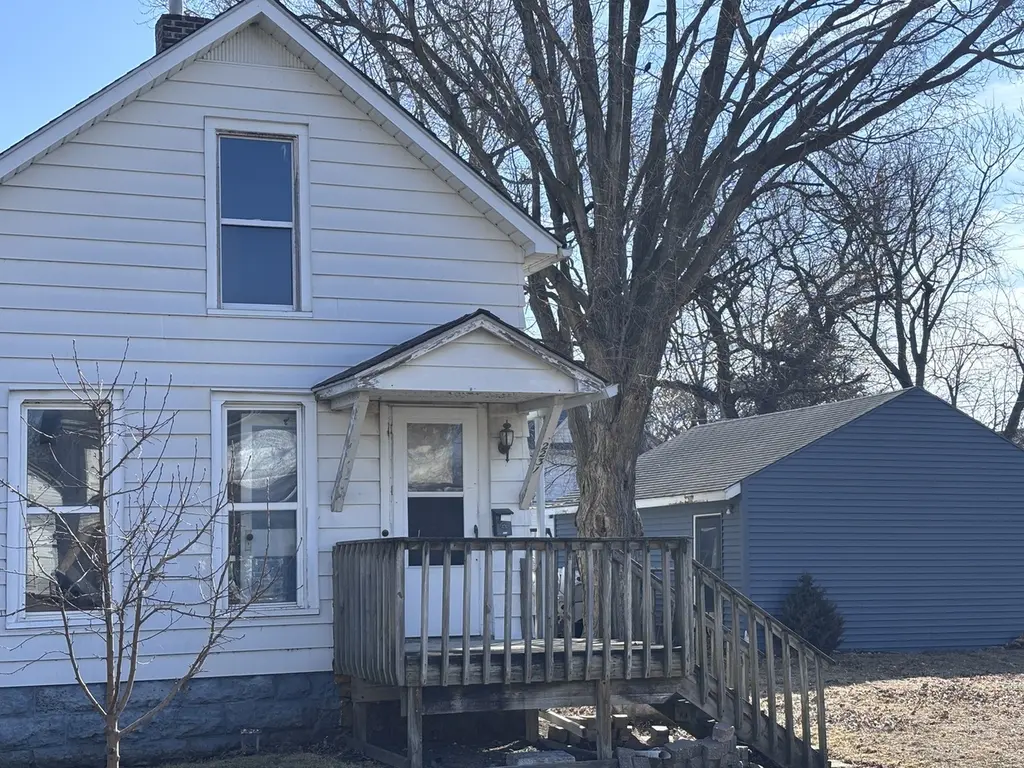
2231 Pershing Blvd Blvd · Clinton, IA
Flood risk 1/10 · Minimal
- FEMA flood zone
- X (unshaded)
- Chance of flooding over 30 yrs
- 0.0%
- Est. flood insurance / yr
- $473 – $860
Fire risk 3/10 · Minor
- Est. fire insurance / yr
- $902 – $1,676
Heat risk 3/10 · Minor
- Hot days now (above 103°F)
- 7 days/yr
- Hot days in 30 yrs
- 16 days/yr
Wind risk 2/10 · Minimal
- Chance of severe wind over 30 yrs
- —
Air-quality risk 3/10 · Minor
- Unhealthy air days now
- 2 days/yr
- Unhealthy air days in 30 yrs
- 3 days/yr
Risk factors via First Street. Map © Google.
Why this score? — see what drove the D+ grade
The composite is a weighted blend of 9 inputs, each scored 0–100. Each bar is that input's sub-score; the figure is the points it added to the 100-point composite (weight × sub-score).
- Cash flow +15.0/30.0
- ARV discount +7.5/15.0
- 1% rule +5.0/10.0
- DSCR +5.0/10.0
- Schools +4.5/10.0
- Livability +3.8/5.0
- Rent growth +2.5/5.0
- Condition / age +2.5/5.0
- Appreciation +0.0/10.0
$28,000
🖨 Deal sheet (PDF) 📄 Offer letter ✓ Due diligence
Listing remarks
Located in the Lyons part of town, this will be a very nice home (owner occupied or as a rental) with some work. Extra wide lot and in includes a nice size detached garage. Measurements are approximate
Key facts
- Extra wide lot
- Detached garage
- 3 garage spots
Tags
Neighborhood map
What this means for you Summary
Snapshot
- This is a 3-bed/1.0-bath single-family listed at $28k.
Deal economics
- At list price, monthly cash flow is $679 ($8k/yr) — positive.
- The deal already cash-flows at list — no discount required.
- Meets the 1% rule at list price ($1k rent vs $28k).
- Recommended offer: $25k (12.0% below list) — sets the bar for market timing.
- Cap rate 35.4% vs local median 6.7% in Clinton — top-decile yield for the area; either an underpriced asset or a hidden risk that comps aren't pricing in. Stress-test before assuming the spread holds.
Location & tenants
- Location reads 75/100 on livability (#222 in IA, #4,192 nationally) — a middle-class / working-renter tenant base. Strengths: cost of living A+, housing A+, health & safety A+; Watch: amenities C-, crime D, employment D.
- Clinton Community School District (town): math 52% / reading 56% proficiency, ranked #273 of 289 in IA (top 94%) — acceptable for families but not a draw, mixed tenant base, ~2y average lease.
- Market conditions: 246 active listings in the ZIP; 116 units permitted in Clinton County in 2024 (50 in 5+ unit buildings).
Forward outlook
- Local home prices are declining (-3.0%/yr); year-one equity from $194 of loan paydown is wiped out by about $840 of value loss. Plan a longer hold.
- Clinton County population projected at -19% by 2050 — secular population decline; favor cash flow + early exit over multi-decade hold.
- At projected returns (-3.0% appreciation + 3.0% rent growth), your $8k cash investment doubles in ~2 years — after that, you're playing with house money.
Negotiation context
- It's been on market 181 days — a 12% lower offer ($25k) is reasonable based on typical stale-listing flexibility.
- 3 sale attempts; this cycle's ask has dropped $32k (53%) from the opening price — seller is motivated, your offer sets the floor, not the list.
Risks & watch-outs
- Watch-outs: property tax is 4.1% of price; built in 1900 — expect roof / HVAC / electrical / plumbing capex.
Questions for the listing agent
- It's been on market 181 days. Have you received any prior offers? Is the seller open to a 12% concession, seller financing, or rate buy-down credit?
- Built in 1900 — when were the roof, HVAC, electrical panel, plumbing, and water heater last replaced?
- Property tax is high relative to price — has the assessment been appealed recently, and will the sale trigger a re-assessment?
- Why hasn't it sold? Are there any deal-killer items the seller is aware of (foundation, flood, title, zoning, code violations)?
- Is there a deadline driving the sale (1031 exchange, divorce, estate, relocation)? That informs how much negotiation room exists.
- Schools are B-rated — typically a magnet for longer-tenancy family renters. What's the average tenant stay here, and is there a school-zone premium baked into asking?
- Crime grade is D in this area — have there been break-ins, vandalism, or insurance claims at this property in the last 3 years? What carrier currently insures it and at what premium?
- The area grade is low — what's the realistic commute time and amenity access for the typical tenant pool here? Any planned neighborhood developments (good or bad) we should know about?
- What's the average days-on-market for RENTAL listings here right now (not sales)? A rising rental-DOM trend means longer vacancies and softer asking-rent achievability than the comps imply.
- What's the recent tenant-quality profile in this submarket — average credit score on applications, eviction rate, late-payment / NSF rate, and stable-employment percentage? A property-management company in the area should have these aggregated.
- How much new for-sale + rental construction is in the pipeline within 1–3 miles? Heavy new supply typically softens prices + rents 12–24 months out; constrained supply supports both.
Investment metrics
- 1% rule
- 4.22% ✓
- Cap rate
- 35.38%
- Cash-on-cash
- 103.89%
- DSCR
- 5.62
- GRM
- 2.0
CMA / ARV
- ARV (median comp)
- $78,516
- List price
- $28,000
- Delta
- -64.34%
- Verdict
- UNDERPRICED
- Comps
- 20 within 1.0 mi
Show comp detail 12 sales within ~0.75 mi
| Address | Dist | Beds/Ba | Sqft | Sold | Price | $/sf | Match |
|---|---|---|---|---|---|---|---|
| 2015 Garfield St | 0.28mi | 2/1.0 (-1) | 1,130 (+1%) | 1mo | $8,000 | $7 | 79 |
| 339 29th Ave N | 0.58mi | 3/1.0 | 1,096 (-2%) | 3mo | $130,000 | $119 | 68 |
| 511 16th Ave N | 0.68mi | 3/1.0 | 1,106 (-1%) | 6mo | $62,000 | $56 | 62 |
| 1919 N 7th St | 0.44mi | 2/1.5 (-1) | 1,182 (+6%) | 4mo | $67,000 | $57 | 59 |
| 2819 N 3rd St | 0.54mi | 2/2.0 (-1) | 1,160 (+4%) | 1mo | $144,900 | $125 | 58 |
| 722 Main Ave | 0.45mi | 3/1.0 | 988 (-11%) | 5mo | $25,000 | $25 | 56 |
| 1005 23rd Ave N | 0.54mi | 3/1.5 | 1,040 (-7%) | 8mo | $148,000 | $142 | 55 |
| 1614 Pershing Blvd | 0.58mi | 3/1.0 | 1,018 (-9%) | 6mo | $123,500 | $121 | 54 |
| 718 17th Ave N | 0.64mi | 2/1.5 (-1) | 1,192 (+7%) | 2mo | $100,000 | $84 | 50 |
| 2927 Pershing Blvd | 0.64mi | 2/1.0 (-1) | 1,250 (+12%) | 1mo | $130,000 | $104 | 44 |
| 1803 N 7th St | 0.53mi | 4/1.0 (+1) | 960 (-14%) | 9mo | $95,000 | $99 | 40 |
| 1619 Pershing Blvd | 0.56mi | 2/1.0 (-1) | 961 (-14%) | 9mo | $105,000 | $109 | 39 |
Match score weights: distance 35% · size 25% · config 20% · recency 20%. Top-matched comps best support the ARV.
Projected returns pro-forma
-3.0% appreciation · 3.0% rent growth · sell at horizon
- IRR
- —
- Equity multiple
- 5.94×
- Total profit
- $38,749
- Equity at exit
- $4,175
- IRR
- —
- Equity multiple
- 12.43×
- Total profit
- $89,633
- Equity at exit
- $2,421
Cash invested: $7,840 (down + closing). Projections, not guarantees.
Landlord ↔ Tenant lean methodology
- Overall (STATE)
- 83 Strongly Landlord-Friendly
- State Iowa
- 83 Strongly Landlord-Friendly · R+6
- County
- — inherits STATE
- City
- — inherits STATE
ZIP-level market 52732
- Home prices YoY
- -34.9%
- Active inventory
- 246
- Price-to-rent
- 2.0×
Monthly cashflow live
- Estimated rent
- $1,181 medium interval (Pro) →
- Mortgage (P&I)
- −$147
- Tax from tax record
- −$96 /mo · $1,150/yr
- Insurance
- −$12
- HOA
- −$0
- Vacancy / Maint / Mgmt
- −$248
- Net cashflow
- $679
Break-even live
Sensitivity live
| Price | -10% $695 | -5% $687 | +0% $679 | +5% $671 | +10% $663 |
|---|---|---|---|---|---|
| Rent | -10% $585 | -5% $632 | +0% $679 | +5% $725 | +10% $772 |
| Rate | -1.0pp $693 | -0.5pp $686 | base $679 | +0.5pp $672 | +1.0pp $664 |
UW: 25.0% down · 7.5% · 30yr · 1.5% tax · 5.0% vac · 8.0% maint · 8.0% mgmt
Financing live
Cash to close
- Down payment
- $7,000
- Closing costs
- $840
- Reserves months
- —
- Total cash needed
- —
Loan-product check · same deal, 3 products live
Conventional
25% down · 7.5% · 30yr
- Down + closing
- —
- Monthly P&I
- —
- Monthly cashflow
- —
- DSCR
- —
- Eligible?
- —
Personal DTI + credit; lowest rate.
DSCR
20% down · 8.5% · 30yr
- Down + closing
- —
- Monthly P&I
- —
- Monthly cashflow
- —
- DSCR
- —
- Eligible?
- —
No personal income docs; deal must DSCR.
Hard money
10% down · 12.0% · 12mo
- Down + closing
- —
- Monthly P&I
- —
- Monthly cashflow
- —
- DSCR
- —
- Eligible?
- —
Short-term bridge; refi at stabilization.
Listing history 24 events
-
2026-06-19days on market $28,000 Active 181 DOM
-
2026-06-18days on market $28,000 Active 180 DOM
-
2026-06-17days on market $28,000 Active 179 DOM
-
2026-06-16days on market $28,000 Active 178 DOM
-
2026-06-15days on market $28,000 Active 177 DOM
-
2026-06-14days on market $28,000 Active 175 DOM
-
2026-06-12days on market $28,000 Active 174 DOM
-
2026-06-09pricedays on market $28,000 Active 171 DOM
-
2026-06-08days on market $35,000 Active 170 DOM
-
2026-06-07days on market $35,000 Active 169 DOM
-
2026-06-07days on market $35,000 Active 168 DOM
-
2026-06-03days on market $35,000 Active 165 DOM
-
2026-06-02days on market $35,000 Active 164 DOM
-
2026-06-01days on market $35,000 Active 163 DOM
-
2026-05-31days on market $35,000 Active 162 DOM
-
2026-05-30days on market $35,000 Active 161 DOM
-
2026-04-22price $35,000
-
2026-03-06price $50,000
-
2026-01-08status Active
-
2026-01-06historical
-
2026-01-05historical
-
2025-12-18$60,000 Active
-
2025-12-18Active
-
2018-11-09soldstatus $27,000
ⓘ Source: listings_history table (triggers on properties + properties_extension) + one-shot
backfill from property_details.listing_events for pre-trigger history.
Tax reassessment forecast IA · Partial reset (capped growth)
- Current annual tax
- $1,150 · $96/mo
- Projected year-2 tax
- $1,150 · $96/mo
- Expected delta
- $0/yr ($0/mo · 0.0%)
ⓘ Screening estimate from a state-policy table — verify with the county assessor before closing.
Climate risk First Street
- Flood 1/10 Low FEMA zone X (unshaded) · 0% chance over 30 yrs
- Wildfire 3/10 Moderate
- Heat 3/10 Moderate 7 d/yr ≥103°F today · 16 d/yr by 30 yrs out
- Wind 2/10 Low
- Air quality 3/10 Moderate 2 unhealthy d/yr today · 3 by 30 yrs out
Nearby sold comps map
Loading sold comps map…
Walkable amenities ~0.75 mi
Loading nearby amenities…
Taxation est. · year 1
- Rental income
- $14,174
- − Mortgage interest
- −$1,568
- − Property taxes
- −$1,150
- − Insurance
- −$140
- − Repairs & maintenance
- −$1,134
- − Management
- −$1,134
- − Depreciation
- −$815
- Taxable income
- $8,233
- Est. tax owed @ 24.0%
- −$1,976
- After-tax cash flow
- $6,169/yr
For passive investors: Depreciation is non-cash, so a rental often shows a tax loss while cash-flowing — sheltering income. Rental losses are passive: they offset passive income freely, and up to $25,000/yr can offset ordinary (W-2) income if you actively participate and your MAGI is under $100k (phasing out to $0 by $150k); unused losses carry forward. On sale, claimed depreciation is recaptured at up to 25%, and gains may owe capital-gains tax (a 1031 exchange can defer both). Figures are a year-1 estimate at your 24.0% rate — not tax advice; consult a CPA.
Schools (NCES district)
- District
- Clinton Community School District
- NCES district ID
- 1907710
- Math proficiency
- 52% ▼ -13.00%
- Reading proficiency
- 56% ▼ -8.00%
- Median HH income
- $40,900
- Composite
- 45.22/100
- National rank
- #2666
- State rank
- #273 of 289 in IA
Livability — Clinton
- Score
- 75/100
- State rank
- #222
- US rank
- #4192
Category grades
Schools grade is shown separately in the Schools card above.
Census & demographics
- Census place
- Clinton, IA
- County
- Clinton County · 25,880 people
- City population
- 25,880
- Metro
- Clinton, IA
- Population (ZIP)
- 25,880
- Household income
- $61,105
- Rent vs Own
- Severe rent burden
- 889.0
Population outlook (Clinton County) Hauer SSP2
- Today (2025)
- 44,817 people
- By 2030
- 43,090 · -3.9%
- By 2040
- 39,513 · -11.8%
- By 2050
- 36,209 · -19.2%
- By 2075
- 31,888 · -28.8%
- By 2100
- 30,382 · -32.2%
Race, ethnicity, and origin ACS 2023
- Neighborhood character
- Predominantly White (86%)
- Race & ethnicity
- White 86% Two or more races 7% Hispanic / Latino 5% Black 4%
- Common ancestry
- Iranian 4% Portuguese 2% Lithuanian 2%
- Foreign-born
- 2% · Canada
- Languages at home
- 97% English-only · Spanish 2% Arabic 1%
Political lean MEDSL · Clinton
- 2024 margin
- R (+18.9) · D 39.8% · R 58.6% · Other 1.6%
- 2008→2024 swing
- -41.9pp toward R · 2008: 23.0pp · 2024: -18.9pp
- All cycles
- 2024: R+18.9 2020: R+10.3 2016: R+5.1 2012: D+22.9 2008: D+23.0
Not yet ingested
- Civics
- —
Market trends
- HPI YoY
- ▼ -83.23%
- Current HPI
- 155.3426
- Rent YoY
- —
- Metro
- Clinton, IA
- State GDP YoY
- ▲ 2.48%
- F500 in state
- 4
Industry mix (Fortune 500 HQ in IA)
| Industry | F500 HQs | Revenue |
|---|---|---|
| Financial Services | 1 | $16B |
|
||
| Retail / Convenience | 1 | $15B |
|
||
Price history
+29.6% since first listed8 events — show timeline
- 2026-04-22 Price Changed $35,000 MRED as Distributed by MLS Grid
- 2026-03-06 Price Changed $50,000 MRED as Distributed by MLS Grid
- 2026-01-08 Relisted — MRED as Distributed by MLS Grid
- 2026-01-06 Listing Removed — RMLSA as Distributed by MLS Grid
- 2026-01-05 Listing Removed — MRED as Distributed by MLS Grid
- 2025-12-18 Listed — RMLSA as Distributed by MLS Grid
- 2025-12-18 Listed $60,000 MRED as Distributed by MLS Grid
- 2018-11-09 Sold (Public Records) $27,000 Public Records
Property tax history
+3.6%/yrLatest (2025): $1,150 · +1.4% YoY. Source: county tax records.
Cash-flow waterfall
monthlySold comps — $/sqft
last 12 mo · ≤1 miLoading sold comps…