 🌊 Lakefront
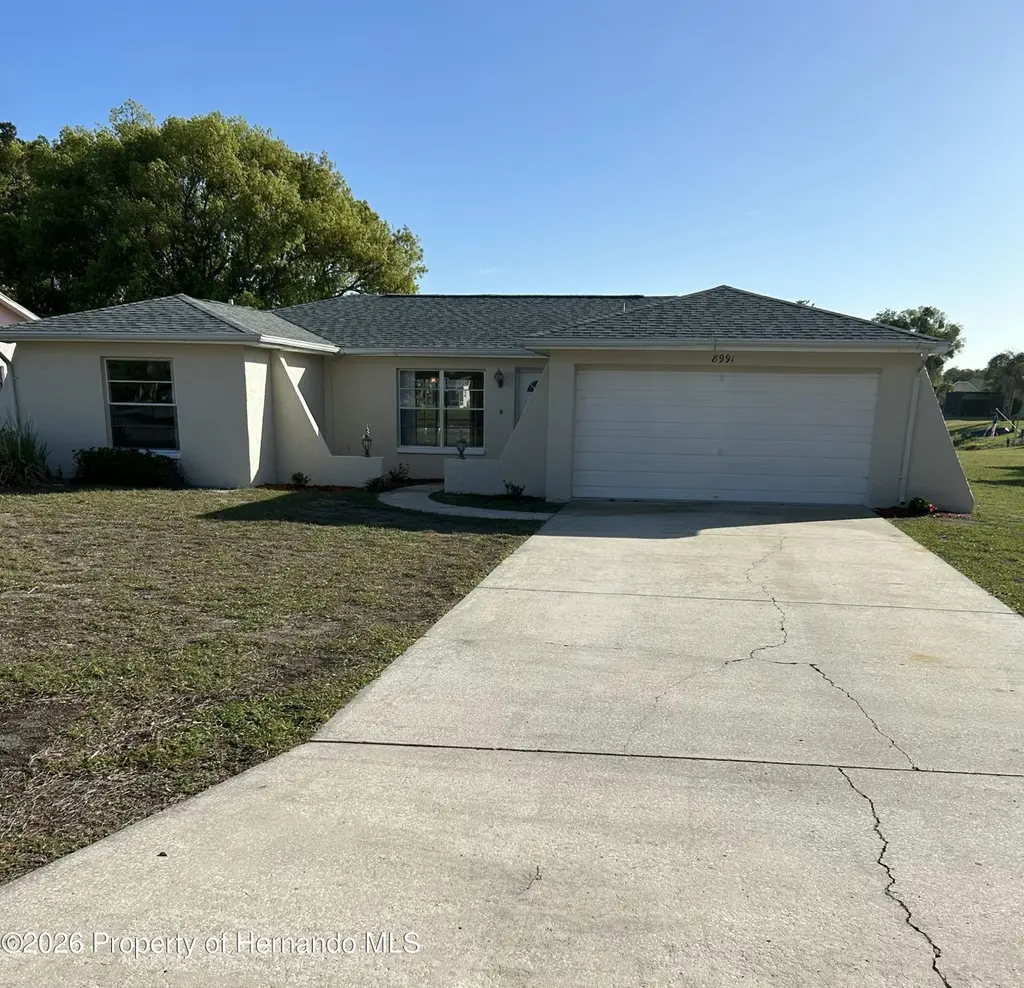
8991 Lismore Ct · North Weeki Wachee, FL
Flood risk 1/10 · Minimal
- FEMA flood zone
- X (unshaded)
- Chance of flooding over 30 yrs
- 0.0%
- Est. flood insurance / yr
- $507 – $1,088
Fire risk 6/10 · Moderate
- Est. fire insurance / yr
- $947 – $1,759
Heat risk 10/10 · Severe
- Hot days now (above 110°F)
- 7 days/yr
- Hot days in 30 yrs
- 25 days/yr
Wind risk 10/10 · Severe
- Chance of severe wind over 30 yrs
- 99.0%
Air-quality risk 3/10 · Minor
- Unhealthy air days now
- 1 days/yr
- Unhealthy air days in 30 yrs
- 4 days/yr
Risk factors via First Street. Map © Google.
Why this score? — see what drove the D- grade
The composite is a weighted blend of 9 inputs, each scored 0–100. Each bar is that input's sub-score; the figure is the points it added to the 100-point composite (weight × sub-score).
- Cash flow +12.8/30.0
- ARV discount +6.9/15.0
- Schools +4.2/10.0
- DSCR +3.8/10.0
- 1% rule +3.7/10.0
- Livability +3.4/5.0
- Rent growth +2.5/5.0
- Condition / age +2.5/5.0
- Appreciation +0.0/10.0
$199,900
🖨 Deal sheet 📄 Offer letter ✓ Due diligence
Listing remarks MLS
Lakefront pool home. 3/2/2 on lake in the Heather. Existing furnishings included. House needs some TLC, carpet and exterior painting. Nice neighborhood, small monthly maintenance fee. Central school system.
Key facts
- Roof in 2022
- Waterfront
- 8,712 sq ft lot
Tags
Neighborhood map
What this means for you Summary
Snapshot
- This is a 2-bed/2.0-bath single-family listed at $200k.
Deal economics
- At list price, monthly cash flow is $-17 ($-207/yr) — negative.
- To cash-flow at today's rent, offer at most $197k (1.5% below list).
- To meet the 1% rule (rent ≥ 1% of price), the offer needs to be $173k (13.4% below list).
- Recommended offer: $173k (13.4% below list) — sets the bar for 1% rule.
- Cap rate 6.2% vs local median 3.9% in North Weeki Wachee — top-decile yield for the area; either an underpriced asset or a hidden risk that comps aren't pricing in. Stress-test before assuming the spread holds.
Location & tenants
- Location reads 68/100 on livability (#534 in FL) — a middle-class / working-renter tenant base. Strengths: cost of living A+, housing A+, crime B+; Watch: health & safety C-, amenities F, commute F.
- Hernando (suburban): math 50% / reading 50% proficiency, ranked #38 of 73 in FL (top 52%) — acceptable for families but not a draw, mixed tenant base, ~2y average lease.
- Zoned schools: Pine Grove Elementary School (math 60% / reading 45%, grade C-, #976 of 2,144 statewide, top 46%, 991 students, 60% FRL); Weeki Wachee High School (math 41% / reading 42%, grade F, #284 of 667 statewide, top 43%, 1,435 students, 52% FRL) — zoned schools at 56% FRL track the district average.
- Market conditions: 691 active listings in the ZIP; 5 comparable units currently listed for rent nearby; rentals leasing fast (median 12d on market — plan ~1-2 weeks tenant-placement turnaround); 2,505 units permitted in Hernando County in 2024 (318 in 5+ unit buildings).
- This rent runs 35% of the median local income ($59k/yr) — at the standard rent-burdened threshold; future hikes will face affordability resistance.
Forward outlook
- Local home prices are declining (-3.0%/yr); year-one equity from $1k of loan paydown is wiped out by about $6k of value loss. Plan a longer hold.
- Hernando County population projected at +11% by 2050 — modest demand growth; plan on rents tracking national, not racing it.
Negotiation context
- Only 9 days on market — expect competitive offers; lowballing is unlikely to land.
- 3 sale attempts since 25y ago with the ask held roughly flat each time — persistent listings suggest the price (not the market) is what's stuck; bring a comps-based counter.
- Current owner paid $68k; list at $200k implies a 196% gain — meaningful room to come down on a strong offer.
Risks & watch-outs
- Climate carrying-cost: severe wind risk, 99% chance of damaging wind over 30y; major wildfire risk; extreme-heat days projected 7→25/yr by 2055 (HVAC capex compounding) — expect insurance premiums to compound above CPI over the hold.
Questions for the listing agent
- What do current leases actually rent for vs. the listed asking? Can we see a recent rent roll and the last 12 months of T-12 income?
- What does the HOA fee cover, when was the last increase, and are there any pending special assessments or reserve-fund shortfalls?
- Is there a deadline driving the sale (1031 exchange, divorce, estate, relocation)? That informs how much negotiation room exists.
- Schools are F-rated, which usually means shorter tenancies and higher turnover. Who's the typical renter profile here, and what's been the actual vacancy rate?
- The area grade is low — what's the realistic commute time and amenity access for the typical tenant pool here? Any planned neighborhood developments (good or bad) we should know about?
- This sits on a lake — are riparian / water-frontage rights deeded with the parcel? Any dock permits, shoreline easements, or HOA water-use restrictions?
- What's the documented flood / surge / shoreline-erosion history here (FEMA AND non-FEMA — e.g., storm surge, creek backup, septic-field saturation)?
- Any water-quality or seasonal algae-bloom issues that affect tenant satisfaction or short-term-rental demand?
- What's the average days-on-market for RENTAL listings here right now (not sales)? A rising rental-DOM trend means longer vacancies and softer asking-rent achievability than the comps imply.
- What's the recent tenant-quality profile in this submarket — average credit score on applications, eviction rate, late-payment / NSF rate, and stable-employment percentage? A property-management company in the area should have these aggregated.
- How much new for-sale + rental construction is in the pipeline within 1–3 miles? Heavy new supply typically softens prices + rents 12–24 months out; constrained supply supports both.
Investment metrics
- 1% rule
- 0.87% ✗
- Cap rate
- 6.19%
- Cash-on-cash
- -0.37%
- DSCR
- 0.98
- GRM
- 9.6
CMA / ARV
- ARV (on-the-fly)
- $197,393
- Comps found
- 12
Show comp detail 12 sales within ~0.75 mi
| Address | Dist | Beds/Ba | Sqft | Sold | Price | $/sf | Match |
|---|---|---|---|---|---|---|---|
| 8991 Lismore Ct | 0.00mi | 3/2.0 (+1) | 1,211 (0%) | 1mo | $197,000 | $163 | 94 |
| 8050 Roxburgh Ct | 0.17mi | 3/2.0 (+1) | 1,185 (-2%) | 5mo | $200,000 | $169 | 79 |
| 7291 Loch Ness Ct | 0.39mi | 2/2.0 | 1,211 (0%) | 6mo | $125,000 | $103 | 76 |
| 9127 Lingrove Rd | 0.23mi | 2/2.0 | 1,316 (+9%) | 0mo | $179,000 | $136 | 75 |
| 7486 Heather Walk Dr | 0.44mi | 2/2.0 | 1,211 (0%) | 6mo | $135,000 | $111 | 75 |
| 9139 Lingrove Rd | 0.24mi | 3/2.0 (+1) | 1,279 (+6%) | 6mo | $205,000 | $160 | 70 |
| 7275 Edinburgh Way | 0.35mi | 3/2.0 (+1) | 1,296 (+7%) | 1mo | $240,000 | $185 | 66 |
| 8026 Victoria Way | 0.54mi | 2/2.0 | 1,276 (+5%) | 1mo | $230,000 | $180 | 65 |
| 7435 Abington Way | 0.20mi | 2/1.0 | 1,035 (-14%) | 1mo | $210,000 | $203 | 61 |
| 9195 Lingrove Rd | 0.27mi | 3/2.0 (+1) | 1,387 (+14%) | 3mo | $191,000 | $138 | 56 |
| 9155 Lingrove Rd | 0.26mi | 3/2.0 (+1) | 1,387 (+14%) | 7mo | $199,000 | $143 | 53 |
| 9013 Nakoma Way | 0.59mi | 3/2.0 (+1) | 1,114 (-8%) | 2mo | $277,500 | $249 | 52 |
Match score weights: distance 35% · size 25% · config 20% · recency 20%. Top-matched comps best support the ARV.
Projected returns pro-forma
-3.0% appreciation · 3.0% rent growth · sell at horizon
- IRR
- -16.9%
- Equity multiple
- 0.40×
- Total profit
- $-33,464
- Equity at exit
- $29,806
- IRR
- -8.7%
- Equity multiple
- 0.46×
- Total profit
- $-30,442
- Equity at exit
- $17,284
Cash invested: $55,972 (down + closing). Projections, not guarantees.
Landlord ↔ Tenant lean methodology
- Overall (STATE)
- 87 Strongly Landlord-Friendly
- State Florida
- 87 Strongly Landlord-Friendly · R+3
- County
- — inherits STATE
- City
- — inherits STATE
ZIP-level market 34613
- Home prices YoY
- -17.2%
- Active inventory
- 691
- Price-to-rent
- 9.6×
Monthly cashflow live
- Estimated rent
- $1,731 high interval (Pro) →
- Mortgage (P&I)
- −$1,048
- Tax from tax record
- −$229 /mo · $2,747/yr
- Insurance
- −$83
- HOA
- −$24
- Vacancy / Maint / Mgmt
- −$363
- Net cashflow
- $-17
Break-even live
UW: 25.0% down · 7.5% · 30yr · 1.5% tax · 5.0% vac · 8.0% maint · 8.0% mgmt
Financing live
Cash to close
- Down payment
- $49,975
- Closing costs
- $5,997
- Reserves months
- —
- Total cash needed
- —
Loan-product check · same deal, 3 products live
Conventional
25% down · 7.5% · 30yr
- Down + closing
- —
- Monthly P&I
- —
- Monthly cashflow
- —
- DSCR
- —
- Eligible?
- —
Personal DTI + credit; lowest rate.
DSCR
20% down · 8.5% · 30yr
- Down + closing
- —
- Monthly P&I
- —
- Monthly cashflow
- —
- DSCR
- —
- Eligible?
- —
No personal income docs; deal must DSCR.
Hard money
10% down · 12.0% · 12mo
- Down + closing
- —
- Monthly P&I
- —
- Monthly cashflow
- —
- DSCR
- —
- Eligible?
- —
Short-term bridge; refi at stabilization.
Rent comps 5 comps
| Address | Beds | Baths | Sqft | Rent | $/sqft | DOM | Units | Dist |
|---|---|---|---|---|---|---|---|---|
| 7251 Mc Ginnes Ct Weeki Wachee, FL | 2.0 | 2.0 | 1360 | $1,695 | $1.25 | 5d | 1 | 0.08mi |
| 7425 Galloway Rd Weeki Wachee, FL | 2.0 | 2.0 | 936 | $1,600 | $1.71 | 12d | 1 | 0.39mi |
| 7569 Heather Walk Dr Weeki Wachee, FL | 2.0 | 2.0 | 1211 | $1,595 | $1.32 | 18d | 1 | 0.42mi |
| 8992 Hernando Way Weeki Wachee, FL | 2.0 | 2.0 | 1490 | $1,695 | $1.14 | 5d | 1 | 0.46mi |
| 7744 St Andrews Blvd Weeki Wachee, FL | 2.0 | 2.0 | 1142 | $1,450 | $1.27 | 24d | 1 | 0.46mi |
HOA detail
- Monthly dues
- $24 · $288/yr
- Likely covers
- pool
Listing history 9 events
-
2026-04-23status Pending
-
2026-04-16status Active
-
2026-04-06status Pending
-
2026-04-03$199,900 Active
-
2001-10-19soldstatus $67,500
-
2001-10-15soldstatus $1 206-char remark
Show marketing remark (206 chars)
Lakefront pool home. 3/2/2 on lake in the Heather. Existing furnishings included. House needs some TLC, carpet and exterior painting. Nice neighborhood, small monthly maintenance fee. Central school system.
-
2001-06-15$79,500 206-char remark
Show marketing remark (206 chars)
Lakefront pool home. 3/2/2 on lake in the Heather. Existing furnishings included. House needs some TLC, carpet and exterior painting. Nice neighborhood, small monthly maintenance fee. Central school system.
-
1990-07-01soldstatus $70,000
-
1984-10-01soldstatus $71,000
ⓘ Source: listings_history table (triggers on properties + properties_extension) + one-shot
backfill from property_details.listing_events for pre-trigger history.
Tax reassessment forecast FL · Resets to sale price
- Current annual tax
- $2,747 · $229/mo
- Projected year-2 tax
- $2,747 · $229/mo
- Expected delta
- $0/yr ($0/mo · 0.0%)
ⓘ Screening estimate from a state-policy table — verify with the county assessor before closing.
Climate risk First Street
- Flood 1/10 Low FEMA zone X (unshaded) · 0% chance over 30 yrs
- Wildfire 6/10 Major
- Heat 10/10 Extreme 7 d/yr ≥110°F today · 25 d/yr by 30 yrs out
- Wind 10/10 Extreme 99% chance of damaging wind over 30 yrs
- Air quality 3/10 Moderate 1 unhealthy d/yr today · 4 by 30 yrs out
Nearby sold comps map
Loading sold comps map…
Walkable amenities ~0.75 mi
Loading nearby amenities…
Taxation est. · year 1
- Rental income
- $20,768
- − Mortgage interest
- −$11,198
- − Property taxes
- −$2,747
- − Insurance
- −$1,000
- − Repairs & maintenance
- −$1,661
- − Management
- −$1,661
- − HOA
- −$288
- − Depreciation
- −$5,815
- Taxable loss
- −$3,602
- Est. tax savings @ 24.0%
- +$864
- After-tax cash flow
- $657/yr
For passive investors: Depreciation is non-cash, so a rental often shows a tax loss while cash-flowing — sheltering income. Rental losses are passive: they offset passive income freely, and up to $25,000/yr can offset ordinary (W-2) income if you actively participate and your MAGI is under $100k (phasing out to $0 by $150k); unused losses carry forward. On sale, claimed depreciation is recaptured at up to 25%, and gains may owe capital-gains tax (a 1031 exchange can defer both). Figures are a year-1 estimate at your 24.0% rate — not tax advice; consult a CPA.
Schools (NCES district)
- District
- Hernando
- NCES district ID
- 1200810
- Math proficiency
- 50% ▼ -8.00%
- Reading proficiency
- 50% ▼ -4.00%
- Median HH income
- $41,985
- Composite
- 42.03/100
- National rank
- #3329
- State rank
- #38 of 73 in FL
Livability — North Weeki Wachee
- Score
- 68/100
- State rank
- #534
- US rank
- #10019
Category grades
Schools grade is shown separately in the Schools card above.
Census & demographics
- Census place
- North Weeki Wachee, FL
- County
- Hernando County · 169,677 people
- City population
- 18,280
- Metro
- Tampa-St. Petersburg-Clearwater, FL
- Population (ZIP)
- 19,337
- Household income
- $58,596
- Rent vs Own
- Severe rent burden
- 307.0
Population outlook (Hernando County) Hauer SSP2
- Today (2025)
- 189,218 people
- By 2030
- 194,367 · +2.7%
- By 2040
- 203,398 · +7.5%
- By 2050
- 209,589 · +10.8%
- By 2075
- 218,452 · +15.4%
- By 2100
- 205,923 · +8.8%
Race, ethnicity, and origin ACS 2023
- Neighborhood character
- Predominantly White (88%)
- Race & ethnicity
- White 88% Hispanic / Latino 6% Two or more races 4% Black 2% Asian 1%
- Hispanic origin (detail)
- Mexican 1% Puerto Rican 2% Cuban 1%
- Common ancestry
- Romanian 4% Lithuanian 3% Slovak 2%
- Foreign-born
- 8% · Canada, Vietnam
- Languages at home
- 92% English-only · Spanish 3% French/Haitian/Cajun 1% Russian/Polish/Slavic 1%
Political lean MEDSL · Hernando
- 2024 margin
- Solid R (+37.0) · D 31.1% · R 68.2%
- 2008→2024 swing
- -33.5pp toward R · 2008: -3.6pp · 2024: -37.0pp
- All cycles
- 2024: R+37.0 2020: R+30.2 2016: R+29.0 2012: R+8.5 2008: R+3.6
Not yet ingested
- Civics
- —
Market trends
- HPI YoY
- ▼ -57.51%
- Current HPI
- 276.2229
- Rent YoY
- —
- Metro
- Tampa-St. Petersburg-Clearwater, FL
- State GDP YoY
- ▲ 3.28%
- F500 in state
- 36
Industry mix (Fortune 500 HQ in FL)
| Industry | F500 HQs | Revenue |
|---|---|---|
| Industrial Technology | 2 | $29B |
|
||
| Insurance | 2 | $17B |
|
||
| Retail | 1 | $60B |
|
||
| Technology Distribution | 1 | $58B |
|
||
| Homebuilding | 1 | $35B |
|
||
| Technology Manufacturing | 1 | $35B |
|
||
Price history
+181.5% since first listed9 events — show timeline
- 2026-04-23 Pending — HCAR
- 2026-04-16 Relisted — HCAR
- 2026-04-06 Pending — HCAR
- 2026-04-03 Listed $199,900 HCAR
- 2001-10-19 Sold (Public Records) $67,500 Public Records
- 2001-10-15 Sold (MLS) $1 HCAR
- 2001-06-15 Listed $79,500 HCAR
- 1990-07-01 Sold (Public Records) $70,000 Public Records
- 1984-10-01 Sold (Public Records) $71,000 Public Records
Property tax history
+6.9%/yrLatest (2025): $2,747 · -0.8% YoY. Source: county tax records.
Cash-flow waterfall
monthlySold comps — $/sqft
last 12 mo · ≤1 miLoading sold comps…