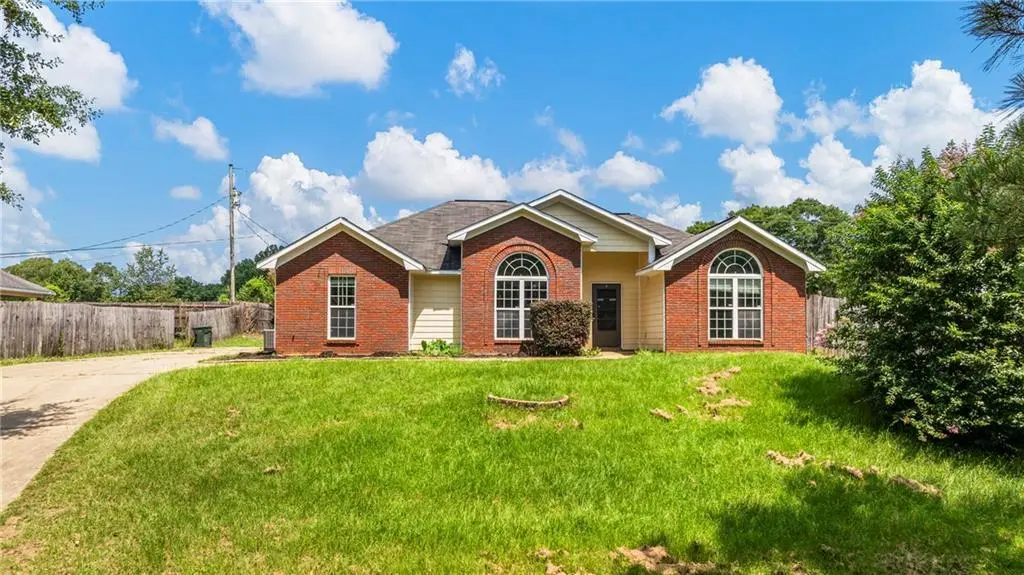
60 Duke Dr · Cusseta-Chattahoochee County, GA
Flood risk 1/10 · Minimal
- FEMA flood zone
- X (unshaded)
- Chance of flooding over 30 yrs
- 0.0%
- Est. flood insurance / yr
- $507 – $1,088
Fire risk 4/10 · Minor
- Est. fire insurance / yr
- $916 – $1,700
Heat risk 8/10 · Major
- Hot days now (above 107°F)
- 7 days/yr
- Hot days in 30 yrs
- 19 days/yr
Wind risk 8/10 · Major
- Chance of severe wind over 30 yrs
- 80.0%
Air-quality risk 2/10 · Minimal
- Unhealthy air days now
- 2 days/yr
- Unhealthy air days in 30 yrs
- 2 days/yr
Risk factors via First Street. Map © Google.
Why this score? — see what drove the C- grade
The composite is a weighted blend of 9 inputs, each scored 0–100. Each bar is that input's sub-score; the figure is the points it added to the 100-point composite (weight × sub-score).
- Cash flow +17.0/30.0
- ARV discount +11.2/15.0
- Appreciation +6.1/10.0
- DSCR +5.3/10.0
- 1% rule +3.3/10.0
- Schools +2.6/10.0
- Rent growth +2.5/5.0
- Livability +2.5/5.0
- Condition / age +2.5/5.0
$225,000
🖨 Deal sheet 📄 Offer letter ✓ Due diligence
Listing remarks MLS
Charming all-brick ranch with character and space to spare, 60 Duke Drive is ready for its next chapter. Step inside to a spacious living area with vaulted ceilings and a striking arched picture window that floods the room with natural light. The open layout flows easily into a generous kitchen featuring rich wood cabinetry, and granite-style countertops. The spacious primary suite has vaulted ceilings, a large walk-in closet, and an en suite bath complete with a double vanity, garden tub, and separate shower. Two additional bedrooms provide flexible space for family, guests, or a home office. Outside, the large fenced backyard backs up to mature trees for added privacy, with plenty of room to play, garden, or simply enjoy the outdoors. Solid brick construction, a functional layout, and a backyard built for relaxing, this one is ready for you to make it home. Conveniently located close to Ft. Benning.
Key facts
- Generous kitchen
- Rich wood cabinetry
- All brick ranch
Tags
Neighborhood map
What this means for you Summary
Snapshot
- This is a 3-bed/2.0-bath single-family listed at $225k.
Deal economics
- At list price, monthly cash flow is $151 ($2k/yr) — positive.
- The deal already cash-flows at list — no discount required.
- To meet the 1% rule (rent ≥ 1% of price), the offer needs to be $187k (16.7% below list).
- Recommended offer: $187k (16.7% below list) — sets the bar for 1% rule.
- Cap rate 7.1% vs local median 4.1% in Cusseta-Chattahoochee County — top-decile yield for the area; either an underpriced asset or a hidden risk that comps aren't pricing in. Stress-test before assuming the spread holds.
Location & tenants
- Location reads: area grade C — affects rentability + tenant quality, not the cash-flow math above.
- Russell County (rural): math 18% / reading 45% proficiency, ranked #65 of 129 in AL (top 50%) — families likely to look elsewhere, expect single-tenant / working-renter base with shorter leases.
- Market conditions: Solid renter incomes; 183 units permitted in Russell County in 2024 (0 in 5+ unit buildings).
Forward outlook
- In year one you build about $7k of equity ($2k loan paydown + $5k appreciation (2.2% local appreciation)).
- Russell County population projected at +42% by 2050 — long-run rental-demand tailwind backs the buy-and-hold thesis.
- At projected returns (2.2% appreciation + 3.0% rent growth), your $63k cash investment doubles in ~7 years — after that, you're playing with house money.
- By year 6, paydown + projected appreciation supports a ~$35k cash-out refi (75% LTV) — recoverable capital for the next deal without selling this one.
Negotiation context
- Only 6 days on market — expect competitive offers; lowballing is unlikely to land.
- 9 sale attempts since 9y ago with the ask held roughly flat each time — persistent listings suggest the price (not the market) is what's stuck; bring a comps-based counter.
- Current owner paid $182k; 24% above their basis — modest negotiation headroom, anchor on the comps not their cost.
Risks & watch-outs
- Climate carrying-cost: severe wind risk, 80% chance of damaging wind over 30y; extreme-heat days projected 7→19/yr by 2055 (HVAC capex compounding) — expect insurance premiums to compound above CPI over the hold.
Questions for the listing agent
- Is there a deadline driving the sale (1031 exchange, divorce, estate, relocation)? That informs how much negotiation room exists.
- What's the average days-on-market for RENTAL listings here right now (not sales)? A rising rental-DOM trend means longer vacancies and softer asking-rent achievability than the comps imply.
- What's the recent tenant-quality profile in this submarket — average credit score on applications, eviction rate, late-payment / NSF rate, and stable-employment percentage? A property-management company in the area should have these aggregated.
- How much new for-sale + rental construction is in the pipeline within 1–3 miles? Heavy new supply typically softens prices + rents 12–24 months out; constrained supply supports both.
Investment metrics
- 1% rule
- 0.83% ✗
- Cap rate
- 7.10%
- Cash-on-cash
- 2.88%
- DSCR
- 1.13
- GRM
- 10.0
CMA / ARV
- ARV (on-the-fly)
- $245,224
- Comps found
- 9
Show comp detail 9 sales within ~0.75 mi
| Address | Dist | Beds/Ba | Sqft | Sold | Price | $/sf | Match |
|---|---|---|---|---|---|---|---|
| 2 Ihagee Creek Dr | 0.06mi | 3/2.0 | 1,574 (-3%) | 8mo | $245,000 | $156 | 86 |
| 10 Ihagee Creek Ct | 0.12mi | 3/2.0 | 1,540 (-5%) | 1mo | $238,500 | $155 | 86 |
| 2 Ihagee Creek Ct | 0.12mi | 3/2.0 | 1,586 (-2%) | 12mo | $273,000 | $172 | 80 |
| 30 Duke Dr | 0.19mi | 3/2.0 | 1,601 (-1%) | 13mo | $135,000 | $84 | 78 |
| 6 Ihagee Creek Dr | 0.07mi | 3/2.0 | 1,607 (-1%) | 21mo | $229,900 | $143 | 77 |
| 2 Duke Ct | 0.20mi | 2/1.0 (-1) | 1,684 (+4%) | 7mo | $65,000 | $39 | 69 |
| 17 Duke Dr | 0.38mi | 3/2.0 | 1,520 (-6%) | 12mo | $235,000 | $155 | 62 |
| 20 Duke Dr | 0.31mi | 3/2.0 | 1,462 (-10%) | 21mo | $220,050 | $151 | 52 |
| 43 Norman Dr | 0.22mi | 3/2.0 | 1,848 (+14%) | 18mo | $65,000 | $35 | 51 |
Match score weights: distance 35% · size 25% · config 20% · recency 20%. Top-matched comps best support the ARV.
Projected returns pro-forma
2.25% appreciation · 3.0% rent growth · sell at horizon
- IRR
- 8.1%
- Equity multiple
- 1.44×
- Total profit
- $27,844
- Equity at exit
- $91,838
- IRR
- 11.1%
- Equity multiple
- 2.54×
- Total profit
- $96,772
- Equity at exit
- $134,665
Cash invested: $63,000 (down + closing). Projections, not guarantees.
Landlord ↔ Tenant lean methodology
- Overall (STATE)
- 90 Strongly Landlord-Friendly
- State Georgia
- 90 Strongly Landlord-Friendly · R+3
- County
- — inherits STATE
- City
- — inherits STATE
ZIP-level market 36856
- Home prices YoY
- 1.4%
- Price-to-rent
- 10.0×
Monthly cashflow live
- Estimated rent
- $1,873 medium interval (Pro) →
- Mortgage (P&I)
- −$1,180
- Tax from tax record
- −$55 /mo · $662/yr
- Insurance
- −$94
- HOA
- −$0
- Vacancy / Maint / Mgmt
- −$393
- Net cashflow
- $151
Break-even live
UW: 25.0% down · 7.5% · 30yr · 1.5% tax · 5.0% vac · 8.0% maint · 8.0% mgmt
Financing live
Cash to close
- Down payment
- $56,250
- Closing costs
- $6,750
- Reserves months
- —
- Total cash needed
- —
Loan-product check · same deal, 3 products live
Conventional
25% down · 7.5% · 30yr
- Down + closing
- —
- Monthly P&I
- —
- Monthly cashflow
- —
- DSCR
- —
- Eligible?
- —
Personal DTI + credit; lowest rate.
DSCR
20% down · 8.5% · 30yr
- Down + closing
- —
- Monthly P&I
- —
- Monthly cashflow
- —
- DSCR
- —
- Eligible?
- —
No personal income docs; deal must DSCR.
Hard money
10% down · 12.0% · 12mo
- Down + closing
- —
- Monthly P&I
- —
- Monthly cashflow
- —
- DSCR
- —
- Eligible?
- —
Short-term bridge; refi at stabilization.
Listing history 6 events
-
2026-06-18days on market $225,000 Active 6 DOM
-
2026-06-17days on market $225,000 Active 5 DOM
-
2026-06-16days on market $225,000 Active 4 DOM
-
2026-06-15days on market $225,000 Active 3 DOM
-
2026-06-13remarks 699-char remark
-
2026-06-13$225,000 Active 1 DOM
ⓘ Source: listings_history table (triggers on properties + properties_extension) + one-shot
backfill from property_details.listing_events for pre-trigger history.
Tax reassessment forecast GA · Resets to sale price
- Current annual tax
- $662 · $55/mo
- Projected year-2 tax
- $2,070 · $172/mo
- Expected delta
- +$1,408/yr (+$117/mo · 212.7%)
ⓘ Screening estimate from a state-policy table — verify with the county assessor before closing.
Climate risk First Street
- Flood 1/10 Low FEMA zone X (unshaded) · 0% chance over 30 yrs
- Wildfire 4/10 Moderate
- Heat 8/10 Severe 7 d/yr ≥107°F today · 19 d/yr by 30 yrs out
- Wind 8/10 Severe 80% chance of damaging wind over 30 yrs
- Air quality 2/10 Low 2 unhealthy d/yr today · 2 by 30 yrs out
Nearby sold comps map
Loading sold comps map…
Walkable amenities ~0.75 mi
Loading nearby amenities…
Taxation est. · year 1
- Rental income
- $22,480
- − Mortgage interest
- −$12,603
- − Property taxes
- −$662
- − Insurance
- −$1,125
- − Repairs & maintenance
- −$1,798
- − Management
- −$1,798
- − Depreciation
- −$6,545
- Taxable loss
- −$2,053
- Est. tax savings @ 24.0%
- +$493
- After-tax cash flow
- $2,306/yr
For passive investors: Depreciation is non-cash, so a rental often shows a tax loss while cash-flowing — sheltering income. Rental losses are passive: they offset passive income freely, and up to $25,000/yr can offset ordinary (W-2) income if you actively participate and your MAGI is under $100k (phasing out to $0 by $150k); unused losses carry forward. On sale, claimed depreciation is recaptured at up to 25%, and gains may owe capital-gains tax (a 1031 exchange can defer both). Figures are a year-1 estimate at your 24.0% rate — not tax advice; consult a CPA.
Schools (NCES district)
- District
- Russell County
- NCES district ID
- 0102880
- Math proficiency
- 18% ▼ -28.00%
- Reading proficiency
- 45% ▲ 1.00%
- Median HH income
- $40,292
- Composite
- 26.41/100
- National rank
- #7226
- State rank
- #65 of 129 in AL
Livability — Cusseta-Chattahoochee County
No livability data for this city. (Only ~50 U.S. cities are tracked.)
Census & demographics
- County
- Russell County
- City population
- 17,852
- Metro
- Columbus, GA-AL
- Population (ZIP)
- 8,716
- Household income
- $75,381
- Rent vs Own
- Severe rent burden
- 14.0
Population outlook (Russell County) Hauer SSP2
- Today (2025)
- 70,137 people
- By 2030
- 75,826 · +8.1%
- By 2040
- 87,858 · +25.3%
- By 2050
- 99,721 · +42.2%
- By 2075
- 128,009 · +82.5%
- By 2100
- 149,251 · +112.8%
Race, ethnicity, and origin ACS 2023
- Neighborhood character
- Diverse neighborhood (Simpson 0.60)
- Race & ethnicity
- Black 53% White 32% Hispanic / Latino 13% Two or more races 5%
- Hispanic origin (detail)
- Mexican 5% Puerto Rican 4% Dominican 3%
- Common ancestry
- French 1% Iranian 1% Portuguese 1%
- Foreign-born
- 3% · Canada
- Languages at home
- 94% English-only · Spanish 5% Russian/Polish/Slavic 1%
Political lean MEDSL · Russell
- 2024 margin
- Toss-up / Even · D 50.4% · R 48.7%
- 2008→2024 swing
- -5.6pp toward R · 2008: 7.3pp · 2024: 1.7pp
- All cycles
- 2024: D+1.7 2020: D+6.4 2016: D+1.9 2012: D+11.8 2008: D+7.3
Not yet ingested
- Civics
- —
Market trends
- HPI YoY
- ▲ 2.25%
- Current HPI
- 169.099
- Rent YoY
- —
- Metro
- Columbus, GA-AL
- State GDP YoY
- ▲ 2.66%
- F500 in state
- 28
Industry mix (Fortune 500 HQ in GA)
| Industry | F500 HQs | Revenue |
|---|---|---|
| Paper / Packaging | 2 | $29B |
|
||
| Retail | 1 | $160B |
|
||
| Transportation / Logistics | 1 | $91B |
|
||
| Airlines | 1 | $62B |
|
||
| Consumer Goods | 1 | $47B |
|
||
| Utilities | 1 | $25B |
|
||
Price history
+100.0% since first listed20 events — show timeline
- 2026-06-12 Listed $225,000 EABOR
- 2022-12-09 Sold (Public Records) $182,000 Public Records
- 2022-12-09 Sold (MLS) $182,000 EABOR
- 2022-12-09 Sold (MLS) $182,000 EABOR
- 2022-11-10 Pending — EABOR
- 2022-11-04 Relisted — EABOR
- 2022-10-17 Pending — EABOR
- 2022-10-07 Price Changed $176,900 EABOR
- 2022-09-12 Relisted — EABOR
- 2022-08-17 Price Changed $172,000 EABOR
- 2022-08-16 Listed $176,900 EABOR
- 2022-08-16 Listed $175,000 EABOR
- 2022-01-04 Sold (MLS) $160,000 EABOR
- 2022-01-04 Sold (MLS) $160,000 EABOR
- 2022-01-04 Sold (MLS) $160,000 CBOR
- 2021-08-28 Listed $160,000 EABOR
- 2021-08-28 Listed $160,000 EABOR
- 2021-08-28 Listed $160,000 CBOR
- 2018-05-09 Sold (MLS) $112,500 EABOR
- 2017-09-01 Listed $112,500 EABOR
Property tax history
+3.2%/yrLatest (2025): $662 · -51.2% YoY. Source: county tax records.
Cash-flow waterfall
monthlySold comps — $/sqft
last 12 mo · ≤1 miLoading sold comps…