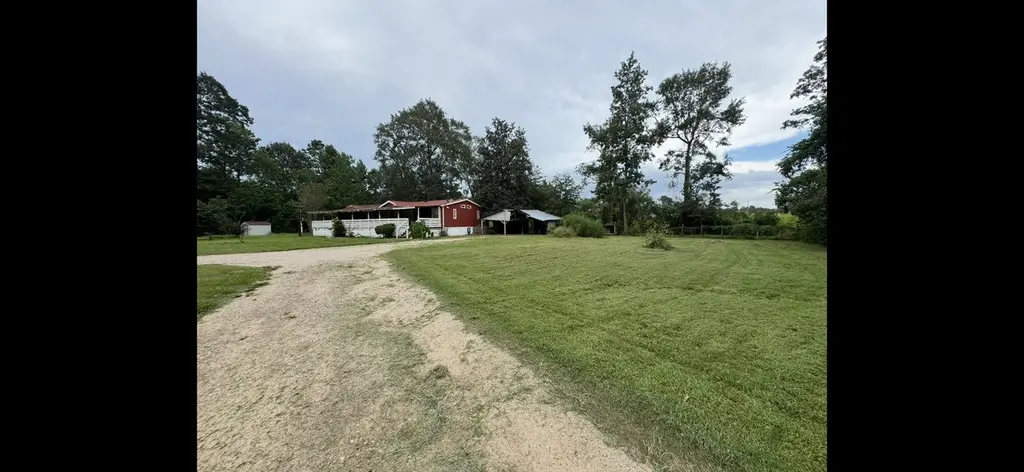
19948 Lindley Woods St · Deerwood, TX
Flood risk 1/10 · Minimal
- FEMA flood zone
- X (unshaded)
- Chance of flooding over 30 yrs
- 0.0%
- Est. flood insurance / yr
- $507 – $1,088
Fire risk 6/10 · Moderate
- Est. fire insurance / yr
- $1,222 – $2,270
Heat risk 8/10 · Major
- Hot days now (above 110°F)
- 7 days/yr
- Hot days in 30 yrs
- 24 days/yr
Wind risk 8/10 · Major
- Chance of severe wind over 30 yrs
- 99.0%
Air-quality risk 2/10 · Minimal
- Unhealthy air days now
- 2 days/yr
- Unhealthy air days in 30 yrs
- 2 days/yr
Risk factors via First Street. Map © Google.
Why this score? — see what drove the C grade
The composite is a weighted blend of 9 inputs, each scored 0–100. Each bar is that input's sub-score; the figure is the points it added to the 100-point composite (weight × sub-score).
- Cash flow +23.6/30.0
- DSCR +7.6/10.0
- ARV discount +7.5/15.0
- Schools +5.1/10.0
- 1% rule +4.9/10.0
- Rent growth +2.5/5.0
- Livability +2.5/5.0
- Condition / age +2.5/5.0
- Appreciation +0.0/10.0
$195,000
🖨 Deal sheet (PDF) 📄 Offer letter ✓ Due diligence
Listing remarks
Enjoy space, comfort, and convenience in Cleveland, TX! This Beautiful home at 19948 Lindley Woods sits on a full acre of land, offering plenty of room for outdoor living, gardening, or future projects. Inside, you'll find a spacious, open-concept layout with abundant natural light and updated finishes- perfect for both everyday living and entertaining. Located in a peaceful neighborhood while still close to shopping, dining, and major highways, this property combines country charm with city convenience!
Key facts
- Updated finishes
- Full acre of land
- Outdoor living
Tags
Property features AI
Exterior
- Utilities: Well water; Septic tank
- Home design: Residential property; Single-level entry
- Construction: Built in 2002; Block foundation; Composition roof; Construction materials: Unknown
- Exterior features: Cul-de-sac lot; Additional parcels included
Interior
- Bedrooms: Primary bedroom on first floor (approx. 12 x 16); Two additional first-floor bedrooms (each approx. 10 x 12)
- Bathrooms: Three full bathrooms
- Heating & cooling: Central heating (electric); Central air conditioning (electric)
- Interior features: Three total rooms
Neighborhood map
What this means for you Summary
Snapshot
- This is a 3-bed/3.0-bath manufactured listed at $195k.
Deal economics
- At list price, monthly cash flow is $366 ($4k/yr) — positive.
- The deal already cash-flows at list — no discount required.
- To meet the 1% rule (rent ≥ 1% of price), the offer needs to be $194k (0.6% below list).
- Recommended offer: $192k (1.5% below list) — sets the bar for market timing.
- Cap rate 8.5% vs local median 5.4% in Deerwood — top-decile yield for the area; either an underpriced asset or a hidden risk that comps aren't pricing in. Stress-test before assuming the spread holds.
Location & tenants
- Location reads: area grade C — affects rentability + tenant quality, not the cash-flow math above.
- Conroe ISD (other): math 57% / reading 57% proficiency, ranked #69 of 826 in TX (top 8%) — acceptable for families but not a draw, mixed tenant base, ~2y average lease.
- Zoned schools: Austin El (math 39% / reading 29%, grade F, #2,149 of 4,322 statewide, top 50%, 950 students, 81% FRL); Moorhead J H (math 35% / reading 42%, grade F, #704 of 1,662 statewide, top 43%, 1,391 students, 82% FRL); Caney Creek H S (math 33% / reading 42%, grade F, #888 of 1,632 statewide, top 55%, 2,504 students, 79% FRL) — zoned schools average 81% FRL vs 34% district-wide (46 pts higher); higher-poverty schools than district average — tighter screening recommended.
- Zoned-school proficiency averages 37% at this address vs 57% district-wide (-20 pts) — the specific schools serving this property underperform the Conroe ISD average; the district grade overstates school quality for this exact location.
- Market conditions: 339 active listings in the ZIP; 2 comparable units currently listed for rent nearby; 13,259 units permitted in Montgomery County in 2024 (1,402 in 5+ unit buildings).
- This rent runs 37% of the median local income ($62k/yr) — at the standard rent-burdened threshold; future hikes will face affordability resistance.
Forward outlook
- Local home prices are declining (-3.0%/yr); year-one equity from $1k of loan paydown is wiped out by about $6k of value loss. Plan a longer hold.
- Montgomery County population projected at +65% by 2050 — long-run rental-demand tailwind backs the buy-and-hold thesis.
Negotiation context
- It's been on market 30 days — a 2% lower offer ($192k) is reasonable based on typical stale-listing flexibility.
- 5 sale attempts with the ask held roughly flat each time — persistent listings suggest the price (not the market) is what's stuck; bring a comps-based counter.
Risks & watch-outs
- Climate carrying-cost: severe wind risk, 99% chance of damaging wind over 30y; major wildfire risk; extreme-heat days projected 7→24/yr by 2055 (HVAC capex compounding) — expect insurance premiums to compound above CPI over the hold.
Questions for the listing agent
- Is there a deadline driving the sale (1031 exchange, divorce, estate, relocation)? That informs how much negotiation room exists.
- What's the average days-on-market for RENTAL listings here right now (not sales)? A rising rental-DOM trend means longer vacancies and softer asking-rent achievability than the comps imply.
- What's the recent tenant-quality profile in this submarket — average credit score on applications, eviction rate, late-payment / NSF rate, and stable-employment percentage? A property-management company in the area should have these aggregated.
- How much new for-sale + rental construction is in the pipeline within 1–3 miles? Heavy new supply typically softens prices + rents 12–24 months out; constrained supply supports both.
Investment metrics
- 1% rule
- 0.99% ✗
- Cap rate
- 8.55%
- Cash-on-cash
- 8.04%
- DSCR
- 1.36
- GRM
- 8.4
CMA / ARV
No comps found within radius.
Projected returns pro-forma
-3.0% appreciation · 3.0% rent growth · sell at horizon
- IRR
- -4.1%
- Equity multiple
- 0.85×
- Total profit
- $-8,371
- Equity at exit
- $29,075
- IRR
- 5.5%
- Equity multiple
- 1.41×
- Total profit
- $22,390
- Equity at exit
- $16,860
Cash invested: $54,600 (down + closing). Projections, not guarantees.
Landlord ↔ Tenant lean methodology
- Overall (STATE)
- 87 Strongly Landlord-Friendly
- State Texas
- 87 Strongly Landlord-Friendly · R+5
- County
- — inherits STATE
- City
- — inherits STATE
ZIP-level market 77328
- Home prices YoY
- -7.7%
- Active inventory
- 339
- Price-to-rent
- 8.4×
Monthly cashflow live
- Estimated rent
- $1,939 medium interval (Pro) →
- Mortgage (P&I)
- −$1,023
- Tax from tax record
- −$62 /mo · $745/yr
- Insurance
- −$81
- HOA
- −$0
- Vacancy / Maint / Mgmt
- −$407
- Net cashflow
- $366
Break-even live
Sensitivity live
| Price | -10% $476 | -5% $421 | +0% $366 | +5% $311 | +10% $256 |
|---|---|---|---|---|---|
| Rent | -10% $213 | -5% $289 | +0% $366 | +5% $443 | +10% $519 |
| Rate | -1.0pp $464 | -0.5pp $416 | base $366 | +0.5pp $315 | +1.0pp $264 |
UW: 25.0% down · 7.5% · 30yr · 1.5% tax · 5.0% vac · 8.0% maint · 8.0% mgmt
Financing live
Cash to close
- Down payment
- $48,750
- Closing costs
- $5,850
- Reserves months
- —
- Total cash needed
- —
Loan-product check · same deal, 3 products live
Conventional
25% down · 7.5% · 30yr
- Down + closing
- —
- Monthly P&I
- —
- Monthly cashflow
- —
- DSCR
- —
- Eligible?
- —
Personal DTI + credit; lowest rate.
DSCR
20% down · 8.5% · 30yr
- Down + closing
- —
- Monthly P&I
- —
- Monthly cashflow
- —
- DSCR
- —
- Eligible?
- —
No personal income docs; deal must DSCR.
Hard money
10% down · 12.0% · 12mo
- Down + closing
- —
- Monthly P&I
- —
- Monthly cashflow
- —
- DSCR
- —
- Eligible?
- —
Short-term bridge; refi at stabilization.
Rent comps 2 comps
| Address | Beds | Baths | Sqft | Rent | $/sqft | DOM | Units | Dist |
|---|---|---|---|---|---|---|---|---|
| 308 Kinsman Rd Cleveland, TX | 3.0 | 1.5 | 1400 | $1,650 | $1.18 | 45d | 1 | 1.03mi |
| 308 Kinsman Rd Cleveland, TX | 3.0 | 1.5 | 1400 | $1,650 | $1.18 | 8d | 1 | 1.03mi |
Listing history 27 events
-
2026-06-21days on market $195,000 Active 30 DOM
-
2026-06-18days on market $195,000 Active 27 DOM
-
2026-06-17days on market $195,000 Active 26 DOM
-
2026-06-16days on market $195,000 Active 25 DOM
-
2026-06-15days on market $195,000 Active 24 DOM
-
2026-06-13days on market $195,000 Active 22 DOM
-
2026-06-09days on market $195,000 Active 18 DOM
-
2026-06-08days on market $195,000 Active 17 DOM
-
2026-06-07days on market $195,000 Active 16 DOM
-
2026-06-04days on market $195,000 Active 13 DOM
-
2026-06-03days on market $195,000 Active 12 DOM
-
2026-06-02days on market $195,000 Active 11 DOM
-
2026-06-01days on market $195,000 Active 10 DOM
-
2026-05-31days on market $195,000 Active 9 DOM
-
2026-05-22$195,000 Active
-
2026-04-30historical
-
2026-02-09status Active
-
2025-09-01historical
-
2025-08-13$199,990 Active
-
2025-07-16soldstatus
-
2025-06-24status Pending
-
2025-06-13status Pending
-
2025-06-09historical
-
2025-05-31price $213,000
-
2025-04-30$215,000 Active
-
2025-01-31historical
-
2025-01-24$220,000 Active
ⓘ Source: listings_history table (triggers on properties + properties_extension) + one-shot
backfill from property_details.listing_events for pre-trigger history.
Tax reassessment forecast TX · Resets to sale price
- Current annual tax
- $745 · $62/mo
- Projected year-2 tax
- $3,568 · $297/mo
- Expected delta
- +$2,824/yr (+$235/mo · 379.0%)
ⓘ Screening estimate from a state-policy table — verify with the county assessor before closing.
Climate risk First Street
- Flood 1/10 Low FEMA zone X (unshaded) · 0% chance over 30 yrs
- Wildfire 6/10 Major
- Heat 8/10 Severe 7 d/yr ≥110°F today · 24 d/yr by 30 yrs out
- Wind 8/10 Severe 99% chance of damaging wind over 30 yrs
- Air quality 2/10 Low 2 unhealthy d/yr today · 2 by 30 yrs out
Nearby sold comps map
Loading sold comps map…
Walkable amenities ~0.75 mi
Loading nearby amenities…
Taxation est. · year 1
- Rental income
- $23,270
- − Mortgage interest
- −$10,923
- − Property taxes
- −$745
- − Insurance
- −$975
- − Repairs & maintenance
- −$1,862
- − Management
- −$1,862
- − Depreciation
- −$5,673
- Taxable income
- $1,231
- Est. tax owed @ 24.0%
- −$295
- After-tax cash flow
- $4,096/yr
For passive investors: Depreciation is non-cash, so a rental often shows a tax loss while cash-flowing — sheltering income. Rental losses are passive: they offset passive income freely, and up to $25,000/yr can offset ordinary (W-2) income if you actively participate and your MAGI is under $100k (phasing out to $0 by $150k); unused losses carry forward. On sale, claimed depreciation is recaptured at up to 25%, and gains may owe capital-gains tax (a 1031 exchange can defer both). Figures are a year-1 estimate at your 24.0% rate — not tax advice; consult a CPA.
Schools (NCES district)
- District
- Conroe ISD
- NCES district ID
- 4815000
- Math proficiency
- 57% ▼ -6.00%
- Reading proficiency
- 57% ▼ -1.00%
- Median HH income
- $71,541
- Composite
- 50.65/100
- National rank
- #1833
- State rank
- #69 of 826 in TX
Livability — Deerwood
No livability data for this city. (Only ~50 U.S. cities are tracked.)
Census & demographics
- County
- San Jacinto County · 17,208 people
- Metro
- Houston-The Woodlands-Sugar Land, TX
- Population (ZIP)
- 17,208
- Household income
- $62,428
- Rent vs Own
- Severe rent burden
- 58.0
Population outlook (Montgomery County) Hauer SSP2
- Today (2025)
- 713,896 people
- By 2030
- 805,263 · +12.8%
- By 2040
- 992,708 · +39.1%
- By 2050
- 1,179,590 · +65.2%
- By 2075
- 1,628,084 · +128.1%
- By 2100
- 1,937,880 · +171.5%
Race, ethnicity, and origin ACS 2023
- Neighborhood character
- Majority White (61%)
- Race & ethnicity
- White 61% Hispanic / Latino 33% Two or more races 14% Black 2%
- Hispanic origin (detail)
- Mexican 27% Cuban 1%
- Common ancestry
- Lithuanian 4% Italian 3% Serbian 3%
- Foreign-born
- 18% · Canada, China
- Languages at home
- 67% English-only · Spanish 31% Chinese 1%
Political lean MEDSL · Montgomery
- 2024 margin
- Solid R (+45.5) · D 26.8% · R 72.3%
- 2008→2024 swing
- +7.2pp toward D · 2008: -52.7pp · 2024: -45.5pp
- All cycles
- 2024: R+45.5 2020: R+43.8 2016: R+51.4 2012: R+60.7 2008: R+52.7
Not yet ingested
- Civics
- —
Market trends
- HPI YoY
- ▼ -22.82%
- Current HPI
- 273.6604
- Rent YoY
- —
- Metro
- Houston-The Woodlands-Sugar Land, TX
- State GDP YoY
- ▲ 3.95%
- F500 in state
- 110
Industry mix (Fortune 500 HQ in TX)
| Industry | F500 HQs | Revenue |
|---|---|---|
| Energy | 16 | $1,198B |
|
||
| Technology | 5 | $198B |
|
||
| Engineering / Construction | 4 | $72B |
|
||
| Energy Services | 3 | $60B |
|
||
| Utilities | 3 | $41B |
|
||
| Healthcare | 2 | $330B |
|
||
Price history
-11.4% since first listed13 events — show timeline
- 2026-05-22 Listed $195,000 HARMLS
- 2026-04-30 Listing Removed — HARMLS
- 2026-02-09 Relisted — HARMLS
- 2025-09-01 Listing Removed — HARMLS
- 2025-08-13 Listed $199,990 HARMLS
- 2025-07-16 Sold (Public Records) — Public Records
- 2025-06-24 Pending — HARMLS
- 2025-06-13 Pending — HARMLS
- 2025-06-09 Listing Removed — HARMLS
- 2025-05-31 Price Changed $213,000 HARMLS
- 2025-04-30 Listed $215,000 HARMLS
- 2025-01-31 Listing Removed — HARMLS
- 2025-01-24 Listed $220,000 HARMLS
Property tax history
+7.5%/yrLatest (2025): $745 · +9.6% YoY. Source: county tax records.
Cash-flow waterfall
monthlySold comps — $/sqft
last 12 mo · ≤1 miLoading sold comps…