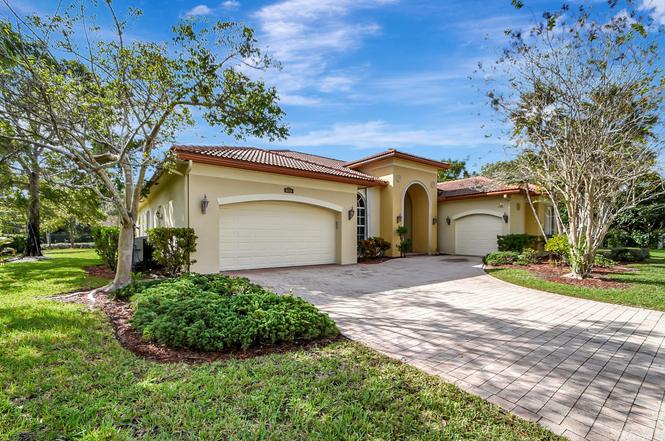
8123 Woodslanding Trl · Wellington, FL
Flood risk 1/10 · Minimal
- FEMA flood zone
- X (unshaded)
- Chance of flooding over 30 yrs
- 0.0%
- Est. flood insurance / yr
- $507 – $1,088
Fire risk 1/10 · Minimal
- Est. fire insurance / yr
- $947 – $1,759
Heat risk 9/10 · Severe
- Hot days now (above 106°F)
- 5 days/yr
- Hot days in 30 yrs
- 17 days/yr
Wind risk 10/10 · Severe
- Chance of severe wind over 30 yrs
- 99.0%
Air-quality risk 2/10 · Minimal
- Unhealthy air days now
- 0 days/yr
- Unhealthy air days in 30 yrs
- 1 days/yr
Risk factors via First Street. Map © Google.
Why this score? — see what drove the D- grade
The composite is a weighted blend of 9 inputs, each scored 0–100. Each bar is that input's sub-score; the figure is the points it added to the 100-point composite (weight × sub-score).
- Appreciation +10.0/10.0
- ARV discount +7.5/15.0
- Cash flow +6.6/30.0
- Schools +4.3/10.0
- Livability +3.7/5.0
- Rent growth +2.7/5.0
- Condition / age +2.5/5.0
- 1% rule +1.3/10.0
- DSCR +0.8/10.0
$899,000
🖨 Deal sheet 📄 Offer letter ✓ Due diligence
Listing remarks
Welcome to this stunning one-story estate home! Situated on a nearly 1/2-acre corner lot, this beautifully maintained and well-appointed residence features 4 bedrooms and 3.5 bathrooms. Step through the elegant double doors into a grand foyer that opens to the formal living and dining rooms. The spacious gourmet kitchen boasts granite countertops, stainless steel appliances, a large pantry, and a breakfast nook—perfect for entertaining while guests relax in the oversized family room. The split-bedroom layout offers privacy and convenience. The expansive master suite includes a luxurious ensuite and direct access to the patio. Three additional bedrooms share a Jack-and-Jill-bathroom, p
Key facts
- Grand foyer
- Gourmet kitchen
- Large pantry
Tags
Neighborhood map
What this means for you Summary
Snapshot
- This is a 4-bed/3.5-bath single-family listed at $899k.
Deal economics
- At list price, monthly cash flow is $-1k ($-18k/yr) — negative.
- To cash-flow at today's rent, offer at most $637k (29.2% below list).
- To meet the 1% rule (rent ≥ 1% of price), the offer needs to be $568k (36.9% below list).
- Recommended offer: $568k (36.9% below list) — sets the bar for 1% rule.
- Cap rate 4.3% vs local median 3.4% in Wellington — meaningfully above typical; check what's discounted (condition, days-on-market, listing class) to confirm the premium yield is real.
Location & tenants
- Location reads 73/100 on livability (#294 in FL, #4,986 nationally) — a middle-class / working-renter tenant base. Strengths: crime A+, employment A+, housing A+; Watch: amenities F, commute F, cost of living F.
- Palm Beach (suburban): math 46% / reading 53% proficiency, ranked #34 of 73 in FL (top 47%) — families likely to look elsewhere, expect single-tenant / working-renter base with shorter leases.
- Zoned schools: Everglades Elementary (math 70% / reading 74%, grade A-, #288 of 2,144 statewide, top 15%, 888 students, 34% FRL); Emerald Cove Middle School (math 61% / reading 64%, grade B+, #116 of 571 statewide, top 21%, 1,241 students, 36% FRL); Palm Beach Central High School (math 42% / reading 55%, grade D, #198 of 667 statewide, top 30%, 2,980 students, 40% FRL) — zoned schools average 36% FRL vs 52% district-wide (16 pts lower); this property's tenant base skews higher-income than the district average.
- Market conditions: Rents flat; 574 active listings in the ZIP; 8 comparable units currently listed for rent nearby; rentals at typical pace (median 25d on market — plan ~3-4 weeks tenant-placement turnaround); solid renter incomes; 3,974 units permitted in Palm Beach County in 2024 (1,012 in 5+ unit buildings).
- At $5,676/mo this rent would consume 74% of the median local household income ($93k/yr) (locally 1870% of renters already pay >50% of income on rent) — very limited rent-growth headroom before tenants either downsize or default.
Forward outlook
- In year one you build about $96k of equity ($6k loan paydown + $90k appreciation (10.0% local appreciation)).
- Palm Beach County population projected at +30% by 2050 — long-run rental-demand tailwind backs the buy-and-hold thesis.
- By year 2, paydown + projected appreciation supports a ~$155k cash-out refi (75% LTV) — recoverable capital for the next deal without selling this one.
Negotiation context
- It's been on market 192 days — a 12% lower offer ($791k) is reasonable based on typical stale-listing flexibility.
- 6 sale attempts since 9y ago with the ask held roughly flat each time — persistent listings suggest the price (not the market) is what's stuck; bring a comps-based counter.
Risks & watch-outs
- Climate carrying-cost: severe wind risk, 99% chance of damaging wind over 30y; extreme-heat days projected 5→17/yr by 2055 (HVAC capex compounding) — expect insurance premiums to compound above CPI over the hold.
Questions for the listing agent
- What do current leases actually rent for vs. the listed asking? Can we see a recent rent roll and the last 12 months of T-12 income?
- It's been on market 192 days. Have you received any prior offers? Is the seller open to a 37% concession, seller financing, or rate buy-down credit?
- What does the HOA fee cover, when was the last increase, and are there any pending special assessments or reserve-fund shortfalls?
- Why hasn't it sold? Are there any deal-killer items the seller is aware of (foundation, flood, title, zoning, code violations)?
- Is there a deadline driving the sale (1031 exchange, divorce, estate, relocation)? That informs how much negotiation room exists.
- Schools are A-rated — typically a magnet for longer-tenancy family renters. What's the average tenant stay here, and is there a school-zone premium baked into asking?
- The area grade is low — what's the realistic commute time and amenity access for the typical tenant pool here? Any planned neighborhood developments (good or bad) we should know about?
- What's the average days-on-market for RENTAL listings here right now (not sales)? A rising rental-DOM trend means longer vacancies and softer asking-rent achievability than the comps imply.
- What's the recent tenant-quality profile in this submarket — average credit score on applications, eviction rate, late-payment / NSF rate, and stable-employment percentage? A property-management company in the area should have these aggregated.
- How much new for-sale + rental construction is in the pipeline within 1–3 miles? Heavy new supply typically softens prices + rents 12–24 months out; constrained supply supports both.
Investment metrics
- 1% rule
- 0.63% ✗
- Cap rate
- 4.31%
- Cash-on-cash
- -7.08%
- DSCR
- 0.68
- GRM
- 13.2
CMA / ARV
No comps found within radius.
Projected returns pro-forma
10.0% appreciation · 0.85% rent growth · sell at horizon
- IRR
- 18.8%
- Equity multiple
- 2.52×
- Total profit
- $382,908
- Equity at exit
- $809,890
- IRR
- 17.0%
- Equity multiple
- 5.69×
- Total profit
- $1,179,573
- Equity at exit
- $1,746,559
Cash invested: $251,720 (down + closing). Projections, not guarantees.
Landlord ↔ Tenant lean methodology
- Overall (STATE)
- 87 Strongly Landlord-Friendly
- State Florida
- 87 Strongly Landlord-Friendly · R+3
- County
- — inherits STATE
- City
- — inherits STATE
ZIP-level market 33411
- Home prices YoY
- 1.9%
- Rents YoY
- 0.8%
- Active inventory
- 574
- Price-to-rent
- 13.2×
Monthly cashflow live
- Estimated rent
- $5,676 high interval (Pro) →
- Mortgage (P&I)
- −$4,714
- Tax from tax record
- −$496 /mo · $5,952/yr
- Insurance
- −$375
- HOA
- −$385
- Vacancy / Maint / Mgmt
- −$1,192
- Net cashflow
- $-1,486
Break-even live
UW: 25.0% down · 7.5% · 30yr · 1.5% tax · 5.0% vac · 8.0% maint · 8.0% mgmt
Financing live
Cash to close
- Down payment
- $224,750
- Closing costs
- $26,970
- Reserves months
- —
- Total cash needed
- —
Loan-product check · same deal, 3 products live
Conventional
25% down · 7.5% · 30yr
- Down + closing
- —
- Monthly P&I
- —
- Monthly cashflow
- —
- DSCR
- —
- Eligible?
- —
Personal DTI + credit; lowest rate.
DSCR
20% down · 8.5% · 30yr
- Down + closing
- —
- Monthly P&I
- —
- Monthly cashflow
- —
- DSCR
- —
- Eligible?
- —
No personal income docs; deal must DSCR.
Hard money
10% down · 12.0% · 12mo
- Down + closing
- —
- Monthly P&I
- —
- Monthly cashflow
- —
- DSCR
- —
- Eligible?
- —
Short-term bridge; refi at stabilization.
Rent comps 8 comps
| Address | Beds | Baths | Sqft | Rent | $/sqft | DOM | Units | Dist |
|---|---|---|---|---|---|---|---|---|
| 851 Edgebrook Ln West Palm Beach, FL | 4.0 | 3.0 | 3038 | $7,200 | $2.37 | 8d | 1 | 0.54mi |
| 8152 Butler Greenwood Dr Royal Palm Beach, FL | 3.0 | 3.0 | 2323 | $10,000 | $4.30 | 24d | 1 | 0.70mi |
| 544 Edgebrook Ln West Palm Beach, FL | 4.0 | 4.5 | 3717 | $5,900 | $1.59 | 24d | 1 | 0.73mi |
| 8801 Wellington View Dr West Palm Beach, FL | 5.0 | 4.5 | 4001 | $7,500 | $1.87 | 12d | 1 | 0.76mi |
| 9345 Madewood Ct Royal Palm Beach, FL | 5.0 | 3.5 | 3929 | $4,000 | $1.02 | 24d | 1 | 1.19mi |
| 2057 Futana Way Wellington, FL | 5.0 | 4.0 | 2700 | $9,000 | $3.33 | 15d | 1 | 1.24mi |
| 9326 Plantation Estates Dr Royal Palm Beach, FL | 5.0 | 3.0 | 3161 | $4,300 | $1.36 | 24d | 1 | 1.26mi |
| 9433 Madewood Ct Royal Palm Beach, FL | 4.0 | 2.0 | 2616 | $5,350 | $2.05 | 24d | 1 | 1.32mi |
HOA detail
- Monthly dues
- $385 · $4,620/yr
Listing history 18 events
-
2026-03-14status Pending
-
2026-02-23historical Active Under Contract
-
2026-02-03status Active
-
2026-02-03historical
-
2026-01-21price $899,000
-
2025-09-03$940,000 Active
-
2025-08-01historical
-
2025-02-27price $950,000
-
2025-01-29price $975,000
-
2025-01-10price $1,000,000
-
2024-11-18$1,100,000 Active
-
2024-05-24historical
-
2024-05-23historical
-
2023-12-04$1,300,000 Active
-
2023-11-24$1,300,000 Active
-
2023-11-24historical
-
2017-06-17historical
-
2017-01-05$780,000 Active
ⓘ Source: listings_history table (triggers on properties + properties_extension) + one-shot
backfill from property_details.listing_events for pre-trigger history.
Tax reassessment forecast FL · Resets to sale price
- Current annual tax
- $5,952 · $496/mo
- Projected year-2 tax
- $7,462 · $622/mo
- Expected delta
- +$1,509/yr (+$126/mo · 25.4%)
ⓘ Screening estimate from a state-policy table — verify with the county assessor before closing.
Climate risk First Street
- Flood 1/10 Low FEMA zone X (unshaded) · 0% chance over 30 yrs
- Wildfire 1/10 Low
- Heat 9/10 Extreme 5 d/yr ≥106°F today · 17 d/yr by 30 yrs out
- Wind 10/10 Extreme 99% chance of damaging wind over 30 yrs
- Air quality 2/10 Low 0 unhealthy d/yr today · 1 by 30 yrs out
Nearby sold comps map
Loading sold comps map…
Walkable amenities ~0.75 mi
Loading nearby amenities…
Taxation est. · year 1
- Rental income
- $68,117
- − Mortgage interest
- −$50,358
- − Property taxes
- −$5,952
- − Insurance
- −$4,495
- − Repairs & maintenance
- −$5,449
- − Management
- −$5,449
- − HOA
- −$4,620
- − Depreciation
- −$26,153
- Taxable loss
- −$34,360
- Est. tax savings @ 24.0%
- +$8,246
- After-tax cash flow
- $-9,582/yr
For passive investors: Depreciation is non-cash, so a rental often shows a tax loss while cash-flowing — sheltering income. Rental losses are passive: they offset passive income freely, and up to $25,000/yr can offset ordinary (W-2) income if you actively participate and your MAGI is under $100k (phasing out to $0 by $150k); unused losses carry forward. On sale, claimed depreciation is recaptured at up to 25%, and gains may owe capital-gains tax (a 1031 exchange can defer both). Figures are a year-1 estimate at your 24.0% rate — not tax advice; consult a CPA.
Schools (NCES district)
- District
- Palm Beach
- NCES district ID
- 1201500
- Math proficiency
- 46% ▼ -16.00%
- Reading proficiency
- 53% ▼ -4.00%
- Median HH income
- $53,943
- Composite
- 42.72/100
- National rank
- #3160
- State rank
- #34 of 73 in FL
Livability — Wellington
- Score
- 73/100
- State rank
- #294
- US rank
- #4986
Category grades
Schools grade is shown separately in the Schools card above.
Census & demographics
- County
- Palm Beach County · 1,438,312 people
- City population
- 60,184
- Metro
- Miami-Fort Lauderdale-Pompano Beach, FL
- Population (ZIP)
- 76,863
- Household income
- $92,591
- Rent vs Own
- Severe rent burden
- 1870.0
Population outlook (Palm Beach County) Hauer SSP2
- Today (2025)
- 1,637,487 people
- By 2030
- 1,743,255 · +6.5%
- By 2040
- 1,948,712 · +19.0%
- By 2050
- 2,132,979 · +30.3%
- By 2075
- 2,530,027 · +54.5%
- By 2100
- 2,706,979 · +65.3%
Race, ethnicity, and origin ACS 2023
- Neighborhood character
- Diverse neighborhood (Simpson 0.70)
- Race & ethnicity
- White 44% Hispanic / Latino 24% Black 23% Two or more races 16% Asian 5%
- Hispanic origin (detail)
- Mexican 2% Puerto Rican 5% Cuban 4% Dominican 2%
- Common ancestry
- Hispanic 6% Romanian 2% Italian 1%
- Foreign-born
- 26% · Canada, Jamaica, China
- Languages at home
- 73% English-only · Spanish 17% French/Haitian/Cajun 4% Other Indo-European 2%
Political lean MEDSL · Palm Beach
- 2024 margin
- Toss-up / Even · D 50.0% · R 49.2%
- 2008→2024 swing
- -22.1pp toward R · 2008: 22.9pp · 2024: 0.8pp
- All cycles
- 2024: D+0.8 2020: D+12.8 2016: D+15.3 2012: D+17.0 2008: D+22.9
Not yet ingested
- Civics
- —
Market trends
- HPI YoY
- ▲ 17.04%
- Current HPI
- 903.78
- Rent YoY
- ▲ 0.85%
- Metro
- Miami-Fort Lauderdale-Pompano Beach, FL
- State GDP YoY
- ▲ 3.28%
- F500 in state
- 36
Industry mix (Fortune 500 HQ in FL)
| Industry | F500 HQs | Revenue |
|---|---|---|
| Industrial Technology | 2 | $29B |
|
||
| Insurance | 2 | $17B |
|
||
| Retail | 1 | $60B |
|
||
| Technology Distribution | 1 | $58B |
|
||
| Homebuilding | 1 | $35B |
|
||
| Technology Manufacturing | 1 | $35B |
|
||
Price history
+15.3% since first listed18 events — show timeline
- 2026-03-14 Pending — Beaches MLS
- 2026-02-23 Contingent — Beaches MLS
- 2026-02-03 Relisted — Beaches MLS
- 2026-02-03 Listing Removed — Beaches MLS
- 2026-01-21 Price Changed $899,000 Beaches MLS
- 2025-09-03 Listed $940,000 Beaches MLS
- 2025-08-01 Listing Removed — Beaches MLS
- 2025-02-27 Price Changed $950,000 Beaches MLS
- 2025-01-29 Price Changed $975,000 Beaches MLS
- 2025-01-10 Price Changed $1,000,000 Beaches MLS
- 2024-11-18 Listed $1,100,000 Beaches MLS
- 2024-05-24 Listing Removed — Beaches MLS
- 2024-05-23 Listing Removed — Stellar MLS as Distributed by MLS Grid
- 2023-12-04 Listed $1,300,000 Stellar MLS as Distributed by MLS Grid
- 2023-11-24 Listed $1,300,000 Beaches MLS
- 2023-11-24 Coming Soon — Beaches MLS
- 2017-06-17 Listing Removed — Beaches MLS
- 2017-01-05 Listed $780,000 Beaches MLS
Property tax history
+1.0%/yrLatest (2025): $5,952 · +3.0% YoY. Source: county tax records.
Cash-flow waterfall
monthlySold comps — $/sqft
last 12 mo · ≤1 miLoading sold comps…