1815 Lakemont Dr · Arlington, TX
Flood risk 1/10 · Minimal
- FEMA flood zone
- X (unshaded)
- Chance of flooding over 30 yrs
- 0.0%
- Est. flood insurance / yr
- $507 – $1,088
Fire risk 1/10 · Minimal
- Est. fire insurance / yr
- $1,222 – $2,270
Heat risk 8/10 · Major
- Hot days now (above 109°F)
- 7 days/yr
- Hot days in 30 yrs
- 24 days/yr
Wind risk 6/10 · Moderate
- Chance of severe wind over 30 yrs
- 27.0%
Air-quality risk 3/10 · Minor
- Unhealthy air days now
- 2 days/yr
- Unhealthy air days in 30 yrs
- 4 days/yr
Risk factors via First Street. Map © Google.
Why this score? — see what drove the C- grade
The composite is a weighted blend of 9 inputs, each scored 0–100. Each bar is that input's sub-score; the figure is the points it added to the 100-point composite (weight × sub-score).
- ARV discount +15.0/15.0
- Cash flow +14.2/30.0
- 1% rule +5.1/10.0
- DSCR +4.3/10.0
- Livability +3.9/5.0
- Rent growth +2.5/5.0
- Schools +2.5/10.0
- Condition / age +2.5/5.0
- Appreciation +0.0/10.0
$215,000
🖨 Deal sheet (PDF) 📄 Offer letter ✓ Due diligence
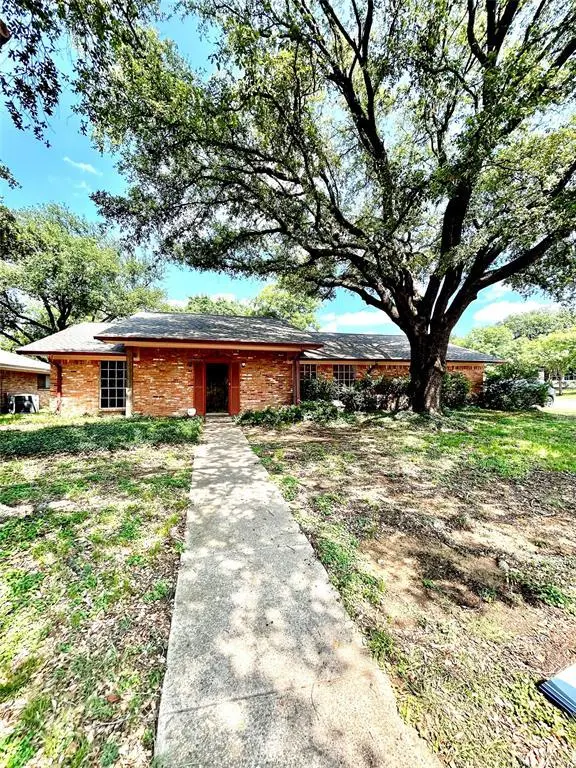
Listing remarks
Multiple Offers Received. .. Deadline for offers is Thursday, June 11th at Noon. Unique opportunity to restore this 4 bedroom, 2 and half bath home found in Lakewood Addition, one of the most desirable subdivisions in Central Arlington. If you've wondered what it's like to be a part of the '013' community. .. here's your chance! Walking distance to highly rated Hill Elementary and Bailey Jr. High schools and just minutes from some of the best boutique shops and restaurants Central Arlington has to offer. You're a short drive to the Entertainment District, Downtown Arlington, The Highlands, Parks Mall and multiple hospitals and medical districts. If you commute to Dallas or Fort Worth, you h
Key facts
- 16 x 12 shed
- Large grassy area
- 0.23 acre lot
Tags
Property features AI
Finance
- Other: Property listed for sale; transaction terms include cash and conventional financing
- HOA & community: No association
Exterior
- Parking: Attached garage with two covered spaces; Garage with 2-car double doors, garage faces side, kitchen-level access; Garage approximately 20' x 20'; No carport spaces
- Utilities: City water with individual water meter; City sewer; Electricity connected; Cable available
- Home design: Single-family residence; One story; Entry and main living on one level
- Construction: Brick construction; Composition shingle roof; Slab foundation; Built in 1970 (preowned)
- Exterior features: Corner lot with landscaping and large backyard grass; Some oak trees and few trees on lot; Back yard wood fencing (fenced); Silo on property; Subdivision location; Jogging/bike path in community; All-weather road and curbs
Interior
- Kitchen: Electric oven; Gas cooktop; Double oven; Eat-in kitchen; Solid surface counters (non-natural)
- Bedrooms: Four bedrooms (all on the main level); Primary bedroom with built-in desk and walk-in closet; One bedroom with built-in desk; Split bedroom plan
- Flooring: Ceramic tile; Concrete; Laminate
- Bathrooms: Two full bathrooms; One half bathroom; Primary ensuite with separate shower and natural stone/granite counters; Bathroom with dual sinks and natural stone/granite counters
- Heating & cooling: Central heating (electric); Central air (electric); Tankless water heater
- Interior features: Vaulted ceilings; Decorative lighting and chandelier; Cable TV available; High-speed internet available; Eat-in kitchen; Walk-in closets; Two living areas; Two dining areas; Bonus room
- Laundry & utility: Full-size washer/dryer area; Washer hookup; Electric dryer hookup; Utility room with built-in cabinets (on main level)
Neighborhood map
What this means for you Summary
Snapshot
- This is a 3-bed/2.0-bath single-family listed at $215k.
Deal economics
- At list price, monthly cash flow is $35 ($423/yr) — positive.
- The deal already cash-flows at list — no discount required.
- Meets the 1% rule at list price ($2k rent vs $215k).
- Cap rate 6.5% vs local median 3.6% in Arlington — top-decile yield for the area; either an underpriced asset or a hidden risk that comps aren't pricing in. Stress-test before assuming the spread holds.
Location & tenants
- Location reads 78/100 on livability (#75 in TX, #2,697 nationally) — a middle-class / working-renter tenant base. Strengths: amenities A+, cost of living A+, housing A+; Watch: crime F, commute F.
- Arlington ISD (urban): math 24% / reading 34% proficiency, ranked #629 of 826 in TX (top 76%) — low school quality limits family demand, transient renter base, plan for 1-2y turnover.
- Zoned schools: Hill El (math 37% / reading 40%, grade F, #1,680 of 4,322 statewide, top 40%, 531 students, 49% FRL); Bailey J H (math 26% / reading 40%, grade F, #930 of 1,662 statewide, top 57%, 762 students, 66% FRL); Arlington H S (math 24% / reading 48%, grade F, #930 of 1,632 statewide, top 57%, 2,538 students, 67% FRL) — zoned schools at 61% FRL track the district average.
- Market conditions: Rents soft (-0.1%/yr); 148 active listings in the ZIP; 32 comparable units currently listed for rent nearby; rentals at typical pace (median 27d on market — plan ~3-4 weeks tenant-placement turnaround); 47% of comp listings sitting > 30 days — soft ceiling on asking rent; 18,938 units permitted in Tarrant County in 2024 (8,336 in 5+ unit buildings).
- This rent runs 37% of the median local income ($70k/yr) — at the standard rent-burdened threshold; future hikes will face affordability resistance.
Forward outlook
- Local home prices are declining (-3.0%/yr); year-one equity from $1k of loan paydown is wiped out by about $6k of value loss. Plan a longer hold.
- Tarrant County population projected at +41% by 2050 — long-run rental-demand tailwind backs the buy-and-hold thesis.
Negotiation context
- Only 7 days on market — expect competitive offers; lowballing is unlikely to land.
Risks & watch-outs
- Watch-outs: property tax is 2.6% of price.
- Climate carrying-cost: major wind risk, 27% chance of damaging wind over 30y; extreme-heat days projected 7→24/yr by 2055 (HVAC capex compounding) — expect insurance premiums to compound above CPI over the hold.
Questions for the listing agent
- Built in 1970 — when were the roof, HVAC, electrical panel, plumbing, and water heater last replaced?
- Property tax is high relative to price — has the assessment been appealed recently, and will the sale trigger a re-assessment?
- Is there a deadline driving the sale (1031 exchange, divorce, estate, relocation)? That informs how much negotiation room exists.
- Schools are D-rated, which usually means shorter tenancies and higher turnover. Who's the typical renter profile here, and what's been the actual vacancy rate?
- Crime grade is F in this area — have there been break-ins, vandalism, or insurance claims at this property in the last 3 years? What carrier currently insures it and at what premium?
- What's the average days-on-market for RENTAL listings here right now (not sales)? A rising rental-DOM trend means longer vacancies and softer asking-rent achievability than the comps imply.
- What's the recent tenant-quality profile in this submarket — average credit score on applications, eviction rate, late-payment / NSF rate, and stable-employment percentage? A property-management company in the area should have these aggregated.
- How much new for-sale + rental construction is in the pipeline within 1–3 miles? Heavy new supply typically softens prices + rents 12–24 months out; constrained supply supports both.
Investment metrics
- 1% rule
- 1.01% ✓
- Cap rate
- 6.49%
- Cash-on-cash
- 0.70%
- DSCR
- 1.03
- GRM
- 8.2
CMA / ARV
- ARV (on-the-fly)
- $347,038
- Comps found
- 12
Show comp detail 12 sales within ~0.75 mi
| Address | Dist | Beds/Ba | Sqft | Sold | Price | $/sf | Match |
|---|---|---|---|---|---|---|---|
| 2100 Friar Tuck Dr | 0.09mi | 4/2.5 (+1) | 2,047 (+2%) | 5mo | $340,000 | $166 | 81 |
| 1875 Larkspur Dr | 0.11mi | 4/2.0 (+1) | 1,954 (-3%) | 5mo | $287,500 | $147 | 81 |
| 1860 Larkspur Dr | 0.12mi | 3/2.0 | 2,153 (+7%) | 1mo | $320,000 | $149 | 81 |
| 1910 New Castle Ct | 0.45mi | 3/2.0 | 1,999 (-0%) | 0mo | $355,000 | $178 | 78 |
| 2105 Briarwood Blvd | 0.38mi | 4/2.0 (+1) | 1,990 (-1%) | 5mo | $275,000 | $138 | 72 |
| 1714 Cheryl Ln | 0.40mi | 3/2.0 | 1,917 (-4%) | 6mo | $275,000 | $143 | 69 |
| 1909 Ford St | 0.17mi | 3/2.0 | 1,705 (-15%) | 5mo | $335,000 | $196 | 63 |
| 1916 Weymouth Ct | 0.28mi | 4/3.0 (+1) | 2,148 (+7%) | 4mo | $359,500 | $167 | 62 |
| 1519 W Lavender Ln | 0.57mi | 3/2.0 | 1,864 (-7%) | 2mo | $375,000 | $201 | 60 |
| 1405 Briarwood Blvd | 0.56mi | 3/2.0 | 1,772 (-12%) | 2mo | $325,000 | $183 | 52 |
| 1713 Venetian Cir | 0.34mi | 4/2.5 (+1) | 2,304 (+15%) | 3mo | $399,000 | $173 | 50 |
| 1104 Waggoner Dr | 0.70mi | 4/2.0 (+1) | 1,710 (-15%) | 1mo | $319,000 | $187 | 37 |
Match score weights: distance 35% · size 25% · config 20% · recency 20%. Top-matched comps best support the ARV.
Projected returns pro-forma
-3.0% appreciation · 0.0% rent growth · sell at horizon
- IRR
- -19.0%
- Equity multiple
- 0.36×
- Total profit
- $-38,828
- Equity at exit
- $32,057
- IRR
- -20.6%
- Equity multiple
- 0.09×
- Total profit
- $-54,981
- Equity at exit
- $18,589
Cash invested: $60,200 (down + closing). Projections, not guarantees.
Landlord ↔ Tenant lean methodology
- Overall (STATE)
- 87 Strongly Landlord-Friendly
- State Texas
- 87 Strongly Landlord-Friendly · R+5
- County
- — inherits STATE
- City
- — inherits STATE
ZIP-level market 76013
- Rents YoY
- -0.1%
- Active inventory
- 148
- Price-to-rent
- 8.2×
Monthly cashflow live
- Estimated rent
- $2,181 high interval (Pro) →
- Mortgage (P&I)
- −$1,127
- Tax from tax record
- −$471 /mo · $5,647/yr
- Insurance
- −$90
- HOA
- −$0
- Vacancy / Maint / Mgmt
- −$458
- Net cashflow
- $35
Break-even live
Sensitivity live
| Price | -10% $157 | -5% $96 | +0% $35 | +5% $-26 | +10% $-86 |
|---|---|---|---|---|---|
| Rent | -10% $-137 | -5% $-51 | +0% $35 | +5% $121 | +10% $208 |
| Rate | -1.0pp $144 | -0.5pp $90 | base $35 | +0.5pp $-20 | +1.0pp $-77 |
UW: 25.0% down · 7.5% · 30yr · 1.5% tax · 5.0% vac · 8.0% maint · 8.0% mgmt
Financing live
Cash to close
- Down payment
- $53,750
- Closing costs
- $6,450
- Reserves months
- —
- Total cash needed
- —
Loan-product check · same deal, 3 products live
Conventional
25% down · 7.5% · 30yr
- Down + closing
- —
- Monthly P&I
- —
- Monthly cashflow
- —
- DSCR
- —
- Eligible?
- —
Personal DTI + credit; lowest rate.
DSCR
20% down · 8.5% · 30yr
- Down + closing
- —
- Monthly P&I
- —
- Monthly cashflow
- —
- DSCR
- —
- Eligible?
- —
No personal income docs; deal must DSCR.
Hard money
10% down · 12.0% · 12mo
- Down + closing
- —
- Monthly P&I
- —
- Monthly cashflow
- —
- DSCR
- —
- Eligible?
- —
Short-term bridge; refi at stabilization.
Rent comps 32 comps
| Address | Beds | Baths | Sqft | Rent | $/sqft | DOM | Units | Dist |
|---|---|---|---|---|---|---|---|---|
| 1718 Cheryl Ln Arlington, TX | 4.0 | 3.0 | 2650 | $3,350 | $1.26 | 45d | 1 | 0.39mi |
| 1606 Bluebonnet Trl Arlington, TX | 3.0 | 2.0 | 1533 | $2,150 | $1.40 | 24d | 1 | 0.48mi |
| 1606 Bluebonnet Trl Arlington, TX | 3.0 | 2.0 | 1574 | $2,250 | $1.43 | 45d | 1 | 0.48mi |
| 1704 S Bowen Rd Pantego, TX | 3.0 | 2.5 | 2233 | $2,900 | $1.30 | 6d | 1 | 0.53mi |
| 1707 Oakridge Dr Pantego, TX | 4.0 | 3.0 | 2312 | $2,475 | $1.07 | 45d | 1 | 0.61mi |
| 2307 Monte Carlo Dr Arlington, TX | 2.0 | 1.0 | 2310 | $1,650 | $0.71 | 7d | 1 | 0.62mi |
| 1413 W Tucker Blvd Arlington, TX | 4.0 | 2.0 | 1679 | $2,070 | $1.23 | 45d | 1 | 0.75mi |
| 2715 Westgate Dr Arlington, TX | 3.0 | 2.0 | 1696 | $2,099 | $1.24 | 26d | 1 | 0.87mi |
| 907 S Bowen Rd Arlington, TX | 3.0 | 2.0 | 1404 | $2,050 | $1.46 | 45d | 1 | 0.91mi |
| 2414 S Graham Dr Arlington, TX | 3.0 | 2.5 | 1906 | $2,150 | $1.13 | 9d | 1 | 1.00mi |
| 2319 St Gregory St Arlington, TX | 3.0 | 2.5 | 1470 | $1,740 | $1.18 | 0d | 1 | 1.09mi |
| 1905 Fox Hill Ct Arlington, TX | 4.0 | 2.0 | 1799 | $2,295 | $1.28 | 19d | 1 | 1.12mi |
| 1905 Fox Hill Ct Arlington, TX | 4.0 | 2.0 | 1799 | $2,295 | $1.28 | 9d | 1 | 1.12mi |
| 2802 S Fielder Rd Unit A Arlington, TX | 3.0 | 2.5 | 1650 | $1,850 | $1.12 | 26d | 1 | 1.15mi |
| 2205 Chase Ct Arlington, TX | 3.0 | 3.0 | 1530 | $1,700 | $1.11 | 45d | 1 | 1.15mi |
| 1509 University Dr Arlington, TX | 4.0 | 2.0 | 2155 | $2,700 | $1.25 | 45d | 1 | 1.18mi |
| 2233 Chase Ct Unit 2233 Dalworthington Gardens, TX | 3.0 | 2.5 | 1500 | $1,800 | $1.20 | 6d | 1 | 1.18mi |
| 2818 S Fielder Rd Arlington, TX | 3.0 | 2.5 | 1497 | $1,695 | $1.13 | 45d | 1 | 1.20mi |
| 514 Norwood Cir W Arlington, TX | 3.0 | 2.5 | 2604 | $1,850 | $0.71 | 26d | 1 | 1.21mi |
| 2200 Seville Ct Unit 2202 Arlington, TX | 2.0 | 1.5 | 2151 | $1,700 | $0.79 | 26d | 1 | 1.21mi |
| 3002 Friendswood Dr Arlington, TX | 4.0 | 3.0 | 1900 | $2,295 | $1.21 | 26d | 1 | 1.22mi |
| 1605 Arrowhead Dr Pantego, TX | 4.0 | 2.0 | 1969 | $2,125 | $1.08 | 26d | 1 | 1.30mi |
| 2355 Spring Park Blvd Arlington, TX | 4.0 | 3.0 | 2500 | $3,000 | $1.20 | 45d | 1 | 1.32mi |
| 2907 Ashbury Dr Arlington, TX | 3.0 | 2.0 | 1519 | $1,950 | $1.28 | 45d | 1 | 1.32mi |
| 376 Westview Ter Arlington, TX | 3.0 | 2.5 | 1518 | $2,000 | $1.32 | 45d | 1 | 1.33mi |
| 2359 Spring Park Blvd Arlington, TX | 4.0 | 3.0 | 2500 | $3,000 | $1.20 | 45d | 1 | 1.33mi |
| 2360 Spring Park Blvd Arlington, TX | 4.0 | 3.0 | 2500 | $3,000 | $1.20 | 20d | 1 | 1.35mi |
| 426 Westview Ter Arlington, TX | 3.0 | 2.5 | 1872 | $2,100 | $1.12 | 4d | 1 | 1.35mi |
| 424 Westview Ter Arlington, TX | 3.0 | 2.5 | 1728 | $2,150 | $1.24 | 13d | 1 | 1.35mi |
| 915 W Lovers Ln Arlington, TX | 4.0 | 2.0 | 1860 | $2,195 | $1.18 | 45d | 1 | 1.40mi |
| 2806 Buffalo Dr Arlington, TX | 3.0 | 2.0 | 1852 | $2,150 | $1.16 | 45d | 1 | 1.41mi |
| 903 Love Wood Ln Arlington, TX | 3.0 | 2.0 | 1461 | $2,000 | $1.37 | 45d | 1 | 1.43mi |
Listing history 5 events
-
2026-06-13statusdays on market $215,000 Pending 7 DOM
-
2026-06-09days on market $215,000 Active 4 DOM
-
2026-06-08days on market $215,000 Active 3 DOM
-
2026-06-07remarks 699-char remark
-
2026-06-07$215,000 Active 2 DOM
ⓘ Source: listings_history table (triggers on properties + properties_extension) + one-shot
backfill from property_details.listing_events for pre-trigger history.
Tax reassessment forecast TX · Resets to sale price
- Current annual tax
- $5,647 · $471/mo
- Projected year-2 tax
- $5,647 · $471/mo
- Expected delta
- $0/yr ($0/mo · 0.0%)
ⓘ Screening estimate from a state-policy table — verify with the county assessor before closing.
Climate risk First Street
- Flood 1/10 Low FEMA zone X (unshaded) · 0% chance over 30 yrs
- Wildfire 1/10 Low
- Heat 8/10 Severe 7 d/yr ≥109°F today · 24 d/yr by 30 yrs out
- Wind 6/10 Major 27% chance of damaging wind over 30 yrs
- Air quality 3/10 Moderate 2 unhealthy d/yr today · 4 by 30 yrs out
Nearby sold comps map
Loading sold comps map…
Walkable amenities ~0.75 mi
Loading nearby amenities…
Taxation est. · year 1
- Rental income
- $26,171
- − Mortgage interest
- −$12,043
- − Property taxes
- −$5,647
- − Insurance
- −$1,075
- − Repairs & maintenance
- −$2,094
- − Management
- −$2,094
- − Depreciation
- −$6,255
- Taxable loss
- −$3,036
- Est. tax savings @ 24.0%
- +$729
- After-tax cash flow
- $1,152/yr
For passive investors: Depreciation is non-cash, so a rental often shows a tax loss while cash-flowing — sheltering income. Rental losses are passive: they offset passive income freely, and up to $25,000/yr can offset ordinary (W-2) income if you actively participate and your MAGI is under $100k (phasing out to $0 by $150k); unused losses carry forward. On sale, claimed depreciation is recaptured at up to 25%, and gains may owe capital-gains tax (a 1031 exchange can defer both). Figures are a year-1 estimate at your 24.0% rate — not tax advice; consult a CPA.
Schools (NCES district)
- District
- Arlington ISD
- NCES district ID
- 4808700
- Math proficiency
- 24% ▼ -21.00%
- Reading proficiency
- 34% ▼ -8.00%
- Median HH income
- $50,873
- Composite
- 25.42/100
- National rank
- #7458
- State rank
- #629 of 826 in TX
Livability — Arlington
- Score
- 78/100
- State rank
- #75
- US rank
- #2697
Category grades
Schools grade is shown separately in the Schools card above.
Census & demographics
- Census place
- Arlington, TX
- County
- Tarrant County · 2,033,669 people
- City population
- 366,588
- Metro
- Dallas-Fort Worth-Arlington, TX
- Population (ZIP)
- 35,715
- Household income
- $70,471
- Rent vs Own
- Severe rent burden
- 1683.0
Population outlook (Tarrant County) Hauer SSP2
- Today (2025)
- 2,380,417 people
- By 2030
- 2,578,900 · +8.3%
- By 2040
- 2,974,995 · +25.0%
- By 2050
- 3,350,489 · +40.8%
- By 2075
- 4,216,909 · +77.2%
- By 2100
- 4,741,527 · +99.2%
Race, ethnicity, and origin ACS 2023
- Neighborhood character
- Diverse neighborhood (Simpson 0.63)
- Race & ethnicity
- White 55% Hispanic / Latino 18% Black 14% Two or more races 11% Asian 10%
- Hispanic origin (detail)
- Mexican 13% Puerto Rican 2%
- Common ancestry
- Italian 2% Lithuanian 2% Slovak 2%
- Foreign-born
- 17% · Canada, China, Vietnam
- Languages at home
- 76% English-only · Spanish 12% Other Indo-European 5% Other Asian/Pacific 2%
Political lean MEDSL · Tarrant
- 2024 margin
- Lean R (+5.1) · D 46.7% · R 51.9% · Other 1.4%
- 2008→2024 swing
- +6.6pp toward D · 2008: -11.7pp · 2024: -5.1pp
- All cycles
- 2024: R+5.1 2020: D+0.2 2016: R+8.7 2012: R+15.7 2008: R+11.7
Not yet ingested
- Civics
- —
Market trends
- HPI YoY
- ▼ -256.90%
- Current HPI
- 257.252
- Rent YoY
- ▼ -0.08%
- Metro
- Dallas-Fort Worth-Arlington, TX
- State GDP YoY
- ▲ 3.95%
- F500 in state
- 110
Industry mix (Fortune 500 HQ in TX)
| Industry | F500 HQs | Revenue |
|---|---|---|
| Energy | 16 | $1,198B |
|
||
| Technology | 5 | $198B |
|
||
| Engineering / Construction | 4 | $72B |
|
||
| Energy Services | 3 | $60B |
|
||
| Utilities | 3 | $41B |
|
||
| Healthcare | 2 | $330B |
|
||
Price history
1 event — show timeline
- 2026-05-29 Listed $215,000 NTREIS
Property tax history
+3.0%/yrLatest (2025): $5,647 · +0.0% YoY. Source: county tax records.
Cash-flow waterfall
monthlySold comps — $/sqft
last 12 mo · ≤1 miLoading sold comps…