 🏷️ Likely Rental
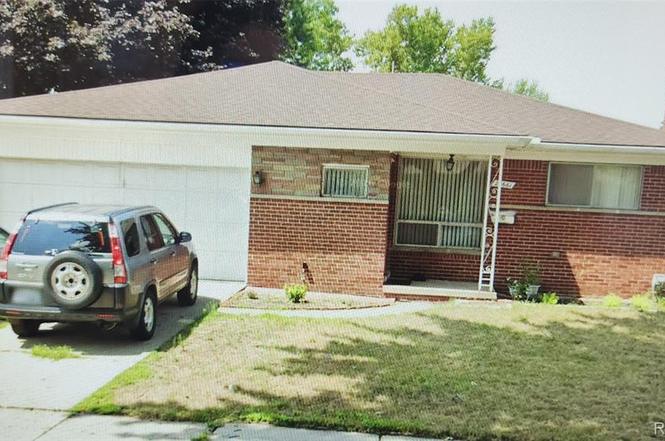
28661 Panama St · Warren, MI
Flood risk 1/10 · Minimal
- FEMA flood zone
- X (unshaded)
- Chance of flooding over 30 yrs
- 0.0%
- Est. flood insurance / yr
- $473 – $860
Fire risk 1/10 · Minimal
- Est. fire insurance / yr
- $784 – $1,456
Heat risk 3/10 · Minor
- Hot days now (above 97°F)
- 7 days/yr
- Hot days in 30 yrs
- 15 days/yr
Wind risk 1/10 · Minimal
- Chance of severe wind over 30 yrs
- —
Air-quality risk 3/10 · Minor
- Unhealthy air days now
- 3 days/yr
- Unhealthy air days in 30 yrs
- 5 days/yr
Risk factors via First Street. Map © Google.
Why this score? — see what drove the D+ grade
The composite is a weighted blend of 9 inputs, each scored 0–100. Each bar is that input's sub-score; the figure is the points it added to the 100-point composite (weight × sub-score).
- Cash flow +15.0/30.0
- ARV discount +7.5/15.0
- 1% rule +5.0/10.0
- DSCR +5.0/10.0
- Rent growth +4.5/5.0
- Livability +3.7/5.0
- Schools +2.5/10.0
- Condition / age +2.5/5.0
- Appreciation +0.0/10.0
$1,800
🖨 Deal sheet 📄 Offer letter ✓ Due diligence
Listing remarks MLS
Beautiful ready to move in House is available for lease on a nice neighborhood in Warren City. Three bedroom Brick Ranch with living room, family room, kitchen with large dining space, one and half bathroom, two car attached garage. All data are approximate but reliable.
Key facts
- 7,841 sq ft lot
- 2 garage spots
- Built 1960
Property features AI
Exterior
- Parking: Attached 2-car garage
- Utilities: Public water; Public sewer (sewer available)
- Home design: Single-family residence; One level; Ground-level entry with steps; Brick exterior
- Construction: Block foundation
- Exterior features: Paved road access; Pets not allowed
Interior
- Bathrooms: 1 full bathroom; 1 half bathroom
- Heating & cooling: Forced air heating (natural gas); No central air cooling
- Interior features: Partially finished basement; Basement present
Neighborhood map
What this means for you Summary
Snapshot
- This is a 3-bed/1.0-bath single-family listed at $2k.
Deal economics
- At list price, monthly cash flow is $2k ($20k/yr) — positive.
- The deal already cash-flows at list — no discount required.
- Meets the 1% rule at list price ($2k rent vs $2k).
- Cap rate 1092.2% vs local median 5.3% in Warren — top-decile yield for the area; either an underpriced asset or a hidden risk that comps aren't pricing in. Stress-test before assuming the spread holds.
Location & tenants
- Location reads 74/100 on livability (#171 in MI, #4,491 nationally) — a middle-class / working-renter tenant base. Strengths: commute A+, cost of living A+, housing A+; Watch: schools D, amenities D, employment D.
- Warren Consolidated Schools (urban): math 18% / reading 39% proficiency, ranked #373 of 540 in MI (top 69%) — low school quality limits family demand, transient renter base, plan for 1-2y turnover.
- Market conditions: Rents rising fast (+8.0%/yr); 96 active listings in the ZIP; 9 comparable units currently listed for rent nearby; rentals leasing fast (median 4d on market — plan ~1-2 weeks tenant-placement turnaround); 1,321 units permitted in Macomb County in 2024 (86 in 5+ unit buildings).
- This rent runs 34% of the median local income ($74k/yr) — at the standard rent-burdened threshold; future hikes will face affordability resistance.
Forward outlook
- Local home prices are declining (-3.0%/yr); year-one equity from $12 of loan paydown is wiped out by about $54 of value loss. Plan a longer hold.
- Macomb County population projected at +9% by 2050 — modest demand growth; plan on rents tracking national, not racing it.
- At projected returns (-3.0% appreciation + 8.0% rent growth), your $504 cash investment doubles in ~1 year — after that, you're playing with house money.
Negotiation context
- Only 7 days on market — expect competitive offers; lowballing is unlikely to land.
- 6 sale attempts since 30y ago with the ask held roughly flat each time — persistent listings suggest the price (not the market) is what's stuck; bring a comps-based counter.
Questions for the listing agent
- Built in 1960 — when were the roof, HVAC, electrical panel, plumbing, and water heater last replaced?
- Is there a deadline driving the sale (1031 exchange, divorce, estate, relocation)? That informs how much negotiation room exists.
- Schools are D-rated, which usually means shorter tenancies and higher turnover. Who's the typical renter profile here, and what's been the actual vacancy rate?
- Crime grade is D in this area — have there been break-ins, vandalism, or insurance claims at this property in the last 3 years? What carrier currently insures it and at what premium?
- The area grade is low — what's the realistic commute time and amenity access for the typical tenant pool here? Any planned neighborhood developments (good or bad) we should know about?
- What's the average days-on-market for RENTAL listings here right now (not sales)? A rising rental-DOM trend means longer vacancies and softer asking-rent achievability than the comps imply.
- What's the recent tenant-quality profile in this submarket — average credit score on applications, eviction rate, late-payment / NSF rate, and stable-employment percentage? A property-management company in the area should have these aggregated.
- How much new for-sale + rental construction is in the pipeline within 1–3 miles? Heavy new supply typically softens prices + rents 12–24 months out; constrained supply supports both.
Investment metrics
- 1% rule
- 115.42% ✓
- Cap rate
- 1092.17%
- Cash-on-cash
- 3878.14%
- DSCR
- 173.56
- GRM
- 0.1
CMA / ARV
- ARV (on-the-fly)
- $244,216
- Comps found
- 6
Show comp detail 6 sales within ~0.75 mi
| Address | Dist | Beds/Ba | Sqft | Sold | Price | $/sf | Match |
|---|---|---|---|---|---|---|---|
| 28644 Grobbel Ave | 0.10mi | 3/1.5 | 1,401 (+2%) | 6mo | $249,000 | $178 | 85 |
| 5600 Elmgrove Ave | 0.19mi | 3/2.0 | 1,256 (-8%) | 7mo | $238,500 | $190 | 67 |
| 29415 Cunningham Dr | 0.54mi | 3/1.5 | 1,316 (-4%) | 9mo | $225,000 | $171 | 59 |
| 4609 Hayman Dr | 0.49mi | 3/1.5 | 1,506 (+10%) | 6mo | $290,000 | $193 | 53 |
| 4719 E 12 Mile Rd | 0.35mi | 3/1.5 | 1,200 (-12%) | 10mo | $190,000 | $158 | 53 |
| 29659 Apolonia Dr | 0.73mi | 3/1.5 | 1,376 (+0%) | 14mo | $225,000 | $164 | 52 |
Match score weights: distance 35% · size 25% · config 20% · recency 20%. Top-matched comps best support the ARV.
Projected returns pro-forma
-3.0% appreciation · 8.0% rent growth · sell at horizon
- IRR
- —
- Equity multiple
- 228.10×
- Total profit
- $114,459
- Equity at exit
- $268
- IRR
- —
- Equity multiple
- 563.20×
- Total profit
- $283,350
- Equity at exit
- $156
Cash invested: $504 (down + closing). Projections, not guarantees.
Landlord ↔ Tenant lean methodology
- Overall (STATE)
- 62 Landlord-Friendly
- State Michigan
- 62 Landlord-Friendly · EVEN
- County
- — inherits STATE
- City
- — inherits STATE
ZIP-level market 48092
- Rents YoY
- 8.0%
- Active inventory
- 96
- Price-to-rent
- 0.1×
Monthly cashflow live
- Estimated rent
- $2,078 high interval (Pro) →
- Mortgage (P&I)
- −$9
- Tax est. 1.5%
- −$2 /mo · $27/yr
- Insurance
- −$1
- HOA
- −$0
- Vacancy / Maint / Mgmt
- −$436
- Net cashflow
- $1,629
Break-even live
UW: 25.0% down · 7.5% · 30yr · 1.5% tax · 5.0% vac · 8.0% maint · 8.0% mgmt
Financing live
Cash to close
- Down payment
- $450
- Closing costs
- $54
- Reserves months
- —
- Total cash needed
- —
Loan-product check · same deal, 3 products live
Conventional
25% down · 7.5% · 30yr
- Down + closing
- —
- Monthly P&I
- —
- Monthly cashflow
- —
- DSCR
- —
- Eligible?
- —
Personal DTI + credit; lowest rate.
DSCR
20% down · 8.5% · 30yr
- Down + closing
- —
- Monthly P&I
- —
- Monthly cashflow
- —
- DSCR
- —
- Eligible?
- —
No personal income docs; deal must DSCR.
Hard money
10% down · 12.0% · 12mo
- Down + closing
- —
- Monthly P&I
- —
- Monthly cashflow
- —
- DSCR
- —
- Eligible?
- —
Short-term bridge; refi at stabilization.
Rent comps 9 comps
| Address | Beds | Baths | Sqft | Rent | $/sqft | DOM | Units | Dist |
|---|---|---|---|---|---|---|---|---|
| 29745 Fox Run Cir Warren, MI | 3.0 | 2.0 | 1487 | $2,200 | $1.48 | 43d | 1 | 0.64mi |
| 27592 Strathmoor Dr Warren, MI | 4.0 | 1.5 | 1809 | $2,295 | $1.27 | 43d | 1 | 0.64mi |
| 28439 Wexford Dr Warren, MI | 3.0 | 1.5 | 1253 | $2,099 | $1.68 | 24d | 1 | 0.83mi |
| 28222 Saint Louise Dr Warren, MI | 3.0 | 2.0 | 1600 | $5,500 | $3.44 | 1d | 1 | 1.26mi |
| 26009 Pinehurst Dr Warren, MI | 2.0 | 1.5 | 1310 | $2,100 | $1.60 | 1d | 1 | 1.35mi |
| 31499 Mound Rd Warren, MI | 1.0–2.0 | 1.0 | 900 | $1,413 | $1.57 | 2d | 5 | 1.38mi |
| 4473 Buchanan Ave Warren, MI | 3.0 | 1.5 | 1064 | $1,650 | $1.55 | 24d | 1 | 1.39mi |
| 4385 Frazho Rd Warren, MI | 1.0–2.0 | 1.0 | 825 | $1,305 | $1.58 | 3d | 6 | 1.45mi |
| 27489 Parkview Blvd Warren, MI | 1.0–2.0 | 1.0–1.5 | 850 | $1,465 | $1.72 | 4d | 12 | 1.50mi |
Listing history 6 events
-
2026-06-18days on market $1,800 Active 7 DOM
-
2026-06-17days on market $1,800 Active 6 DOM
-
2026-06-16days on market $1,800 Active 5 DOM
-
2026-06-15days on market $1,800 Active 4 DOM
-
2026-06-13remarks 271-char remark
-
2026-06-13$1,800 Active 2 DOM
ⓘ Source: listings_history table (triggers on properties + properties_extension) + one-shot
backfill from property_details.listing_events for pre-trigger history.
Climate risk First Street
- Flood 1/10 Low FEMA zone X (unshaded) · 0% chance over 30 yrs
- Wildfire 1/10 Low
- Heat 3/10 Moderate 7 d/yr ≥97°F today · 15 d/yr by 30 yrs out
- Wind 1/10 Low
- Air quality 3/10 Moderate 3 unhealthy d/yr today · 5 by 30 yrs out
Nearby sold comps map
Loading sold comps map…
Walkable amenities ~0.75 mi
Loading nearby amenities…
Taxation est. · year 1
- Rental income
- $24,930
- − Mortgage interest
- −$101
- − Property taxes
- −$27
- − Insurance
- −$9
- − Repairs & maintenance
- −$1,994
- − Management
- −$1,994
- − Depreciation
- −$52
- Taxable income
- $20,752
- Est. tax owed @ 24.0%
- −$4,981
- After-tax cash flow
- $14,565/yr
For passive investors: Depreciation is non-cash, so a rental often shows a tax loss while cash-flowing — sheltering income. Rental losses are passive: they offset passive income freely, and up to $25,000/yr can offset ordinary (W-2) income if you actively participate and your MAGI is under $100k (phasing out to $0 by $150k); unused losses carry forward. On sale, claimed depreciation is recaptured at up to 25%, and gains may owe capital-gains tax (a 1031 exchange can defer both). Figures are a year-1 estimate at your 24.0% rate — not tax advice; consult a CPA.
Schools (NCES district)
- District
- Warren Consolidated Schools
- NCES district ID
- 2635190
- Math proficiency
- 18% ▼ -14.00%
- Reading proficiency
- 39% ▼ -8.00%
- Median HH income
- $52,259
- Composite
- 25.09/100
- National rank
- #7533
- State rank
- #373 of 540 in MI
Livability — Warren
- Score
- 74/100
- State rank
- #171
- US rank
- #4491
Category grades
Schools grade is shown separately in the Schools card above.
Census & demographics
- Census place
- Warren, MI
- County
- Macomb County · 638,552 people
- City population
- 114,937
- Metro
- Detroit-Warren-Dearborn, MI
- Population (ZIP)
- 27,374
- Household income
- $73,808
- Rent vs Own
- Severe rent burden
- 675.0
Population outlook (Macomb County) Hauer SSP2
- Today (2025)
- 925,296 people
- By 2030
- 948,226 · +2.5%
- By 2040
- 983,961 · +6.3%
- By 2050
- 1,010,200 · +9.2%
- By 2075
- 1,076,222 · +16.3%
- By 2100
- 1,077,065 · +16.4%
Race, ethnicity, and origin ACS 2023
- Neighborhood character
- Diverse neighborhood (Simpson 0.55)
- Race & ethnicity
- White 63% Asian 17% Black 14% Two or more races 4% Hispanic / Latino 2%
- Common ancestry
- Romanian 10% Arab 4% Subsaharan African 2%
- Foreign-born
- 22% · Vietnam, Canada, China
- Languages at home
- 70% English-only · Other Indo-European 11% Arabic 5% Russian/Polish/Slavic 3%
Political lean MEDSL · Macomb
- 2024 margin
- R (+13.7) · D 42.2% · R 55.9% · Other 1.9%
- 2008→2024 swing
- -22.3pp toward R · 2008: 8.6pp · 2024: -13.7pp
- All cycles
- 2024: R+13.7 2020: R+8.1 2016: R+11.6 2012: D+4.0 2008: D+8.6
Not yet ingested
- Civics
- —
Market trends
- HPI YoY
- ▼ -262.85%
- Current HPI
- 189.7524
- Rent YoY
- ▲ 8.03%
- Metro
- Detroit-Warren-Dearborn, MI
- State GDP YoY
- ▲ 1.37%
- F500 in state
- 28
Industry mix (Fortune 500 HQ in MI)
| Industry | F500 HQs | Revenue |
|---|---|---|
| Automotive Parts | 3 | $48B |
|
||
| Automotive | 2 | $372B |
|
||
| Chemicals | 1 | $45B |
|
||
| Automotive Retail | 1 | $29B |
|
||
| Healthcare / Medical Devices | 1 | $23B |
|
||
| Automotive Technology | 1 | $20B |
|
||
Price history
-98.3% since first listed15 events — show timeline
- 2026-06-11 Price Changed $1,800 REALCOMP
- 2026-06-10 Listed $1,800 MiRealSource-MiMLS
- 2026-06-10 Listed $1,900 REALCOMP
- 2026-05-23 Rental Removed $1,800 REALSOURCE
- 2026-04-25 Listed for Rent $1,800 REALSOURCE
- 2014-05-09 Sold (Public Records) $125,000 Public Records
- 2014-04-30 Sold (MLS) $125,000 REALCOMP
- 2014-04-30 Sold (MLS) $125,000 MiRealSource-MiMLS
- 2014-04-04 Listing Removed — MiRealSource-MiMLS
- 2014-03-25 Listed $124,900 REALCOMP
- 2014-03-25 Listed $124,900 MiRealSource-MiMLS
- 1997-01-28 Sold (Public Records) $104,000 Public Records
- 1996-06-19 Sold (MLS) $104,000 MiRealSource-MiMLS
- 1996-05-17 Listing Removed — MiRealSource-MiMLS
- 1996-05-10 Listed $108,500 MiRealSource-MiMLS
Property tax history
+3.8%/yrLatest (2025): $3,291 · +2.2% YoY. Source: county tax records.
Cash-flow waterfall
monthlySold comps — $/sqft
last 12 mo · ≤1 miLoading sold comps…